Old Shandon neighborhood in Columbia, South Carolina (SC), 29205 detailed profile
Settings
X


Business Search - 14 Million verified businesses
Area: 0.125 square miles
Population: 746
Population density:
| Old Shandon: | 5,981 people per square mile |
| Columbia: | 1,113 people per square mile |

- 63482.7%White
- 668.6%Black
- 395.1%Hispanic or Latino
- 233.0%Asian
- 50.7%Two or more races

Distribution of median household income
![Distribution of median household income]()
- 32Less than $10,000
- 131$10,000 to $19,999
- 86$20,000 to $29,999
- 23$30,000 to $39,999
- 28$40,000 to $49,999
- 12$50,000 to $59,999
- 23$60,000 to $74,999
- 5$75,000 to $99,999
- 4$100,000 to $124,999
- 37$125,000 to $149,999
- 46$150,000 to $199,999
- 73$200,000 or more

Distribution of owner-occupied house/condo value
![Distribution of owner-occupied house/condo value]()
- 19Less than $50,000
- 30$50,000 to $99,999
- 15$100,000 to $149,999
- 9$150,000 to $199,999
- 7$200,000 to $249,999
- 55$250,000 to $299,999
- 37$300,000 to $399,999
- 34$400,000 to $499,999
- 70$500,000 to $749,999
- 13$750,000 to $999,999
- 18$1,000,000 or more

Distribution of rent paid by renters
![Distribution of rent paid by renters]()
- 31$200 to $299
- 81$300 to $399
- 30$400 to $499
- 37$500 to $599
- 23$600 to $699
- 56$700 to $799
- 10$800 to $899
- 34$900 to $999
- 24$1,000 to $1,249
- 33$1,250 to $1,499
- 9$1,500 to $1,999
- 19$2,000 or more

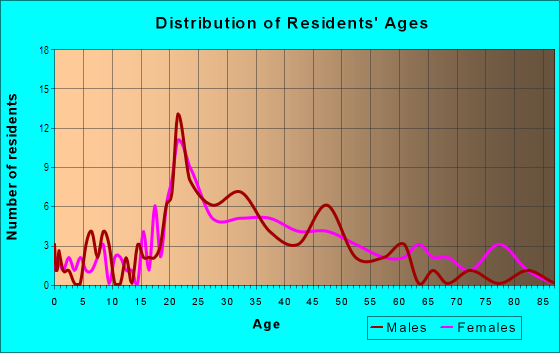
| Males: | 426 |
| Females: | 319 |
Males:
| This neighborhood: | 40.7 years |
| Whole city: | 27.5 years |
| This neighborhood: | 48.6 years |
| Whole city: | 29.3 years |
Average household size:
| Old Shandon: | 2.0 people |
| Columbia: | 2.1 people |
Percentage of family households:
| Old Shandon: | 19.6% |
| Columbia: | 35.2% |
| Here: | 23.7% |
| Columbia: | 27.5% |
Percentage of married-couple families with children (among all households):
| Old Shandon: | 56.7% |
| Columbia: | 23.7% |
Percentage of single-mother households (among all households):
| Old Shandon: | 4.0% |
| Columbia: | 12.1% |
Percentage of never married males 15 years old and over:
Percentage of never married females 15 years old and over:
| Old Shandon: | 25.3% |
| Columbia: | 31.8% |
Percentage of never married females 15 years old and over:
| Old Shandon: | 12.0% |
| city: | 26.3% |
Percentage of people that speak English not well or not at all:
| Old Shandon: | 0.0% |
| Columbia: | 0.6% |
Percentage of people born in this state:
Percentage of people born in another U.S. state:
Percentage of native residents but born outside the U.S.:
Percentage of foreign born residents:
| Here: | 50.8% |
| Columbia: | 53.1% |
Percentage of people born in another U.S. state:
| Old Shandon: | 45.2% |
| Columbia: | 40.1% |
Percentage of native residents but born outside the U.S.:
| Here: | 1.9% |
| city: | 2.2% |
Percentage of foreign born residents:
| Here: | 2.2% |
| Columbia: | 4.6% |

Owner-occupied
Renter-occupied


- Rooms in owner-occupied houses and condos in Old Shandon
- 01 room
- 02 rooms
- 133 rooms
- 54 rooms
- 55 rooms
- 66 rooms
- 67 rooms
- 828 rooms
- 679+ rooms

- Rooms in renter-occupied apartments in Old Shandon
- 761 room
- 112 rooms
- 633 rooms
- 454 rooms
- 805 rooms
- 146 rooms
- 237 rooms
- 68 rooms
- 29+ rooms
Owner-occupied
Renter-occupied

- Bedrooms in owner-occupied houses and condos in Old Shandon
- 0no bedroom
- 161 bedroom
- 102 bedrooms
- 543 bedrooms
- 1074 bedrooms
- 255+ bedrooms

- Bedrooms in renter-occupied apartments in Old Shandon
- 82no bedroom
- 741 bedroom
- 672 bedrooms
- 543 bedrooms
- 204 bedrooms
- 05+ bedrooms
Average number of cars or other vehicles available in houses/condos:
Average number of cars or other vehicles available in apartments:
| This neighborhood: | 2.2 |
| Columbia: | 1.8 |
Average number of cars or other vehicles available in apartments:
| Here: | 1.0 |
| city: | 1.3 |
Percentage of units with a mortgage:
| Old Shandon: | 37.9% |
| Columbia: | 67.5% |
Average estimated value of detached houses in 2022 (50.4% of all units):
| Old Shandon: | $362,897 |
| Columbia: | $305,357 |

- Year house built in Old Shandon
- 02020 or later
- 62010 to 2019
- 112000 to 2009
- 671990 to 1999
- 61980 to 1989
- 1281970 to 1979
- 221960 to 1969
- 641950 to 1959
- 1491940 to 1949
- 1261939 or earlier

City-data.com crime index for city in 2020 (higher means more crime):
| City: | 446.0 |
| U.S. average: | 219.5 |
Travel time to work (commute)
![Travel time to work (commute)]()
- 58Less than 5 minutes
- 465 to 9 minutes
- 14110 to 14 minutes
- 8015 to 19 minutes
- 1620 to 24 minutes
- 1725 to 29 minutes
- 1330 to 34 minutes
- 535 to 39 minutes
- 745 to 59 minutes
- 760 to 89 minutes
- 290 or more minutes

Means of transportation to work
![Means of transportation to work]()
- 83.7%247Drove a car alone
- 2.0%6Carpooled
- 2.4%7Bus
- 1.7%5Motorcycle
- 4.1%12Walked
- 2.0%6Other means
- 10.2%30Worked at home

Time leaving home to go to work
![Time leaving home to go to work]()
- 812:00 a.m. to 4:59 a.m.
- 35:00 a.m. to 5:29 a.m.
- 25:30 a.m. to 5:59 a.m.
- 286:00 a.m. to 6:29 a.m.
- 296:30 a.m. to 6:59 a.m.
- 387:00 a.m. to 7:29 a.m.
- 607:30 a.m. to 7:59 a.m.
- 848:00 a.m. to 8:29 a.m.
- 618:30 a.m. to 8:59 a.m.
- 309:00 a.m. to 9:59 a.m.
- 1110:00 a.m. to 10:59 a.m.
- 111:00 a.m. to 11:59 a.m.
- 1812:00 p.m. to 3:59 p.m.
- 64:00 p.m. to 11:59 p.m.

Occupations of males:
- Percentage of males in management occupations (except farmers):
Here: 21.6% city: 12.3%
- Percentage of males in business and financial operations occupations:
Here: 6.1% city: 4.6%
- Percentage of males in computer and mathematical occupations:
Here: 3.5% city: 3.7%
- Percentage of males in architecture and engineering occupations:
Here: 4.2% city: 2.3%
- Percentage of males in community and social services occupations:
Here: 1.5% city: 1.3%
- Percentage of males in legal occupations:
Here: 14.5% city: 2.9%
- Percentage of males in education, training, and library occupations:
Here: 11.3% city: 6.7%
- Percentage of males in arts, design, entertainment, sports, and media occupations:
Here: 6.6% city: 2.0%
- Percentage of males in service occupations:
Here: 6.1% city: 18.4%
- Percentage of males in farming, fishing, and forestry occupations:
Here: 4.2% city: 0.7%
- Percentage of males in construction, extraction, and maintenance occupations:
Here: 4.2% city: 4.8%
- Percentage of males in production occupations:
Here: 1.6% city: 3.9%
- Percentage of males in transportation occupations:
Here: 12.6% city: 4.1%
- Percentage of males in material moving occupations:
Here: 19.2% city: 5.8%
Occupations of females:
- Percentage of females in management occupations (except farmers):
Here: 12.4% city: 8.8%
- Percentage of females in business and financial operations occupations:
Here: 37.7% city: 6.4%
- Percentage of females in computer and mathematical occupations:
Here: 3.4% city: 2.3%
- Percentage of females in architecture and engineering occupations:
Here: 14.8% city: 0.8%
- Percentage of females in community and social services occupations:
Here: 4.6% city: 2.6%
- Percentage of females in legal occupations:
Here: 2.4% city: 1.6%
- Percentage of females in education, training, and library occupations:
Here: 16.4% city: 11.5%
- Percentage of females in arts, design, entertainment, sports, and media occupations:
Here: 4.1% city: 2.6%
- Percentage of females in healthcare practitioners and technical occupations:
Here: 5.9% city: 8.7%
- Percentage of females in service occupations:
Here: 11.2% city: 20.2%
- Percentage of females in sales and office occupations:
Here: 9.5% city: 26.9%
Percentage of people 16-64 in Armed Forces:
| Old Shandon: | 0.0% |
| Columbia: | 7.2% |
Education in this neighborhood (subdivision or community):
- Percentage of people 3 years and older in K-12 schools:
Old Shandon: 10.9% Columbia: 12.2%
- Percentage of people 3 years and older in undergraduate colleges:
Old Shandon: 9.8% Columbia: 16.2%
- Percentage of people 3 years and older in grad. or professional schools:
Old Shandon: 7.7% Columbia: 3.5%
- Percentage of students K-12 enrolled in private schools:
Old Shandon: 16.5% Columbia: 24.2%
Percentage of population below poverty level:
| Old Shandon: | 27.0% |
| Columbia: | 20.7% |
Median year owner moved in (as recorded in 2022):
Median year renter moved in (as recorded in 2022):
| Old Shandon: | 2005 |
| Columbia: | 2013 |
Median year renter moved in (as recorded in 2022):
| Old Shandon: | 2018 |
| Columbia: | 2022 |
Percentage of married-couple families with both working:
| Old Shandon: | 56.9% |
| Columbia: | 72.3% |

- 69.8%Electricity
- 23.1%Utility gas
- 3.7%Solar energy
- 1.8%No fuel used
- 1.6%Bottled, tank, or LP gas
Roads and streets:
Preston St
Length: 0.63 miles
Direction: E-W
Address range: 2300 to 2799
Direction: E-W
Address range: 2300 to 2799
Cypress St
Length: 0.51 miles
Direction: E-W
Address range: 2400 to 2799
Direction: E-W
Address range: 2400 to 2799
Meadow St
Length: 0.20 miles
Direction: N-S
Address range: 800 to 999
Direction: N-S
Address range: 800 to 999
Lee St
Length: 0.12 miles
Direction: E-W
Address range: 2300 to 2399
Direction: E-W
Address range: 2300 to 2399
King St
Length: 0.10 miles
Direction: N-S
Address range: 900 to 999
Direction: N-S
Address range: 900 to 999
Queen St
Length: 0.10 miles
Direction: N-S
Address range: 900 to 999
Direction: N-S
Address range: 900 to 999
Heidt St
Length: 0.10 miles
Direction: N-S
Address range: 800 to 899
Direction: N-S
Address range: 800 to 899
Woodrow St
Length: 0.10 miles
Direction: N-S
Address range: 900 to 999
Direction: N-S
Address range: 900 to 999
Maple St
Length: 0.10 miles
Direction: N-S
Address range: 900 to 999
Direction: N-S
Address range: 900 to 999