Northfield neighborhood in Denver, Colorado (CO), 80229 detailed profile
Settings
X


Business Search - 14 Million verified businesses
Area: 0.318 square miles
Population: 2,219
Population density:
| Northfield: | 6,976 people per square mile |
| Denver: | 4,651 people per square mile |

- 1,23155.5%Hispanic or Latino
- 88239.7%White
- 431.9%Two or more races
- 411.8%Asian
- 210.9%Black
- 10.05%Some other race

Median household income in 2022:
| Northfield: | $71,277 |
| Denver: | $88,213 |
Distribution of median household income
![Distribution of median household income]()
- 34Less than $10,000
- 136$10,000 to $19,999
- 46$20,000 to $29,999
- 34$30,000 to $39,999
- 52$40,000 to $49,999
- 112$50,000 to $59,999
- 23$60,000 to $74,999
- 126$75,000 to $99,999
- 139$100,000 to $124,999
- 59$125,000 to $149,999
- 34$150,000 to $199,999
- 13$200,000 or more

Distribution of owner-occupied house/condo value
![Distribution of owner-occupied house/condo value]()
- 105Less than $50,000
- 7$50,000 to $99,999
- 16$100,000 to $149,999
- 7$150,000 to $199,999
- 74$200,000 to $249,999
- 31$250,000 to $299,999
- 209$300,000 to $399,999
- 115$400,000 to $499,999
- 16$500,000 to $749,999
- 4$1,000,000 or more

Distribution of rent paid by renters
![Distribution of rent paid by renters]()
- 17Less than $100
- 17$200 to $299
- 9$400 to $499
- 9$500 to $599
- 2$600 to $699
- 3$800 to $899
- 5$900 to $999
- 5$1,000 to $1,249
- 39$1,250 to $1,499
- 60$1,500 to $1,999
- 61$2,000 or more

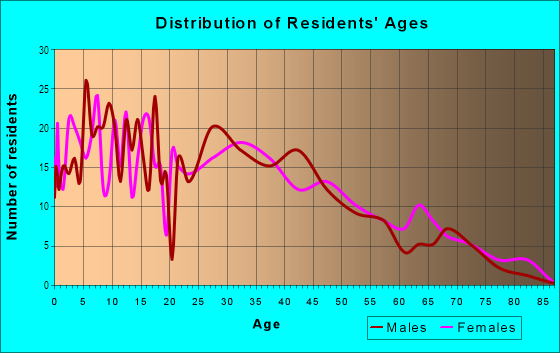
| Males: | 1,211 |
| Females: | 1,007 |
Males:
| This neighborhood: | 38.0 years |
| Whole city: | 35.2 years |
| This neighborhood: | 41.6 years |
| Whole city: | 35.1 years |
Average household size:
| Northfield: | 19.7 people |
| Denver: | 28.0 people |
Percentage of family households:
| Northfield: | 51.1% |
| Denver: | 35.1% |
| Here: | 48.1% |
| Denver: | 32.5% |
Percentage of married-couple families with children (among all households):
| Northfield: | 29.8% |
| Denver: | 32.4% |
Percentage of single-mother households (among all households):
| Northfield: | 3.2% |
| Denver: | 10.3% |
Percentage of never married males 15 years old and over:
Percentage of never married females 15 years old and over:
| Northfield: | 22.8% |
| Denver: | 25.0% |
Percentage of never married females 15 years old and over:
| Northfield: | 15.6% |
| city: | 20.8% |
Percentage of people that speak English not well or not at all:
| Northfield: | 12.5% |
| Denver: | 3.9% |
Percentage of people born in this state:
Percentage of people born in another U.S. state:
Percentage of native residents but born outside the U.S.:
Percentage of foreign born residents:
| Here: | 50.6% |
| Denver: | 38.5% |
Percentage of people born in another U.S. state:
| Northfield: | 25.7% |
| Denver: | 46.1% |
Percentage of native residents but born outside the U.S.:
| Here: | 7.9% |
| city: | 1.7% |
Percentage of foreign born residents:
| Here: | 15.8% |
| Denver: | 13.8% |

Owner-occupied
Renter-occupied


- Rooms in owner-occupied houses and condos in Northfield
- 31 room
- 02 rooms
- 1043 rooms
- 294 rooms
- 725 rooms
- 476 rooms
- 607 rooms
- 438 rooms
- 2059+ rooms

- Rooms in renter-occupied apartments in Northfield
- 01 room
- 432 rooms
- 173 rooms
- 194 rooms
- 305 rooms
- 26 rooms
- 537 rooms
- 138 rooms
- 109+ rooms
Owner-occupied
Renter-occupied

- Bedrooms in owner-occupied houses and condos in Northfield
- 3no bedroom
- 1041 bedroom
- 352 bedrooms
- 1723 bedrooms
- 1534 bedrooms
- 965+ bedrooms

- Bedrooms in renter-occupied apartments in Northfield
- 0no bedroom
- 431 bedroom
- 242 bedrooms
- 383 bedrooms
- 654 bedrooms
- 05+ bedrooms
Average number of cars or other vehicles available in houses/condos:
Average number of cars or other vehicles available in apartments:
| This neighborhood: | 2.7 |
| Denver: | 1.9 |
Average number of cars or other vehicles available in apartments:
| Here: | 2.2 |
| city: | 1.3 |
Percentage of units with a mortgage:
| Northfield: | 50.9% |
| Denver: | 75.6% |
Housing prices:
- Average estimated value of detached houses in 2022 (82.2% of all units):
Northfield: $287,833 Colorado: $676,667
- Average estimated value of townhouses or other attached units in 2022 (8.0% of all units):
This neighborhood: $235,851 Colorado: $526,340

- Year house built in Northfield
- 02020 or later
- 192010 to 2019
- 422000 to 2009
- 41990 to 1999
- 951980 to 1989
- 1291970 to 1979
- 1361960 to 1969
- 2561950 to 1959
- 1041940 to 1949
- 81939 or earlier

City-data.com crime index for city in 2020 (higher means more crime):
| City: | 519.0 |
| U.S. average: | 219.5 |
Travel time to work (commute)
![Travel time to work (commute)]()
- 5Less than 5 minutes
- 155 to 9 minutes
- 8910 to 14 minutes
- 9515 to 19 minutes
- 16820 to 24 minutes
- 4425 to 29 minutes
- 26530 to 34 minutes
- 4835 to 39 minutes
- 8840 to 44 minutes
- 5045 to 59 minutes
- 3060 to 89 minutes
- 3990 or more minutes

Means of transportation to work
![Means of transportation to work]()
- 75.1%796Drove a car alone
- 13.2%140Carpooled
- 4.2%44Bus
- 1.1%12Light rail, streetcar or trolley
- 0.5%5Walked
- 1.0%11Other means
- 5.1%54Worked at home

Time leaving home to go to work
![Time leaving home to go to work]()
- 10312:00 a.m. to 4:59 a.m.
- 555:00 a.m. to 5:29 a.m.
- 565:30 a.m. to 5:59 a.m.
- 1416:00 a.m. to 6:29 a.m.
- 1686:30 a.m. to 6:59 a.m.
- 1777:00 a.m. to 7:29 a.m.
- 547:30 a.m. to 7:59 a.m.
- 518:00 a.m. to 8:29 a.m.
- 68:30 a.m. to 8:59 a.m.
- 119:00 a.m. to 9:59 a.m.
- 910:00 a.m. to 10:59 a.m.
- 2211:00 a.m. to 11:59 a.m.
- 5412:00 p.m. to 3:59 p.m.
- 394:00 p.m. to 11:59 p.m.

Occupations of males:
- Percentage of males in management occupations (except farmers):
Here: 6.7% city: 15.4%
- Percentage of males in business and financial operations occupations:
Here: 4.5% city: 8.3%
- Percentage of males in architecture and engineering occupations:
Here: 2.9% city: 4.5%
- Percentage of males in community and social services occupations:
Here: 3.9% city: 0.9%
- Percentage of males in arts, design, entertainment, sports, and media occupations:
Here: 7.2% city: 3.1%
- Percentage of males in service occupations:
Here: 12.1% city: 11.9%
- Percentage of males in sales and office occupations:
Here: 13.8% city: 15.4%
- Percentage of males in construction, extraction, and maintenance occupations:
Here: 14.9% city: 8.0%
- Percentage of males in production occupations:
Here: 6.2% city: 3.2%
- Percentage of males in transportation occupations:
Here: 6.1% city: 4.2%
Occupations of females:
- Percentage of females in business and financial operations occupations:
Here: 2.0% city: 10.0%
- Percentage of females in computer and mathematical occupations:
Here: 2.7% city: 2.9%
- Percentage of females in architecture and engineering occupations:
Here: 2.7% city: 1.5%
- Percentage of females in life, physical, and social science occupations:
Here: 5.2% city: 1.5%
- Percentage of females in education, training, and library occupations:
Here: 4.7% city: 7.9%
- Percentage of females in healthcare practitioners and technical occupations:
Here: 10.4% city: 10.2%
- Percentage of females in service occupations:
Here: 27.9% city: 16.2%
- Percentage of females in sales and office occupations:
Here: 18.4% city: 21.4%
- Percentage of females in construction, extraction, and maintenance occupations:
Here: 4.5% city: 0.4%
- Percentage of females in production occupations:
Here: 11.1% city: 1.7%
- Percentage of females in material moving occupations:
Here: 10.4% city: 1.4%
Education in this neighborhood (subdivision or community):
- Percentage of people 3 years and older in K-12 schools:
Northfield: 15.3% Denver: 12.7%
- Percentage of people 3 years and older in undergraduate colleges:
Northfield: 6.6% Denver: 4.1%
- Percentage of people 3 years and older in grad. or professional schools:
Northfield: 0.5% Denver: 2.2%
- Percentage of students K-12 enrolled in private schools:
Northfield: 18.9% Denver: 11.0%
Percentage of population below poverty level:
| Northfield: | 16.7% |
| Denver: | 11.8% |
Median year owner moved in (as recorded in 2022):
| Northfield: | 2003 |
| Denver: | 2014 |
Percentage of married-couple families with both working:
| Northfield: | 38.1% |
| Denver: | 74.1% |

- 78.8%Utility gas
- 13.2%Electricity
- 7.4%Bottled, tank, or LP gas
- 0.7%Solar energy
Roads and streets:
McElwain Blvd
Length: 1.66 miles
Directions: E-W, SE-NW
Address range: 2000 to 8651
Directions: E-W, SE-NW
Address range: 2000 to 8651
McDougal St
Length: 0.67 miles
Directions: E-W, N-S, SE-NW
Address range: 1900 to 8699
Directions: E-W, N-S, SE-NW
Address range: 1900 to 8699
E 84th Ave
Length: 0.59 miles
Directions: E-W, SE-NW, SW-NE
Address range: 2000 to 2626
Directions: E-W, SE-NW, SW-NE
Address range: 2000 to 2626
Rainbow Ave
Length: 0.53 miles
Directions: N-S, SW-NE
Address range: 8400 to 8792
Directions: N-S, SW-NE
Address range: 8400 to 8792
Mabel Ave
Length: 0.48 miles
Direction: E-W
Address range: 1780 to 2359
Direction: E-W
Address range: 1780 to 2359
Richard Rd
Length: 0.42 miles
Directions: N-S, SW-NE
Address range: 8450 to 8759
Directions: N-S, SW-NE
Address range: 8450 to 8759
Jolene Dr
Length: 0.39 miles
Directions: E-W, SW-NE
Address range: 1840 to 8729
Directions: E-W, SW-NE
Address range: 1840 to 8729
York St
Length: 0.35 miles
Directions: N-S, SE-NW
Address range: 8400 to 8599
Directions: N-S, SE-NW
Address range: 8400 to 8599
Hope Ct
Length: 0.28 miles
Directions: E-W, N-S, SE-NW, SW-NE
Address range: 8400 to 8636
Directions: E-W, N-S, SE-NW, SW-NE
Address range: 8400 to 8636
Hopkins Dr
Length: 0.19 miles
Directions: N-S, SW-NE
Address range: 8608 to 8758
Directions: N-S, SW-NE
Address range: 8608 to 8758
Devonshire Blvd
Length: 0.17 miles
Direction: N-S
Address range: 8400 to 8521
Direction: N-S
Address range: 8400 to 8521
Larry Ct
Length: 0.11 miles
Directions: E-W, SE-NW
Address range: 1900 to 2099
Directions: E-W, SE-NW
Address range: 1900 to 2099
Explorador Calle (Explorador Calle Ave)
Length: 0.06 miles
Direction: N-S
Address range: 8370 to 8399
Direction: N-S
Address range: 8370 to 8399
Evelyn Ct
Length: 0.01 miles
Direction: SW-NE
Direction: SW-NE