North Center neighborhood in Chicago, Illinois (IL), 60613, 60618 detailed profile
Settings
X


Business Search - 14 Million verified businesses
Area: 1.126 square miles
Population: 30,246
Population density:
| North Center: | 26,868 people per square mile |
| Chicago: | 11,734 people per square mile |

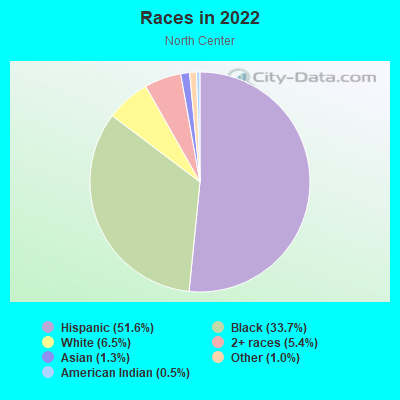
- 23,48969.2%White
- 3,2519.6%Hispanic or Latino
- 2,7488.1%Some other race
- 2,5787.6%Asian
- 1,2923.8%Two or more races
- 5741.7%Black
- 170.05%American Indian

Distribution of median household income
![Distribution of median household income]()
- 632Less than $10,000
- 914$10,000 to $19,999
- 993$20,000 to $29,999
- 840$30,000 to $39,999
- 1,026$40,000 to $49,999
- 629$50,000 to $59,999
- 714$60,000 to $74,999
- 1,669$75,000 to $99,999
- 1,514$100,000 to $124,999
- 1,224$125,000 to $149,999
- 1,347$150,000 to $199,999
- 4,284$200,000 or more

Distribution of owner-occupied house/condo value
![Distribution of owner-occupied house/condo value]()
- 429Less than $50,000
- 626$100,000 to $149,999
- 883$150,000 to $199,999
- 501$200,000 to $249,999
- 657$250,000 to $299,999
- 683$300,000 to $399,999
- 942$400,000 to $499,999
- 1,755$500,000 to $749,999
- 1,297$750,000 to $999,999
- 2,540$1,000,000 or more

Distribution of rent paid by renters
![Distribution of rent paid by renters]()
- 423$200 to $299
- 1,257$300 to $399
- 357$400 to $499
- 310$500 to $599
- 786$600 to $699
- 753$700 to $799
- 318$800 to $899
- 824$900 to $999
- 951$1,000 to $1,249
- 1,190$1,250 to $1,499
- 2,065$1,500 to $1,999
- 1,955$2,000 or more

| Males: | 15,392 |
| Females: | 14,853 |
Males:
| This neighborhood: | 37.9 years |
| Whole city: | 35.3 years |
| This neighborhood: | 37.3 years |
| Whole city: | 36.2 years |
Average household size:
| North Center: | 2.4 people |
| Chicago: | 2.3 people |
Percentage of family households:
| North Center: | 47.2% |
| Chicago: | 36.7% |
| Here: | 51.0% |
| Chicago: | 30.4% |
Percentage of married-couple families with children (among all households):
| North Center: | 38.8% |
| Chicago: | 24.1% |
Percentage of single-mother households (among all households):
| North Center: | 3.9% |
| Chicago: | 16.0% |
Percentage of never married males 15 years old and over:
Percentage of never married females 15 years old and over:
| North Center: | 20.3% |
| Chicago: | 24.5% |
Percentage of never married females 15 years old and over:
| North Center: | 16.6% |
| city: | 24.9% |
Percentage of people that speak English not well or not at all:
| North Center: | 1.5% |
| Chicago: | 7.1% |
Percentage of people born in this state:
Percentage of people born in another U.S. state:
Percentage of native residents but born outside the U.S.:
Percentage of foreign born residents:
| Here: | 54.8% |
| Chicago: | 58.6% |
Percentage of people born in another U.S. state:
| North Center: | 34.1% |
| Chicago: | 18.8% |
Percentage of native residents but born outside the U.S.:
| Here: | 4.2% |
| city: | 2.1% |
Percentage of foreign born residents:
| Here: | 9.2% |
| Chicago: | 20.6% |

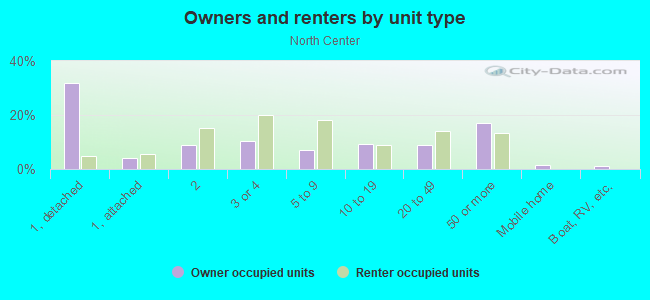
Owner-occupied
Renter-occupied

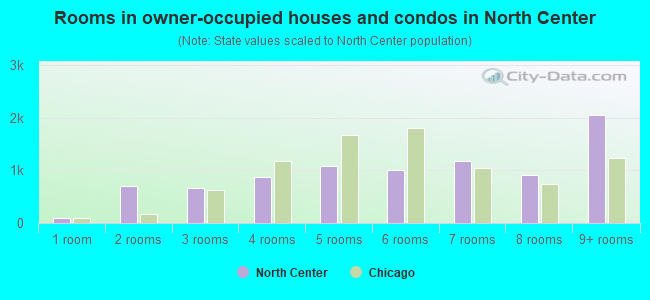
- Rooms in owner-occupied houses and condos in North Center
- 881 room
- 7102 rooms
- 6703 rooms
- 8844 rooms
- 1,0945 rooms
- 1,0046 rooms
- 1,1777 rooms
- 9058 rooms
- 2,0579+ rooms
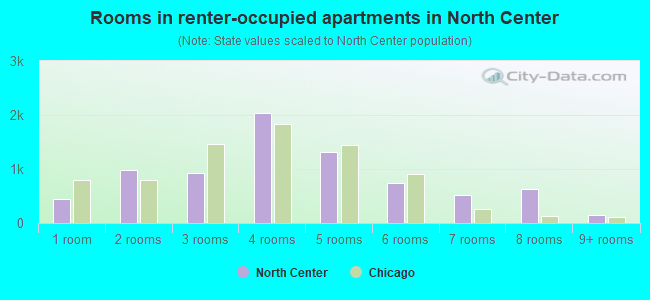
- Rooms in renter-occupied apartments in North Center
- 4481 room
- 9842 rooms
- 9313 rooms
- 2,0464 rooms
- 1,3215 rooms
- 7336 rooms
- 5217 rooms
- 6308 rooms
- 1459+ rooms
Owner-occupied
Renter-occupied
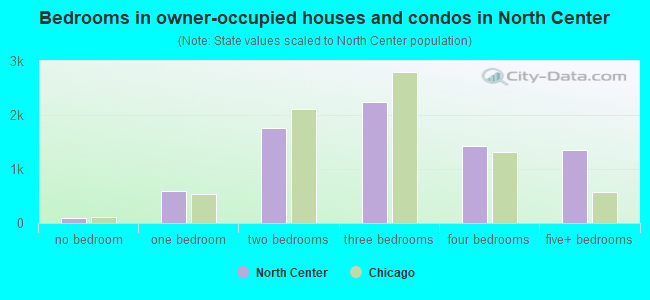
- Bedrooms in owner-occupied houses and condos in North Center
- 88no bedroom
- 5881 bedroom
- 1,7682 bedrooms
- 2,2393 bedrooms
- 1,4234 bedrooms
- 1,3505+ bedrooms
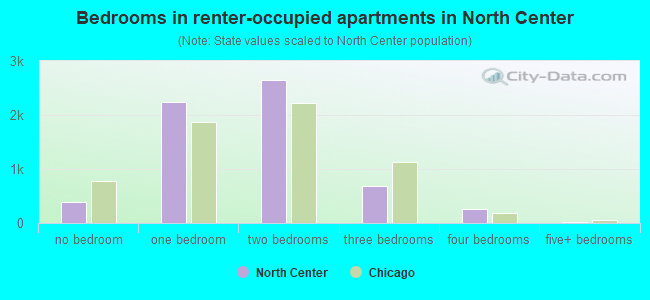
- Bedrooms in renter-occupied apartments in North Center
- 388no bedroom
- 2,2341 bedroom
- 2,6512 bedrooms
- 6903 bedrooms
- 2564 bedrooms
- 265+ bedrooms
Average number of cars or other vehicles available in houses/condos:
Average number of cars or other vehicles available in apartments:
| This neighborhood: | 1.6 |
| Chicago: | 1.5 |
Average number of cars or other vehicles available in apartments:
| Here: | 0.9 |
| city: | 0.8 |
Percentage of units with a mortgage:
| North Center: | 73.3% |
| Chicago: | 64.7% |
Housing prices:
- Average estimated value of detached houses in 2022 (26.9% of all units):
North Center: $1,202,322 Chicago: $393,455
- Average estimated value of housing units in 2-unit structures in 2022 (18.6% of all units):
This neighborhood: $630,909 Chicago: $320,802
- Average estimated '22 value of housing units in 5-or-more-unit structures (17.5% of all units):
North Center: $413,824 Chicago: $416,975
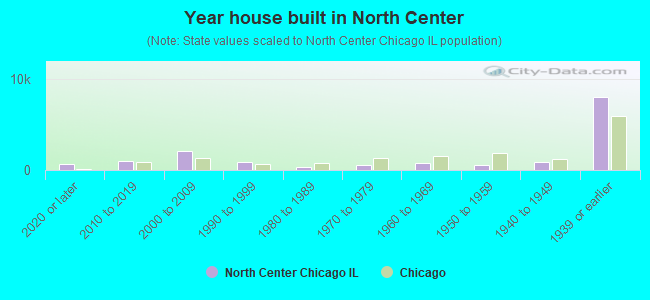
- Year house built in North Center
- 6102020 or later
- 1,0322010 to 2019
- 2,1342000 to 2009
- 8841990 to 1999
- 3391980 to 1989
- 5441970 to 1979
- 7231960 to 1969
- 5691950 to 1959
- 9121940 to 1949
- 8,0041939 or earlier
City-data.com crime index for city in 2020 (higher means more crime):
| City: | 421.1 |
| U.S. average: | 219.5 |
Travel time to work (commute)
![Travel time to work (commute)]()
- 253Less than 5 minutes
- 4815 to 9 minutes
- 54510 to 14 minutes
- 78615 to 19 minutes
- 82120 to 24 minutes
- 90125 to 29 minutes
- 1,74230 to 34 minutes
- 83535 to 39 minutes
- 1,49740 to 44 minutes
- 3,00845 to 59 minutes
- 1,02360 to 89 minutes
- 13290 or more minutes

Means of transportation to work
![Means of transportation to work]()
- 35.9%6,390Drove a car alone
- 7.3%1,306Carpooled
- 4.1%727Bus
- 15.9%2,834Subway or elevated rail
- 1.6%289Long-distance train or commuter rail
- 1.9%333Light rail, streetcar or trolley
- 0.4%70Ferryboat
- 2.4%422Taxi
- 2.2%390Motorcycle
- 3.6%636Bicycle
- 5.8%1,037Walked
- 3.3%582Other means
- 30.5%5,441Worked at home

Time leaving home to go to work
![Time leaving home to go to work]()
- 26612:00 a.m. to 4:59 a.m.
- 2015:00 a.m. to 5:29 a.m.
- 2975:30 a.m. to 5:59 a.m.
- 8256:00 a.m. to 6:29 a.m.
- 7916:30 a.m. to 6:59 a.m.
- 1,6157:00 a.m. to 7:29 a.m.
- 1,8337:30 a.m. to 7:59 a.m.
- 2,3328:00 a.m. to 8:29 a.m.
- 1,3448:30 a.m. to 8:59 a.m.
- 7819:00 a.m. to 9:59 a.m.
- 43410:00 a.m. to 10:59 a.m.
- 24211:00 a.m. to 11:59 a.m.
- 51612:00 p.m. to 3:59 p.m.
- 5644:00 p.m. to 11:59 p.m.

Occupations of males:
- Percentage of males in management occupations (except farmers):
Here: 20.0% city: 12.0%
- Percentage of males in business and financial operations occupations:
Here: 11.4% city: 7.9%
- Percentage of males in computer and mathematical occupations:
Here: 11.3% city: 6.3%
- Percentage of males in architecture and engineering occupations:
Here: 2.1% city: 2.4%
- Percentage of males in community and social services occupations:
Here: 2.6% city: 1.2%
- Percentage of males in legal occupations:
Here: 6.5% city: 2.1%
- Percentage of males in education, training, and library occupations:
Here: 3.5% city: 4.2%
- Percentage of males in arts, design, entertainment, sports, and media occupations:
Here: 7.6% city: 3.0%
- Percentage of males in healthcare practitioners and technical occupations:
Here: 3.0% city: 3.1%
- Percentage of males in service occupations:
Here: 9.1% city: 15.8%
- Percentage of males in sales and office occupations:
Here: 17.8% city: 14.5%
- Percentage of males in production occupations:
Here: 1.8% city: 5.6%
Occupations of females:
- Percentage of females in management occupations (except farmers):
Here: 16.8% city: 11.1%
- Percentage of females in business and financial operations occupations:
Here: 12.6% city: 9.2%
- Percentage of females in computer and mathematical occupations:
Here: 2.5% city: 2.3%
- Percentage of females in life, physical, and social science occupations:
Here: 2.3% city: 1.2%
- Percentage of females in community and social services occupations:
Here: 1.7% city: 3.0%
- Percentage of females in legal occupations:
Here: 3.1% city: 2.3%
- Percentage of females in education, training, and library occupations:
Here: 12.6% city: 8.8%
- Percentage of females in arts, design, entertainment, sports, and media occupations:
Here: 5.4% city: 3.1%
- Percentage of females in healthcare practitioners and technical occupations:
Here: 12.6% city: 8.5%
- Percentage of females in service occupations:
Here: 7.9% city: 19.6%
- Percentage of females in sales and office occupations:
Here: 20.0% city: 23.3%
- Percentage of females in material moving occupations:
Here: 1.0% city: 1.9%
Education in this neighborhood (subdivision or community):
- Percentage of people 3 years and older in K-12 schools:
North Center: 24.7% Chicago: 14.6%
- Percentage of people 3 years and older in undergraduate colleges:
North Center: 3.6% Chicago: 5.1%
- Percentage of people 3 years and older in grad. or professional schools:
North Center: 4.2% Chicago: 2.6%
- Percentage of students K-12 enrolled in private schools:
North Center: 45.9% Chicago: 15.6%
Percentage of population below poverty level:
| North Center: | 4.0% |
| Chicago: | 17.2% |
Median year owner moved in (as recorded in 2022):
| North Center: | 2009 |
| Chicago: | 2010 |
Percentage of married-couple families with both working:
| North Center: | 97.1% |
| Chicago: | 69.2% |
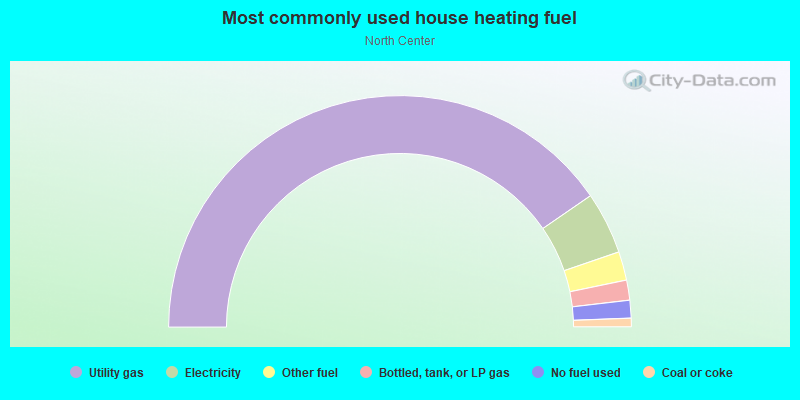
- 80.8%Utility gas
- 8.7%Electricity
- 4.0%Other fuel
- 2.8%Bottled, tank, or LP gas
- 2.5%No fuel used
- 1.2%Coal or coke
Highways in this neighborhood:
State Rte 19 (W Irving Park Rd)
Length: 1.42 miles
Direction: E-W
Address range: 1800 to 2633
Direction: E-W
Address range: 1800 to 2633
Roads and streets:
W Addison St
Length: 1.56 miles
Direction: E-W
Address range: 1761 to 2699
Direction: E-W
Address range: 1761 to 2699
W Berteau Ave
Length: 1.38 miles
Direction: E-W
Address range: 1800 to 2699
Direction: E-W
Address range: 1800 to 2699
W Belle Plaine Ave
Length: 1.37 miles
Direction: E-W
Address range: 1800 to 2699
Direction: E-W
Address range: 1800 to 2699
N Ravenswood Ave
Length: 1.36 miles
Direction: N-S
Address range: 3600 to 4399
Direction: N-S
Address range: 3600 to 4399
W Montrose Ave
Length: 1.27 miles
Direction: E-W
Address range: 1800 to 2529
Direction: E-W
Address range: 1800 to 2529
W Cullom Ave
Length: 1.26 miles
Directions: E-W, SW-NE
Address range: 1900 to 2599
Directions: E-W, SW-NE
Address range: 1900 to 2599
N Lincoln Ave
Length: 1.19 miles
Direction: SE-NW
Address range: 3600 to 4399
Direction: SE-NW
Address range: 3600 to 4399
W Byron St
Length: 1.17 miles
Direction: E-W
Address range: 1800 to 2499
Direction: E-W
Address range: 1800 to 2499
W Grace St
Length: 1.17 miles
Direction: E-W
Address range: 1800 to 2499
Direction: E-W
Address range: 1800 to 2499
W Waveland Ave
Length: 1.09 miles
Direction: E-W
Address range: 1800 to 2499
Direction: E-W
Address range: 1800 to 2499
N Damen Ave
Length: 1.01 miles
Direction: N-S
Address range: 3600 to 4399
Direction: N-S
Address range: 3600 to 4399
N Leavitt St
Length: 1.01 miles
Direction: N-S
Address range: 3600 to 4399
Direction: N-S
Address range: 3600 to 4399
N Western Ave
Length: 1.01 miles
Direction: N-S
Address range: 3600 to 4399
Direction: N-S
Address range: 3600 to 4399
N Bell Ave
Length: 1.01 miles
Direction: N-S
Address range: 3600 to 4399
Direction: N-S
Address range: 3600 to 4399
N Oakley Ave
Length: 1.01 miles
Direction: N-S
Address range: 3600 to 4399
Direction: N-S
Address range: 3600 to 4399
N Campbell Ave
Length: 0.94 miles
Directions: N-S, SE-NW
Address range: 3600 to 4399
Directions: N-S, SE-NW
Address range: 3600 to 4399
N Wolcott Ave
Length: 0.88 miles
Direction: N-S
Address range: 3600 to 4399
Direction: N-S
Address range: 3600 to 4399
N Claremont Ave
Length: 0.83 miles
Directions: N-S, SE-NW
Address range: 3600 to 4399
Directions: N-S, SE-NW
Address range: 3600 to 4399
W Warner Ave
Length: 0.82 miles
Direction: E-W
Address range: 1800 to 2499
Direction: E-W
Address range: 1800 to 2499
W Bradley Pl
Length: 0.78 miles
Direction: E-W
Address range: 1900 to 2699
Direction: E-W
Address range: 1900 to 2699
W Cuyler Ave
Length: 0.77 miles
Direction: E-W
Address range: 1800 to 2499
Direction: E-W
Address range: 1800 to 2499
N Hoyne Ave
Length: 0.75 miles
Direction: N-S
Address range: 3600 to 4399
Direction: N-S
Address range: 3600 to 4399
W Pensacola Ave
Length: 0.68 miles
Direction: E-W
Address range: 2000 to 2599
Direction: E-W
Address range: 2000 to 2599
W Hutchinson St
Length: 0.67 miles
Directions: E-W, SE-NW, SW-NE
Address range: 2000 to 4214
Directions: E-W, SE-NW, SW-NE
Address range: 2000 to 4214
N Rockwell St
Length: 0.55 miles
Directions: N-S, SW-NE
Address range: 3800 to 4199
Directions: N-S, SW-NE
Address range: 3800 to 4199
W Berenice Ave
Length: 0.48 miles
Direction: E-W
Address range: 1800 to 2499
Direction: E-W
Address range: 1800 to 2499
N Seeley Ave
Length: 0.38 miles
Direction: N-S
Address range: 3600 to 3999
Direction: N-S
Address range: 3600 to 3999
N Hamilton Ave
Length: 0.38 miles
Direction: N-S
Address range: 3600 to 3999
Direction: N-S
Address range: 3600 to 3999
W Patterson Ave
Length: 0.28 miles
Directions: E-W, SW-NE
Address range: 1801 to 1999
Directions: E-W, SW-NE
Address range: 1801 to 1999
W Larchmont Ave
Length: 0.27 miles
Direction: E-W
Address range: 1800 to 1999
Direction: E-W
Address range: 1800 to 1999
N Honore St
Length: 0.25 miles
Direction: N-S
Address range: 4200 to 4399
Direction: N-S
Address range: 4200 to 4399
N Winchester Ave
Length: 0.25 miles
Direction: N-S
Address range: 4200 to 4399
Direction: N-S
Address range: 4200 to 4399
N Maplewood Ave
Length: 0.25 miles
Direction: N-S
Address range: 4000 to 4199
Direction: N-S
Address range: 4000 to 4199
N Talman Ave
Length: 0.19 miles
Directions: N-S, SW-NE
Address range: 3600 to 3730
Directions: N-S, SW-NE
Address range: 3600 to 3730
W Dakin St
Length: 0.16 miles
Direction: E-W
Address range: 2400 to 2499
Direction: E-W
Address range: 2400 to 2499
N Artesian Ave
Length: 0.12 miles
Direction: N-S
Address range: 3600 to 3741
Direction: N-S
Address range: 3600 to 3741
Lincoln Ave
Length: 0.02 miles
Direction: SE-NW
Direction: SE-NW
Railroad features:
Chicago and North Western RR
Length: 1.01 miles
Direction: N-S
Direction: N-S
Other features:
Chicago River N Br
Length: 0.25 miles
Direction: N-S
Direction: N-S