Maple Grove Estates neighborhood in Fredericksburg, Virginia (VA), 22406 detailed profile
Settings
X


Business Search - 14 Million verified businesses
Area: 0.162 square miles
Population: 1,996
Population density:
| Maple Grove Estates: | 12,334 people per square mile |
| Fredericksburg: | 2,687 people per square mile |

- 88444.0%White
- 49024.4%Asian
- 37018.4%Hispanic or Latino
- 1427.1%Black
- 1085.4%Two or more races
- 160.8%Some other race

Median household income in 2022:
| Maple Grove Estates: | $155,309 |
| Fredericksburg: | $83,445 |
Distribution of median household income
![Distribution of median household income]()
- 13$10,000 to $19,999
- 7$20,000 to $29,999
- 19$30,000 to $39,999
- 25$40,000 to $49,999
- 39$50,000 to $59,999
- 30$60,000 to $74,999
- 28$75,000 to $99,999
- 96$100,000 to $124,999
- 31$125,000 to $149,999
- 87$150,000 to $199,999
- 145$200,000 or more

Distribution of owner-occupied house/condo value
![Distribution of owner-occupied house/condo value]()
- 10$50,000 to $99,999
- 6$150,000 to $199,999
- 2$300,000 to $399,999
- 31$400,000 to $499,999
- 282$500,000 to $749,999
- 96$750,000 to $999,999
- 32$1,000,000 or more

Distribution of rent paid by renters
![Distribution of rent paid by renters]()
- 5$1,500 to $1,999
- 70$2,000 or more

Median rent in 2022:
| Maple Grove Estates: | $2,758 |
| Fredericksburg: | $1,317 |
| Males: | 960 |
| Females: | 1,036 |
Males:
| This neighborhood: | 43.3 years |
| Whole city: | 30.9 years |
| This neighborhood: | 51.8 years |
| Whole city: | 31.0 years |
Average household size:
| Maple Grove Estates: | 4.5 people |
| Fredericksburg: | 2.3 people |
Percentage of family households:
| Maple Grove Estates: | 45.1% |
| Fredericksburg: | 41.8% |
| Here: | 76.7% |
| Fredericksburg: | 35.4% |
Percentage of married-couple families with children (among all households):
| Maple Grove Estates: | 24.8% |
| Fredericksburg: | 21.2% |
Percentage of single-mother households (among all households):
| Maple Grove Estates: | 0.6% |
| Fredericksburg: | 15.3% |
Percentage of never married males 15 years old and over:
Percentage of never married females 15 years old and over:
| Maple Grove Estates: | 19.9% |
| Fredericksburg: | 21.8% |
Percentage of never married females 15 years old and over:
| Maple Grove Estates: | 18.3% |
| city: | 24.0% |
Percentage of people that speak English not well or not at all:
| Maple Grove Estates: | 0.0% |
| Fredericksburg: | 3.5% |
Percentage of people born in this state:
Percentage of people born in another U.S. state:
Percentage of native residents but born outside the U.S.:
Percentage of foreign born residents:
| Here: | 34.5% |
| Fredericksburg: | 50.3% |
Percentage of people born in another U.S. state:
| Maple Grove Estates: | 19.0% |
| Fredericksburg: | 36.1% |
Percentage of native residents but born outside the U.S.:
| Here: | 6.9% |
| city: | 2.3% |
Percentage of foreign born residents:
| Here: | 39.6% |
| Fredericksburg: | 11.3% |
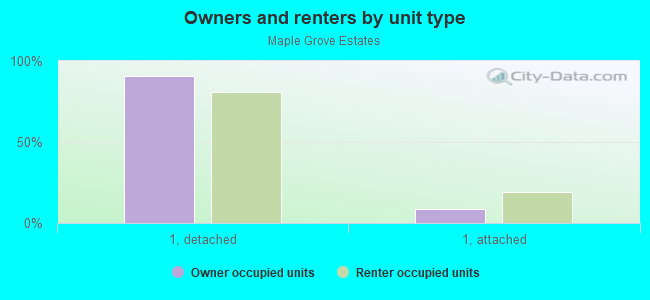
Owner-occupied
Renter-occupied

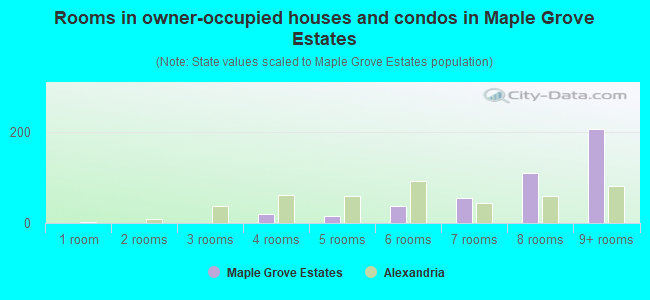
- Rooms in owner-occupied houses and condos in Maple Grove Estates
- 01 room
- 02 rooms
- 13 rooms
- 194 rooms
- 155 rooms
- 386 rooms
- 557 rooms
- 1118 rooms
- 2079+ rooms
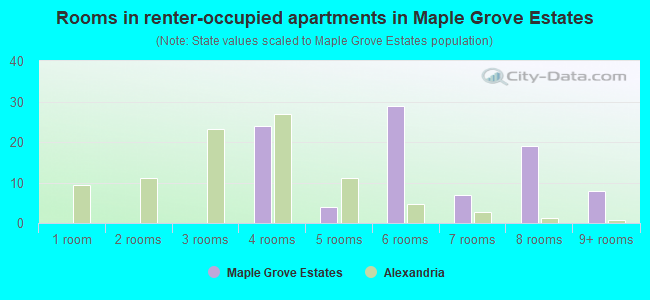
- Rooms in renter-occupied apartments in Maple Grove Estates
- 01 room
- 02 rooms
- 03 rooms
- 244 rooms
- 45 rooms
- 296 rooms
- 77 rooms
- 198 rooms
- 89+ rooms
Owner-occupied
Renter-occupied

- Bedrooms in owner-occupied houses and condos in Maple Grove Estates
- 0no bedroom
- 01 bedroom
- 132 bedrooms
- 1073 bedrooms
- 2074 bedrooms
- 1195+ bedrooms
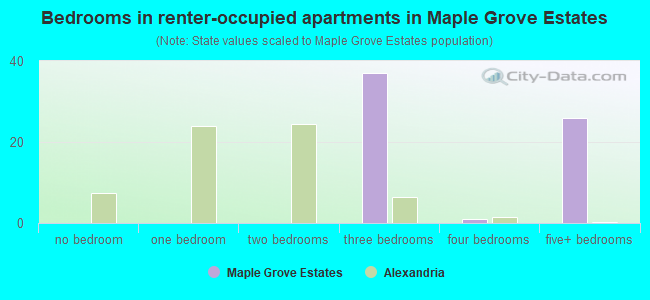
- Bedrooms in renter-occupied apartments in Maple Grove Estates
- 0no bedroom
- 01 bedroom
- 02 bedrooms
- 373 bedrooms
- 14 bedrooms
- 265+ bedrooms
Average number of cars or other vehicles available in houses/condos:
Average number of cars or other vehicles available in apartments:
| This neighborhood: | 2.2 |
| Fredericksburg: | 2.1 |
Average number of cars or other vehicles available in apartments:
| Here: | 2.5 |
| city: | 1.3 |
Percentage of units with a mortgage:
| Maple Grove Estates: | 76.7% |
| Fredericksburg: | 71.9% |
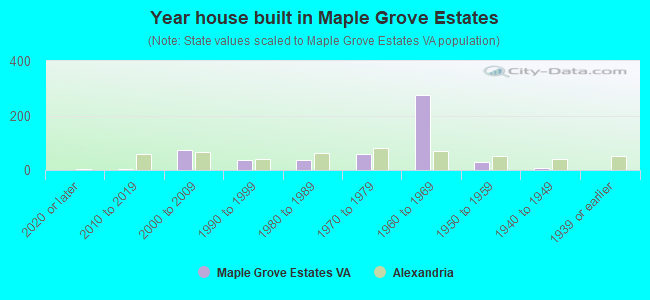
- Year house built in Maple Grove Estates
- 02020 or later
- 32010 to 2019
- 752000 to 2009
- 361990 to 1999
- 351980 to 1989
- 601970 to 1979
- 2741960 to 1969
- 291950 to 1959
- 91940 to 1949
- 01939 or earlier
City-data.com crime index for city in 2020 (higher means more crime):
| City: | 256.5 |
| U.S. average: | 219.5 |
Travel time to work (commute)
![Travel time to work (commute)]()
- 21Less than 5 minutes
- 1185 to 9 minutes
- 5310 to 14 minutes
- 13915 to 19 minutes
- 20420 to 24 minutes
- 9025 to 29 minutes
- 26430 to 34 minutes
- 4835 to 39 minutes
- 8740 to 44 minutes
- 8245 to 59 minutes
- 6560 to 89 minutes
- 1290 or more minutes

Means of transportation to work
![Means of transportation to work]()
- 68.5%643Drove a car alone
- 16.0%150Carpooled
- 1.6%15Bus
- 0.4%4Subway or elevated rail
- 1.3%12Taxi
- 0.2%2Motorcycle
- 4.3%40Walked
- 0.1%1Other means
- 11.7%110Worked at home

Time leaving home to go to work
![Time leaving home to go to work]()
- 912:00 a.m. to 4:59 a.m.
- 555:00 a.m. to 5:29 a.m.
- 695:30 a.m. to 5:59 a.m.
- 726:00 a.m. to 6:29 a.m.
- 1046:30 a.m. to 6:59 a.m.
- 547:00 a.m. to 7:29 a.m.
- 1077:30 a.m. to 7:59 a.m.
- 2108:00 a.m. to 8:29 a.m.
- 1628:30 a.m. to 8:59 a.m.
- 1259:00 a.m. to 9:59 a.m.
- 4510:00 a.m. to 10:59 a.m.
- 711:00 a.m. to 11:59 a.m.
- 9612:00 p.m. to 3:59 p.m.
- 714:00 p.m. to 11:59 p.m.

Occupations of males:
- Percentage of males in management occupations (except farmers):
Here: 10.8% city: 11.5%
- Percentage of males in business and financial operations occupations:
Here: 5.5% city: 8.2%
- Percentage of males in computer and mathematical occupations:
Here: 22.7% city: 10.4%
- Percentage of males in architecture and engineering occupations:
Here: 3.5% city: 2.4%
- Percentage of males in life, physical, and social science occupations:
Here: 2.2% city: 1.3%
- Percentage of males in legal occupations:
Here: 4.3% city: 2.7%
- Percentage of males in healthcare practitioners and technical occupations:
Here: 1.4% city: 2.9%
- Percentage of males in service occupations:
Here: 10.8% city: 13.8%
- Percentage of males in sales and office occupations:
Here: 14.6% city: 13.6%
- Percentage of males in construction, extraction, and maintenance occupations:
Here: 7.9% city: 8.4%
- Percentage of males in production occupations:
Here: 6.5% city: 2.9%
- Percentage of males in transportation occupations:
Here: 6.3% city: 7.2%
- Percentage of males in material moving occupations:
Here: 4.1% city: 3.8%
Occupations of females:
- Percentage of females in management occupations (except farmers):
Here: 11.0% city: 13.1%
- Percentage of females in business and financial operations occupations:
Here: 4.9% city: 12.3%
- Percentage of females in computer and mathematical occupations:
Here: 1.4% city: 2.0%
- Percentage of females in architecture and engineering occupations:
Here: 1.4% city: 0.5%
- Percentage of females in community and social services occupations:
Here: 3.9% city: 3.3%
- Percentage of females in education, training, and library occupations:
Here: 5.2% city: 11.3%
- Percentage of females in healthcare practitioners and technical occupations:
Here: 6.5% city: 6.4%
- Percentage of females in service occupations:
Here: 24.4% city: 17.6%
- Percentage of females in sales and office occupations:
Here: 29.3% city: 23.2%
- Percentage of females in production occupations:
Here: 11.8% city: 4.9%
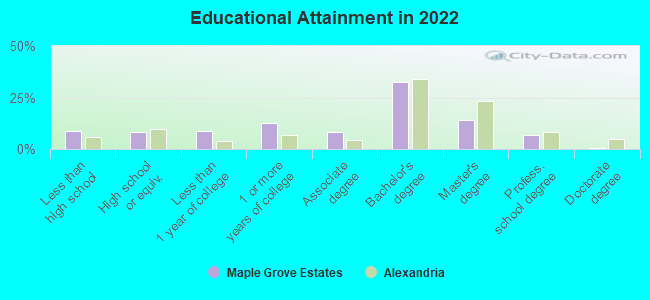
Education in this neighborhood (subdivision or community):
- Percentage of people 3 years and older in K-12 schools:
Maple Grove Estates: 16.2% Fredericksburg: 14.8%
- Percentage of people 3 years and older in undergraduate colleges:
Maple Grove Estates: 9.1% Fredericksburg: 14.6%
- Percentage of people 3 years and older in grad. or professional schools:
Maple Grove Estates: 1.8% Fredericksburg: 1.6%
- Percentage of students K-12 enrolled in private schools:
Maple Grove Estates: 13.8% Fredericksburg: 12.4%
Percentage of population below poverty level:
| Maple Grove Estates: | 4.8% |
| Fredericksburg: | 18.0% |
Median year owner moved in (as recorded in 2022):
Median year renter moved in (as recorded in 2022):
| Maple Grove Estates: | 2351 |
| Fredericksburg: | 2012 |
Median year renter moved in (as recorded in 2022):
| Maple Grove Estates: | 2355 |
| Fredericksburg: | 2019 |
Percentage of married-couple families with both working:
| Maple Grove Estates: | 74.0% |
| Fredericksburg: | 58.8% |
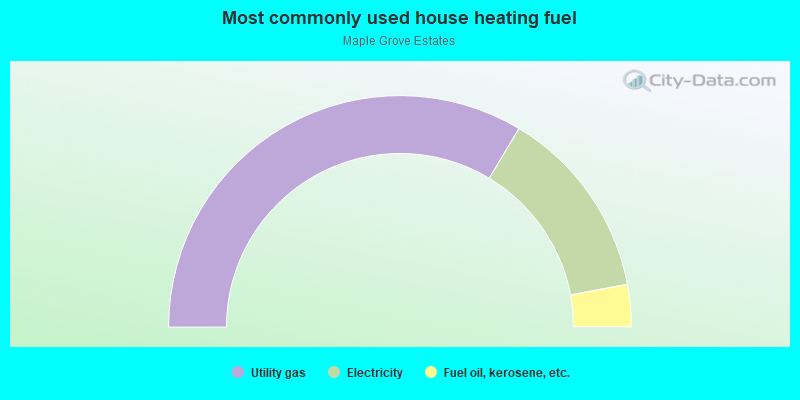
- 67.2%Utility gas
- 26.9%Electricity
- 5.9%Fuel oil, kerosene, etc.