Madison Square neighborhood in Chicago, Illinois (IL), 60644 detailed profile
Settings
X


Business Search - 14 Million verified businesses
Area: 0.226 square miles
Population: 3,646
Population density:
| Madison Square: | 16,130 people per square mile |
| Chicago: | 11,734 people per square mile |

- 3,18585.6%Black
- 2957.9%Hispanic or Latino
- 2236.0%Two or more races
- 190.5%White

Median household income in 2022:
| Madison Square: | $35,690 |
| Chicago: | $70,386 |
Distribution of median household income
![Distribution of median household income]()
- 206Less than $10,000
- 178$10,000 to $19,999
- 534$20,000 to $29,999
- 346$30,000 to $39,999
- 257$40,000 to $49,999
- 190$50,000 to $59,999
- 154$60,000 to $74,999
- 82$75,000 to $99,999
- 230$100,000 to $124,999
- 108$125,000 to $149,999
- 92$150,000 to $199,999

Distribution of owner-occupied house/condo value
![Distribution of owner-occupied house/condo value]()
- 57Less than $50,000
- 74$50,000 to $99,999
- 164$100,000 to $149,999
- 157$150,000 to $199,999
- 240$200,000 to $249,999
- 102$250,000 to $299,999
- 88$300,000 to $399,999
- 30$400,000 to $499,999
- 78$1,000,000 or more

Distribution of rent paid by renters
![Distribution of rent paid by renters]()
- 17$200 to $299
- 59$300 to $399
- 376$500 to $599
- 124$600 to $699
- 210$700 to $799
- 138$800 to $899
- 173$900 to $999
- 413$1,000 to $1,249
- 132$1,250 to $1,499
- 100$1,500 to $1,999

Median rent in 2022:
| Madison Square: | $1,016 |
| Chicago: | $1,161 |
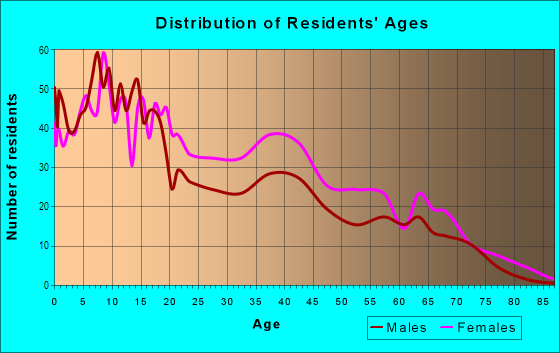
| Males: | 1,953 |
| Females: | 1,693 |
Males:
| This neighborhood: | 34.6 years |
| Whole city: | 35.3 years |
| This neighborhood: | 38.1 years |
| Whole city: | 36.2 years |
Average household size:
| Madison Square: | 3.1 people |
| Chicago: | 2.3 people |
Percentage of family households:
| Madison Square: | 47.3% |
| Chicago: | 36.7% |
| Here: | 14.2% |
| Chicago: | 30.4% |
Percentage of married-couple families with children (among all households):
| Madison Square: | 24.2% |
| Chicago: | 24.1% |
Percentage of single-mother households (among all households):
| Madison Square: | 17.9% |
| Chicago: | 16.0% |
Percentage of never married males 15 years old and over:
Percentage of never married females 15 years old and over:
| Madison Square: | 34.5% |
| Chicago: | 24.5% |
Percentage of never married females 15 years old and over:
| Madison Square: | 21.1% |
| city: | 24.9% |
Percentage of people that speak English not well or not at all:
| Madison Square: | 0.6% |
| Chicago: | 7.1% |
Percentage of people born in this state:
Percentage of people born in another U.S. state:
Percentage of native residents but born outside the U.S.:
Percentage of foreign born residents:
| Here: | 85.9% |
| Chicago: | 58.6% |
Percentage of people born in another U.S. state:
| Madison Square: | 9.8% |
| Chicago: | 18.8% |
Percentage of native residents but born outside the U.S.:
| Here: | 0.6% |
| city: | 2.1% |
Percentage of foreign born residents:
| Here: | 3.7% |
| Chicago: | 20.6% |

Owner-occupied
Renter-occupied


- Rooms in owner-occupied houses and condos in Madison Square
- 01 room
- 02 rooms
- 1513 rooms
- 734 rooms
- 1415 rooms
- 1566 rooms
- 847 rooms
- 548 rooms
- 739+ rooms

- Rooms in renter-occupied apartments in Madison Square
- 221 room
- 812 rooms
- 1003 rooms
- 1654 rooms
- 2355 rooms
- 3746 rooms
- 1677 rooms
- 2698 rooms
- 1719+ rooms
Owner-occupied
Renter-occupied

- Bedrooms in owner-occupied houses and condos in Madison Square
- 0no bedroom
- 1511 bedroom
- 782 bedrooms
- 2133 bedrooms
- 404 bedrooms
- 735+ bedrooms

- Bedrooms in renter-occupied apartments in Madison Square
- 22no bedroom
- 1141 bedroom
- 3172 bedrooms
- 5243 bedrooms
- 1484 bedrooms
- 835+ bedrooms
Average number of cars or other vehicles available in houses/condos:
Average number of cars or other vehicles available in apartments:
| This neighborhood: | 1.8 |
| Chicago: | 1.5 |
Average number of cars or other vehicles available in apartments:
| Here: | 0.7 |
| city: | 0.8 |
Percentage of units with a mortgage:
| Madison Square: | 67.4% |
| Chicago: | 64.7% |
Average estimated value of housing units in 2-unit structures in 2022 (55.7% of all units):
| This neighborhood: | $404,272 |
| Chicago: | $320,802 |

- Year house built in Madison Square
- 02020 or later
- 3422010 to 2019
- 282000 to 2009
- 2171990 to 1999
- 01980 to 1989
- 641970 to 1979
- 1861960 to 1969
- 1351950 to 1959
- 1601940 to 1949
- 6601939 or earlier

City-data.com crime index for city in 2020 (higher means more crime):
| City: | 421.1 |
| U.S. average: | 219.5 |
Travel time to work (commute)
![Travel time to work (commute)]()
- 19Less than 5 minutes
- 235 to 9 minutes
- 2710 to 14 minutes
- 4915 to 19 minutes
- 5320 to 24 minutes
- 4525 to 29 minutes
- 23030 to 34 minutes
- 3135 to 39 minutes
- 4840 to 44 minutes
- 9045 to 59 minutes
- 37560 to 89 minutes
- 6590 or more minutes

Means of transportation to work
![Means of transportation to work]()
- 37.7%541Drove a car alone
- 24.2%347Carpooled
- 45.3%651Bus
- 15.6%224Subway or elevated rail
- 0.1%1Bicycle
- 7.0%100Walked
- 13.3%191Worked at home

Time leaving home to go to work
![Time leaving home to go to work]()
- 3112:00 a.m. to 4:59 a.m.
- 625:00 a.m. to 5:29 a.m.
- 415:30 a.m. to 5:59 a.m.
- 776:00 a.m. to 6:29 a.m.
- 1376:30 a.m. to 6:59 a.m.
- 617:00 a.m. to 7:29 a.m.
- 447:30 a.m. to 7:59 a.m.
- 478:00 a.m. to 8:29 a.m.
- 928:30 a.m. to 8:59 a.m.
- 1389:00 a.m. to 9:59 a.m.
- 3010:00 a.m. to 10:59 a.m.
- 2011:00 a.m. to 11:59 a.m.
- 23612:00 p.m. to 3:59 p.m.
- 624:00 p.m. to 11:59 p.m.

Occupations of males:
- Percentage of males in management occupations (except farmers):
Here: 3.6% city: 12.0%
- Percentage of males in arts, design, entertainment, sports, and media occupations:
Here: 4.7% city: 3.0%
- Percentage of males in service occupations:
Here: 13.7% city: 15.8%
- Percentage of males in sales and office occupations:
Here: 10.1% city: 14.5%
- Percentage of males in construction, extraction, and maintenance occupations:
Here: 4.4% city: 5.6%
- Percentage of males in production occupations:
Here: 10.9% city: 5.6%
- Percentage of males in transportation occupations:
Here: 4.6% city: 6.5%
- Percentage of males in material moving occupations:
Here: 47.4% city: 5.4%
Occupations of females:
- Percentage of females in management occupations (except farmers):
Here: 4.0% city: 11.1%
- Percentage of females in business and financial operations occupations:
Here: 4.8% city: 9.2%
- Percentage of females in community and social services occupations:
Here: 6.5% city: 3.0%
- Percentage of females in healthcare practitioners and technical occupations:
Here: 2.4% city: 8.5%
- Percentage of females in service occupations:
Here: 30.8% city: 19.6%
- Percentage of females in sales and office occupations:
Here: 21.2% city: 23.3%
- Percentage of females in production occupations:
Here: 19.7% city: 3.0%
- Percentage of females in transportation occupations:
Here: 9.9% city: 1.5%
- Percentage of females in material moving occupations:
Here: 4.5% city: 1.9%
Education in this neighborhood (subdivision or community):
- Percentage of people 3 years and older in K-12 schools:
Madison Square: 48.8% Chicago: 14.6%
- Percentage of people 3 years and older in undergraduate colleges:
Madison Square: 7.3% Chicago: 5.1%
- Percentage of people 3 years and older in grad. or professional schools:
Madison Square: 9.0% Chicago: 2.6%
- Percentage of students K-12 enrolled in private schools:
Madison Square: 44.9% Chicago: 15.6%
Percentage of population below poverty level:
| Madison Square: | 46.8% |
| Chicago: | 17.2% |
Median year renter moved in (as recorded in 2022):
| Madison Square: | 2015 |
| Chicago: | 2020 |
Percentage of married-couple families with both working:
| Madison Square: | 249.4% |
| Chicago: | 69.2% |

- 77.1%Utility gas
- 12.2%Electricity
- 5.5%No fuel used
- 3.1%Other fuel
- 2.1%Bottled, tank, or LP gas
Highways in this neighborhood:
State Rte 50 (S Cicero Ave)
Length: 0.19 miles
Directions: N-S, SE-NW
Address range: 1 to 228
Directions: N-S, SE-NW
Address range: 1 to 228
State Rte 50 (N Cicero Ave)
Length: 0.18 miles
Direction: N-S
Address range: 1 to 144
Direction: N-S
Address range: 1 to 144
Roads and streets:
W West End Ave
Length: 0.70 miles
Direction: E-W
Address range: 4600 to 4999
Direction: E-W
Address range: 4600 to 4999
W Washington Blvd
Length: 0.69 miles
Direction: E-W
Address range: 4600 to 4999
Direction: E-W
Address range: 4600 to 4999
W Madison St
Length: 0.68 miles
Direction: E-W
Address range: 4600 to 5013
Direction: E-W
Address range: 4600 to 5013
W Adams St
Length: 0.62 miles
Direction: E-W
Address range: 4600 to 4999
Direction: E-W
Address range: 4600 to 4999
W Monroe St
Length: 0.62 miles
Direction: E-W
Address range: 4556 to 4999
Direction: E-W
Address range: 4556 to 4999
W Quincy St
Length: 0.29 miles
Direction: E-W
Address range: 4800 to 4999
Direction: E-W
Address range: 4800 to 4999
S Kenton Ave
Length: 0.21 miles
Direction: N-S
Direction: N-S
S Kilpatrick Ave
Length: 0.21 miles
Direction: N-S
Address range: 1 to 249
Direction: N-S
Address range: 1 to 249
S Lavergne Ave
Length: 0.19 miles
Direction: N-S
Address range: 1 to 229
Direction: N-S
Address range: 1 to 229
N Lamon Ave
Length: 0.18 miles
Direction: N-S
Address range: 1 to 125
Direction: N-S
Address range: 1 to 125
N Kilpatrick Ave
Length: 0.18 miles
Direction: N-S
Address range: 1 to 199
Direction: N-S
Address range: 1 to 199
N Lavergne Ave
Length: 0.18 miles
Direction: N-S
Address range: 1 to 142
Direction: N-S
Address range: 1 to 142
Railroad features:
Branch of C RR
Length: 0.19 miles
Direction: N-S
Direction: N-S
Chicago and North Western RR
Length: 0.18 miles
Direction: N-S
Direction: N-S