Longfellow neighborhood in Kansas City, Missouri (MO), 64108, 64109 detailed profile
Settings
X

Business Search - 14 Million verified businesses
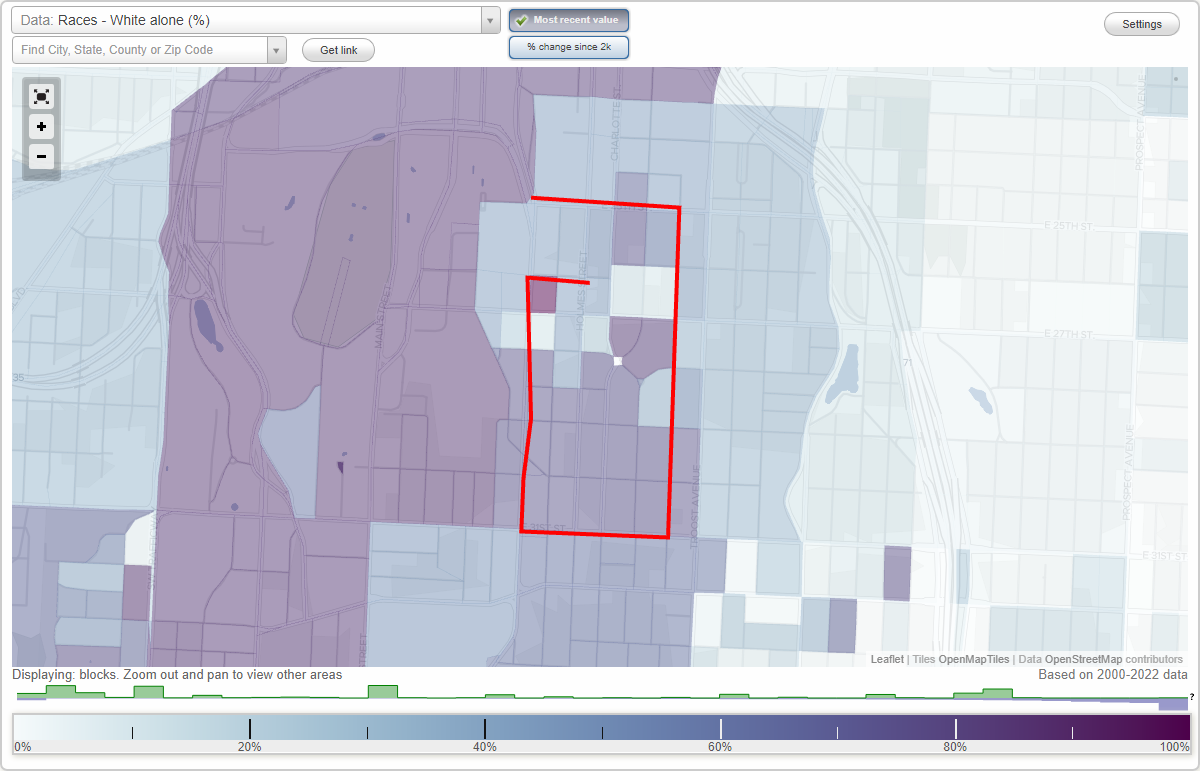
Area: 0.257 square miles
Population: 2,115
Population density:
| Longfellow: | 8,226 people per square mile |
| Kansas City: | 1,624 people per square mile |

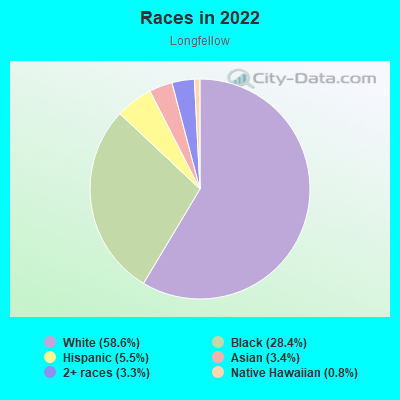
- 1,24158.6%White
- 60028.4%Black
- 1175.5%Hispanic or Latino
- 723.4%Asian
- 693.3%Two or more races
- 170.8%Native Hawaiian and Other
Pacific Islander
Median household income in 2022:
| Longfellow: | $53,537 |
| Kansas City: | $62,175 |
Distribution of median household income
![Distribution of median household income]()
- 130Less than $10,000
- 115$10,000 to $19,999
- 93$20,000 to $29,999
- 53$30,000 to $39,999
- 260$40,000 to $49,999
- 19$50,000 to $59,999
- 93$60,000 to $74,999
- 138$75,000 to $99,999
- 115$100,000 to $124,999
- 53$125,000 to $149,999
- 77$150,000 to $199,999
- 84$200,000 or more

Distribution of owner-occupied house/condo value
![Distribution of owner-occupied house/condo value]()
- 42$100,000 to $149,999
- 17$150,000 to $199,999
- 86$200,000 to $249,999
- 112$250,000 to $299,999
- 29$300,000 to $399,999
- 47$400,000 to $499,999
- 26$500,000 to $749,999

Distribution of rent paid by renters
![Distribution of rent paid by renters]()
- 62Less than $100
- 43$100 to $199
- 54$300 to $399
- 21$600 to $699
- 47$700 to $799
- 55$800 to $899
- 111$900 to $999
- 121$1,000 to $1,249
- 108$1,250 to $1,499
- 398$1,500 to $1,999
- 181$2,000 or more

Median rent in 2022:
| Longfellow: | $1,019 |
| Kansas City: | $959 |
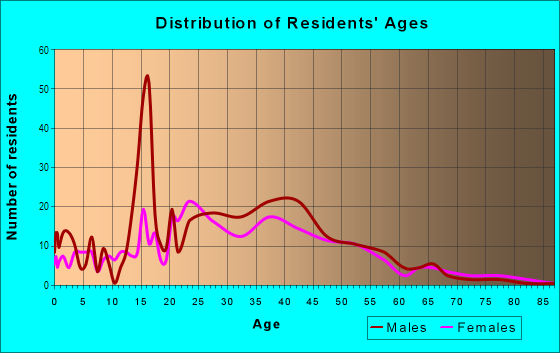
| Males: | 1,032 |
| Females: | 1,082 |
Males:
| This neighborhood: | 36.0 years |
| Whole city: | 35.3 years |
| This neighborhood: | 32.2 years |
| Whole city: | 36.6 years |
Average household size:
| Longfellow: | 2.0 people |
| Kansas City: | 2.2 people |
Percentage of family households:
| Longfellow: | 28.9% |
| Kansas City: | 37.9% |
| Here: | 22.3% |
| Kansas City: | 35.0% |
Percentage of married-couple families with children (among all households):
| Longfellow: | 27.5% |
| Kansas City: | 26.7% |
Percentage of single-mother households (among all households):
| Longfellow: | 24.4% |
| Kansas City: | 14.3% |
Percentage of never married males 15 years old and over:
Percentage of never married females 15 years old and over:
| Longfellow: | 27.4% |
| Kansas City: | 20.0% |
Percentage of never married females 15 years old and over:
| Longfellow: | 29.0% |
| city: | 20.0% |
Percentage of people that speak English not well or not at all:
| Longfellow: | 0.2% |
| Kansas City: | 2.5% |
Percentage of people born in this state:
Percentage of people born in another U.S. state:
Percentage of native residents but born outside the U.S.:
Percentage of foreign born residents:
| Here: | 50.2% |
| Kansas City: | 53.2% |
Percentage of people born in another U.S. state:
| Longfellow: | 45.2% |
| Kansas City: | 38.2% |
Percentage of native residents but born outside the U.S.:
| Here: | 0.7% |
| city: | 1.0% |
Percentage of foreign born residents:
| Here: | 3.9% |
| Kansas City: | 7.6% |
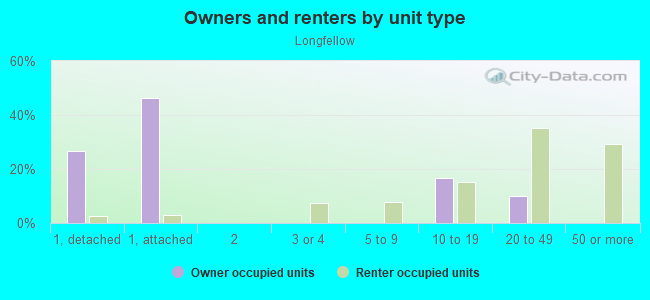
Owner-occupied
Renter-occupied

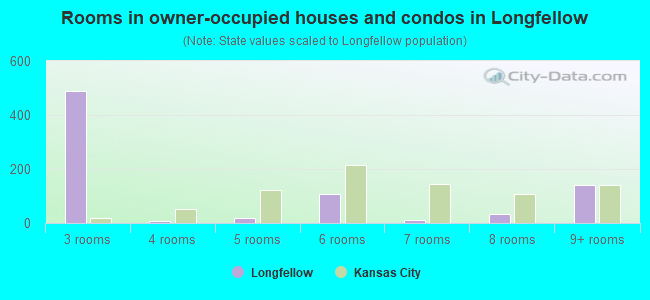
- Rooms in owner-occupied houses and condos in Longfellow
- 01 room
- 02 rooms
- 4903 rooms
- 64 rooms
- 195 rooms
- 1066 rooms
- 117 rooms
- 328 rooms
- 1399+ rooms
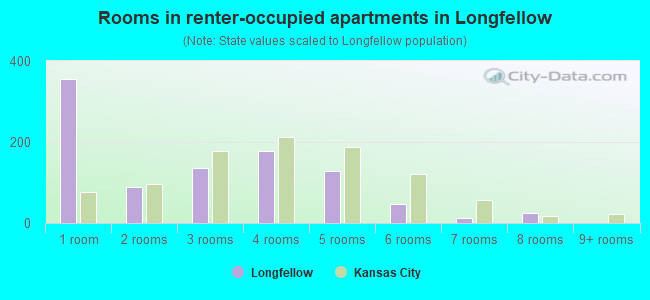
- Rooms in renter-occupied apartments in Longfellow
- 3561 room
- 902 rooms
- 1373 rooms
- 1774 rooms
- 1295 rooms
- 486 rooms
- 137 rooms
- 248 rooms
- 09+ rooms
Owner-occupied
Renter-occupied
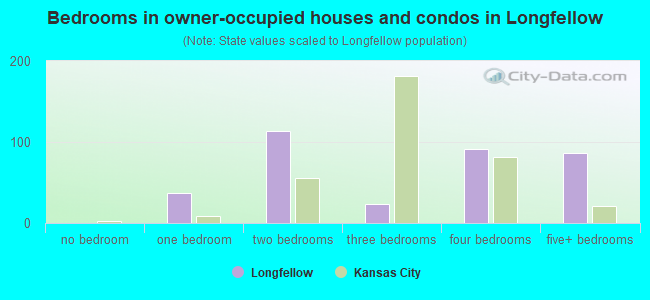
- Bedrooms in owner-occupied houses and condos in Longfellow
- 0no bedroom
- 371 bedroom
- 1132 bedrooms
- 233 bedrooms
- 914 bedrooms
- 875+ bedrooms
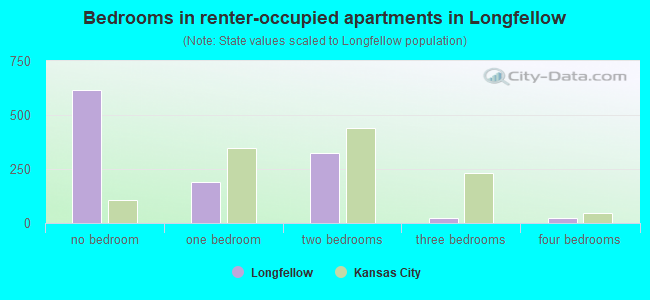
- Bedrooms in renter-occupied apartments in Longfellow
- 615no bedroom
- 1921 bedroom
- 3242 bedrooms
- 243 bedrooms
- 214 bedrooms
- 05+ bedrooms
Average number of cars or other vehicles available in houses/condos:
Average number of cars or other vehicles available in apartments:
| This neighborhood: | 1.9 |
| Kansas City: | 1.9 |
Average number of cars or other vehicles available in apartments:
| Here: | 1.2 |
| city: | 1.2 |
Percentage of units with a mortgage:
| Longfellow: | 90.1% |
| Kansas City: | 62.2% |
Average estimated value of detached houses in 2022 (23.8% of all units):
| Longfellow: | $381,742 |
| Kansas City: | $271,492 |
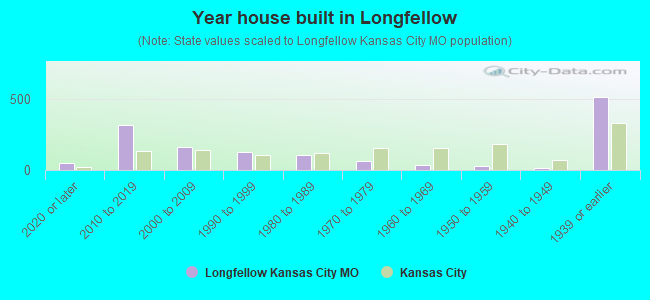
- Year house built in Longfellow
- 502020 or later
- 3132010 to 2019
- 1602000 to 2009
- 1291990 to 1999
- 1021980 to 1989
- 641970 to 1979
- 341960 to 1969
- 271950 to 1959
- 131940 to 1949
- 5111939 or earlier
City-data.com crime index for city in 2020 (higher means more crime):
| City: | 671.9 |
| U.S. average: | 219.5 |
Travel time to work (commute)
![Travel time to work (commute)]()
- 32Less than 5 minutes
- 1145 to 9 minutes
- 26010 to 14 minutes
- 11815 to 19 minutes
- 19320 to 24 minutes
- 4825 to 29 minutes
- 13130 to 34 minutes
- 535 to 39 minutes
- 9745 to 59 minutes
- 1060 to 89 minutes

Means of transportation to work
![Means of transportation to work]()
- 67.1%807Drove a car alone
- 7.2%86Carpooled
- 5.1%61Bus
- 1.7%21Bicycle
- 5.9%71Walked
- 6.2%74Other means
- 11.6%139Worked at home

Time leaving home to go to work
![Time leaving home to go to work]()
- 3712:00 a.m. to 4:59 a.m.
- 75:00 a.m. to 5:29 a.m.
- 465:30 a.m. to 5:59 a.m.
- 566:00 a.m. to 6:29 a.m.
- 836:30 a.m. to 6:59 a.m.
- 1657:00 a.m. to 7:29 a.m.
- 1597:30 a.m. to 7:59 a.m.
- 1238:00 a.m. to 8:29 a.m.
- 838:30 a.m. to 8:59 a.m.
- 409:00 a.m. to 9:59 a.m.
- 810:00 a.m. to 10:59 a.m.
- 1011:00 a.m. to 11:59 a.m.
- 5712:00 p.m. to 3:59 p.m.
- 514:00 p.m. to 11:59 p.m.

Occupations of males:
- Percentage of males in management occupations (except farmers):
Here: 12.6% city: 11.5%
- Percentage of males in business and financial operations occupations:
Here: 14.9% city: 5.6%
- Percentage of males in computer and mathematical occupations:
Here: 7.1% city: 6.1%
- Percentage of males in architecture and engineering occupations:
Here: 4.4% city: 3.4%
- Percentage of males in life, physical, and social science occupations:
Here: 2.3% city: 1.3%
- Percentage of males in community and social services occupations:
Here: 3.2% city: 1.1%
- Percentage of males in legal occupations:
Here: 3.6% city: 1.3%
- Percentage of males in education, training, and library occupations:
Here: 10.0% city: 2.6%
- Percentage of males in arts, design, entertainment, sports, and media occupations:
Here: 3.8% city: 2.4%
- Percentage of males in healthcare practitioners and technical occupations:
Here: 3.6% city: 3.4%
- Percentage of males in service occupations:
Here: 14.0% city: 13.8%
- Percentage of males in sales and office occupations:
Here: 9.5% city: 16.1%
- Percentage of males in construction, extraction, and maintenance occupations:
Here: 1.8% city: 7.3%
- Percentage of males in material moving occupations:
Here: 8.3% city: 6.3%
Occupations of females:
- Percentage of females in management occupations (except farmers):
Here: 9.4% city: 9.9%
- Percentage of females in business and financial operations occupations:
Here: 4.6% city: 7.2%
- Percentage of females in computer and mathematical occupations:
Here: 4.3% city: 2.4%
- Percentage of females in architecture and engineering occupations:
Here: 1.6% city: 0.7%
- Percentage of females in life, physical, and social science occupations:
Here: 3.0% city: 1.1%
- Percentage of females in community and social services occupations:
Here: 4.1% city: 2.9%
- Percentage of females in legal occupations:
Here: 1.6% city: 1.6%
- Percentage of females in education, training, and library occupations:
Here: 5.4% city: 8.0%
- Percentage of females in arts, design, entertainment, sports, and media occupations:
Here: 7.9% city: 2.7%
- Percentage of females in healthcare practitioners and technical occupations:
Here: 18.9% city: 10.3%
- Percentage of females in service occupations:
Here: 3.7% city: 18.7%
- Percentage of females in sales and office occupations:
Here: 23.2% city: 26.2%
- Percentage of females in production occupations:
Here: 11.2% city: 3.3%
- Percentage of females in material moving occupations:
Here: 1.1% city: 3.0%
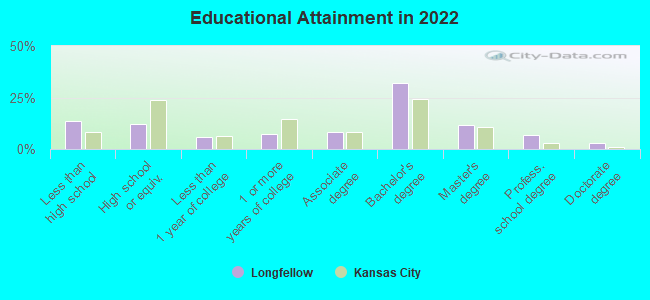
Education in this neighborhood (subdivision or community):
- Percentage of people 3 years and older in K-12 schools:
Longfellow: 21.2% Kansas City: 15.8%
- Percentage of people 3 years and older in undergraduate colleges:
Longfellow: 14.8% Kansas City: 5.0%
- Percentage of people 3 years and older in grad. or professional schools:
Longfellow: 7.9% Kansas City: 1.7%
- Percentage of students K-12 enrolled in private schools:
Longfellow: 8.9% Kansas City: 14.7%
Percentage of population below poverty level:
| Longfellow: | 31.5% |
| Kansas City: | 14.6% |
Median year owner moved in (as recorded in 2022):
Median year renter moved in (as recorded in 2022):
| Longfellow: | 2012 |
| Kansas City: | 2012 |
Median year renter moved in (as recorded in 2022):
| Longfellow: | 2017 |
| Kansas City: | 2020 |
Percentage of married-couple families with both working:
| Longfellow: | 145.0% |
| Kansas City: | 76.6% |
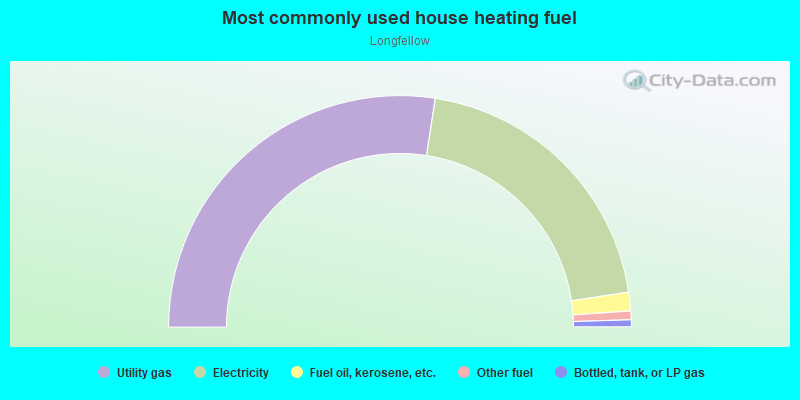
- 54.9%Utility gas
- 40.3%Electricity
- 2.6%Fuel oil, kerosene, etc.
- 1.2%Other fuel
- 1.0%Bottled, tank, or LP gas
Roads and streets:
Campbell St
Length: 0.80 miles
Directions: E-W, N-S, SE-NW, SW-NE
Address range: 2500 to 3099
Directions: E-W, N-S, SE-NW, SW-NE
Address range: 2500 to 3099
Charlotte St
Length: 0.75 miles
Directions: N-S, SW-NE
Address range: 2500 to 3099
Directions: N-S, SW-NE
Address range: 2500 to 3099
Cherry St
Length: 0.75 miles
Direction: N-S
Address range: 2500 to 3099
Direction: N-S
Address range: 2500 to 3099
Holmes St
Length: 0.75 miles
Direction: N-S
Address range: 2500 to 3099
Direction: N-S
Address range: 2500 to 3099
Harrison St
Length: 0.75 miles
Direction: N-S
Address range: 2500 to 3099
Direction: N-S
Address range: 2500 to 3099
E 26 St (E 26th St)
Length: 0.43 miles
Direction: E-W
Address range: 500 to 999
Direction: E-W
Address range: 500 to 999
E 25 St (E 25th St)
Length: 0.43 miles
Direction: E-W
Address range: 550 to 999
Direction: E-W
Address range: 550 to 999
E 30th St (E 30 St)
Length: 0.35 miles
Direction: E-W
Address range: 600 to 999
Direction: E-W
Address range: 600 to 999
E 29 St (E 29th St)
Length: 0.35 miles
Direction: E-W
Address range: 600 to 999
Direction: E-W
Address range: 600 to 999
E 31 St (E 31st St S)
Length: 0.35 miles
Direction: E-W
Address range: 600 to 999
Direction: E-W
Address range: 600 to 999
E 27 St (E 27th St)
Length: 0.35 miles
Direction: E-W
Address range: 600 to 999
Direction: E-W
Address range: 600 to 999
E 28th St (E 28 St, E 28th St S)
Length: 0.32 miles
Directions: E-W, SW-NE
Address range: 600 to 999
Directions: E-W, SW-NE
Address range: 600 to 999
E 27 Ter (Campbell St)
Length: 0.20 miles
Directions: E-W, SE-NW
Address range: 600 to 799
Directions: E-W, SE-NW
Address range: 600 to 799
Gillham Rd
Length: 0.12 miles
Direction: N-S
Address range: 2548 to 2599
Direction: N-S
Address range: 2548 to 2599
E Gillham Rd
Length: 0.04 miles
Direction: N-S
Address range: 2500 to 2531
Direction: N-S
Address range: 2500 to 2531
Mc Gee Trfy (E 30th St)
Length: 0.02 miles
Direction: SE-NW
Address range: 550 to 2998
Direction: SE-NW
Address range: 550 to 2998