Laurel neighborhood in Oakland, California (CA), 94602, 94619 detailed profile
Settings
X


Business Search - 14 Million verified businesses
Area: 0.120 square miles
Population: 1,610
Population density:
| Laurel: | 13,397 people per square mile |
| Oakland: | 7,680 people per square mile |

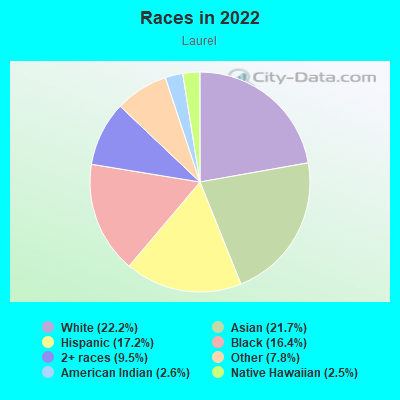
- 40422.2%White
- 39621.7%Asian
- 31417.2%Hispanic or Latino
- 29916.4%Black
- 1749.5%Two or more races
- 1427.8%Some other race
- 482.6%American Indian
- 462.5%Native Hawaiian and Other
Pacific Islander
Median household income in 2022:
| Laurel: | $120,970 |
| Oakland: | $93,146 |
Distribution of median household income
![Distribution of median household income]()
- 28Less than $10,000
- 42$10,000 to $19,999
- 101$20,000 to $29,999
- 91$30,000 to $39,999
- 101$40,000 to $49,999
- 121$50,000 to $59,999
- 31$60,000 to $74,999
- 43$75,000 to $99,999
- 58$100,000 to $124,999
- 112$125,000 to $149,999
- 127$150,000 to $199,999
- 53$200,000 or more

Distribution of owner-occupied house/condo value
![Distribution of owner-occupied house/condo value]()
- 15Less than $50,000
- 49$50,000 to $99,999
- 5$150,000 to $199,999
- 40$200,000 to $249,999
- 36$250,000 to $299,999
- 23$300,000 to $399,999
- 13$400,000 to $499,999
- 120$500,000 to $749,999
- 123$750,000 to $999,999
- 61$1,000,000 or more

Distribution of rent paid by renters
![Distribution of rent paid by renters]()
- 5Less than $100
- 35$200 to $299
- 12$400 to $499
- 122$700 to $799
- 2$800 to $899
- 12$900 to $999
- 29$1,000 to $1,249
- 58$1,250 to $1,499
- 194$1,500 to $1,999
- 104$2,000 or more

Median rent in 2022:
| Laurel: | $1,640 |
| Oakland: | $1,741 |
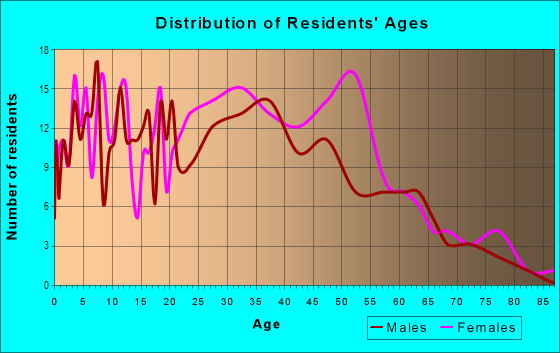
| Males: | 781 |
| Females: | 829 |
Males:
| This neighborhood: | 42.1 years |
| Whole city: | 38.3 years |
| This neighborhood: | 34.6 years |
| Whole city: | 39.1 years |
Average household size:
| Laurel: | 2.5 people |
| Oakland: | 2.4 people |
Percentage of family households:
| Laurel: | 36.0% |
| Oakland: | 37.1% |
| Here: | 49.1% |
| Oakland: | 34.9% |
Percentage of married-couple families with children (among all households):
| Laurel: | 26.4% |
| Oakland: | 28.3% |
Percentage of single-mother households (among all households):
| Laurel: | 11.6% |
| Oakland: | 9.9% |
Percentage of never married males 15 years old and over:
Percentage of never married females 15 years old and over:
| Laurel: | 19.4% |
| Oakland: | 24.6% |
Percentage of never married females 15 years old and over:
| Laurel: | 21.2% |
| city: | 21.9% |
Percentage of people that speak English not well or not at all:
| Laurel: | 20.4% |
| Oakland: | 10.6% |
Percentage of people born in this state:
Percentage of people born in another U.S. state:
Percentage of native residents but born outside the U.S.:
Percentage of foreign born residents:
| Here: | 50.6% |
| Oakland: | 49.9% |
Percentage of people born in another U.S. state:
| Laurel: | 17.0% |
| Oakland: | 22.3% |
Percentage of native residents but born outside the U.S.:
| Here: | 1.1% |
| city: | 1.6% |
Percentage of foreign born residents:
| Here: | 31.4% |
| Oakland: | 26.2% |
Owner-occupied
Renter-occupied

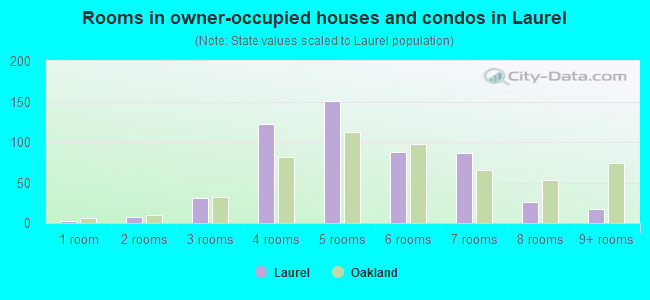
- Rooms in owner-occupied houses and condos in Laurel
- 21 room
- 82 rooms
- 313 rooms
- 1224 rooms
- 1505 rooms
- 886 rooms
- 877 rooms
- 268 rooms
- 179+ rooms
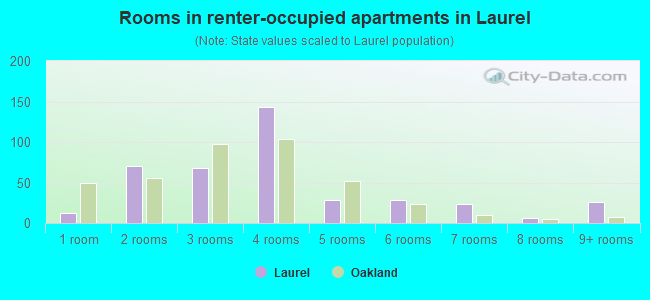
- Rooms in renter-occupied apartments in Laurel
- 121 room
- 702 rooms
- 683 rooms
- 1434 rooms
- 295 rooms
- 286 rooms
- 237 rooms
- 68 rooms
- 269+ rooms
Owner-occupied
Renter-occupied
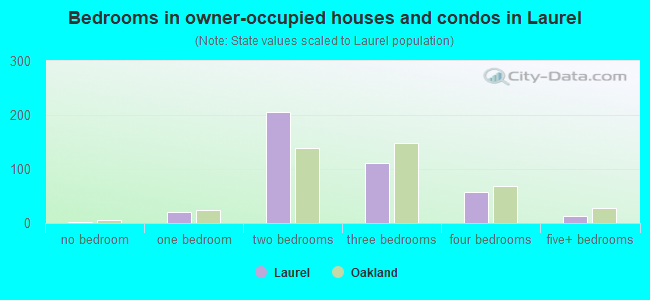
- Bedrooms in owner-occupied houses and condos in Laurel
- 2no bedroom
- 211 bedroom
- 2052 bedrooms
- 1123 bedrooms
- 584 bedrooms
- 135+ bedrooms
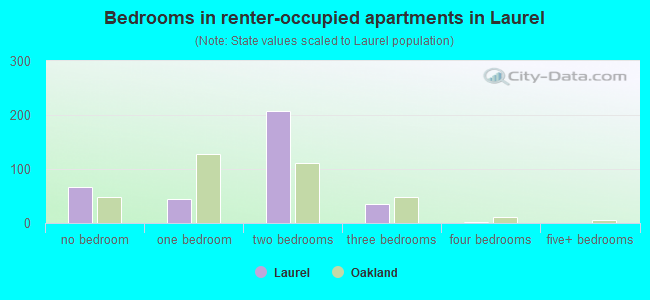
- Bedrooms in renter-occupied apartments in Laurel
- 66no bedroom
- 441 bedroom
- 2072 bedrooms
- 353 bedrooms
- 14 bedrooms
- 05+ bedrooms
Average number of cars or other vehicles available in houses/condos:
Average number of cars or other vehicles available in apartments:
| This neighborhood: | 1.7 |
| Oakland: | 1.8 |
Average number of cars or other vehicles available in apartments:
| Here: | 0.9 |
| city: | 1.1 |
Percentage of units with a mortgage:
| Laurel: | 70.6% |
| Oakland: | 71.2% |
Average estimated value of detached houses in 2022 (66.6% of all units):
| Laurel: | $580,021 |
| Oakland: | $1,000,874 |
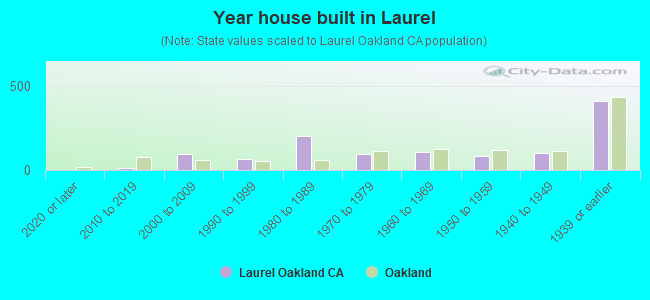
- Year house built in Laurel
- 22020 or later
- 102010 to 2019
- 962000 to 2009
- 671990 to 1999
- 2011980 to 1989
- 981970 to 1979
- 1071960 to 1969
- 811950 to 1959
- 1031940 to 1949
- 4141939 or earlier
City-data.com crime index for city in 2020 (higher means more crime):
| City: | 691.6 |
| U.S. average: | 219.5 |
Travel time to work (commute)
![Travel time to work (commute)]()
- 2Less than 5 minutes
- 255 to 9 minutes
- 12010 to 14 minutes
- 9715 to 19 minutes
- 12720 to 24 minutes
- 2325 to 29 minutes
- 13630 to 34 minutes
- 735 to 39 minutes
- 4740 to 44 minutes
- 12345 to 59 minutes
- 2860 to 89 minutes
- 1890 or more minutes

Means of transportation to work
![Means of transportation to work]()
- 41.9%408Drove a car alone
- 8.8%86Carpooled
- 10.4%101Bus
- 3.1%30Subway or elevated rail
- 0.4%4Long-distance train or commuter rail
- 1.6%16Ferryboat
- 0.7%7Motorcycle
- 0.7%7Bicycle
- 3.3%32Walked
- 4.7%46Other means
- 28.5%278Worked at home

Time leaving home to go to work
![Time leaving home to go to work]()
- 1412:00 a.m. to 4:59 a.m.
- 315:00 a.m. to 5:29 a.m.
- 365:30 a.m. to 5:59 a.m.
- 116:00 a.m. to 6:29 a.m.
- 476:30 a.m. to 6:59 a.m.
- 1437:00 a.m. to 7:29 a.m.
- 457:30 a.m. to 7:59 a.m.
- 748:00 a.m. to 8:29 a.m.
- 638:30 a.m. to 8:59 a.m.
- 629:00 a.m. to 9:59 a.m.
- 6210:00 a.m. to 10:59 a.m.
- 2711:00 a.m. to 11:59 a.m.
- 5012:00 p.m. to 3:59 p.m.
- 554:00 p.m. to 11:59 p.m.

Occupations of males:
- Percentage of males in management occupations (except farmers):
Here: 11.0% city: 13.5%
- Percentage of males in business and financial operations occupations:
Here: 21.4% city: 6.0%
- Percentage of males in architecture and engineering occupations:
Here: 17.9% city: 3.8%
- Percentage of males in education, training, and library occupations:
Here: 13.3% city: 4.6%
- Percentage of males in healthcare practitioners and technical occupations:
Here: 7.8% city: 2.8%
- Percentage of males in service occupations:
Here: 4.2% city: 12.9%
- Percentage of males in sales and office occupations:
Here: 18.0% city: 13.4%
- Percentage of males in construction, extraction, and maintenance occupations:
Here: 3.0% city: 8.3%
- Percentage of males in transportation occupations:
Here: 2.2% city: 5.6%
Occupations of females:
- Percentage of females in management occupations (except farmers):
Here: 9.5% city: 15.1%
- Percentage of females in business and financial operations occupations:
Here: 8.6% city: 8.2%
- Percentage of females in life, physical, and social science occupations:
Here: 2.4% city: 2.3%
- Percentage of females in community and social services occupations:
Here: 1.1% city: 3.7%
- Percentage of females in education, training, and library occupations:
Here: 14.3% city: 8.4%
- Percentage of females in healthcare practitioners and technical occupations:
Here: 2.1% city: 6.7%
- Percentage of females in service occupations:
Here: 23.9% city: 17.8%
- Percentage of females in sales and office occupations:
Here: 25.5% city: 20.0%
- Percentage of females in production occupations:
Here: 4.8% city: 2.4%
- Percentage of females in material moving occupations:
Here: 6.1% city: 1.7%
Education in this neighborhood (subdivision or community):
- Percentage of people 3 years and older in K-12 schools:
Laurel: 16.7% Oakland: 13.0%
- Percentage of people 3 years and older in undergraduate colleges:
Laurel: 6.2% Oakland: 4.3%
- Percentage of people 3 years and older in grad. or professional schools:
Laurel: 5.2% Oakland: 1.8%
- Percentage of students K-12 enrolled in private schools:
Laurel: 55.5% Oakland: 15.8%
Percentage of population below poverty level:
| Laurel: | 7.5% |
| Oakland: | 13.9% |
Median year owner moved in (as recorded in 2022):
Median year renter moved in (as recorded in 2022):
| Laurel: | 2009 |
| Oakland: | 2010 |
Median year renter moved in (as recorded in 2022):
| Laurel: | 2013 |
| Oakland: | 2018 |
Percentage of married-couple families with both working:
| Laurel: | 87.8% |
| Oakland: | 73.2% |

- 56.5%Utility gas
- 24.2%Electricity
- 9.2%No fuel used
- 4.5%Bottled, tank, or LP gas
- 4.4%Wood
- 1.2%Solar energy
Limited-access highways (interstate or state) in this neighborhood:
I- 580
Length: 0.84 miles
Direction: SE-NW
Direction: SE-NW
Roads and streets:
Redding St
Length: 0.55 miles
Directions: E-W, SE-NW
Address range: 3500 to 4299
Directions: E-W, SE-NW
Address range: 3500 to 4299
Macarthur Blvd
Length: 0.46 miles
Direction: SE-NW
Address range: 3701 to 4299
Direction: SE-NW
Address range: 3701 to 4299
Quigley St
Length: 0.44 miles
Directions: E-W, SE-NW
Address range: 3500 to 4099
Directions: E-W, SE-NW
Address range: 3500 to 4099
38th Ave
Length: 0.31 miles
Direction: SW-NE
Address range: 3400 to 3599
Direction: SW-NE
Address range: 3400 to 3599
35th Ave
Length: 0.26 miles
Directions: SE-NW, SW-NE
Address range: 3350 to 3531
Directions: SE-NW, SW-NE
Address range: 3350 to 3531
Loma Vista Ave
Length: 0.17 miles
Direction: SW-NE
Address range: 3400 to 3599
Direction: SW-NE
Address range: 3400 to 3599
High St
Length: 0.16 miles
Directions: E-W, SW-NE
Address range: 3500 to 3603
Directions: E-W, SW-NE
Address range: 3500 to 3603
Delaware St
Length: 0.14 miles
Directions: E-W, SE-NW, SW-NE
Address range: 3300 to 3499
Directions: E-W, SE-NW, SW-NE
Address range: 3300 to 3499
Interstate 580 E
Length: 0.12 miles
Direction: SE-NW
Direction: SE-NW
Maybelle Ave
Length: 0.11 miles
Direction: SW-NE
Address range: 3450 to 3599
Direction: SW-NE
Address range: 3450 to 3599
39th Ave
Length: 0.10 miles
Directions: N-S, SE-NW, SW-NE
Address range: 3400 to 3499
Directions: N-S, SE-NW, SW-NE
Address range: 3400 to 3499
Georgia St
Length: 0.09 miles
Direction: SE-NW
Address range: 3300 to 3399
Direction: SE-NW
Address range: 3300 to 3399
Dakota St
Length: 0.07 miles
Direction: SE-NW
Address range: 3265 to 3499
Direction: SE-NW
Address range: 3265 to 3499
Midvale Ave
Length: 0.06 miles
Direction: SW-NE
Address range: 3400 to 3499
Direction: SW-NE
Address range: 3400 to 3499
Quigley Ln (Quigley St)
Length: 0.06 miles
Directions: E-W, SE-NW
Address range: 3400 to 3499
Directions: E-W, SE-NW
Address range: 3400 to 3499
Other features:
Perlata Crk
Length: 0.14 miles
Direction: SW-NE
Direction: SW-NE