Kings Grant neighborhood in Fredericksburg, Virginia (VA), 22406 detailed profile
Settings
X


Business Search - 14 Million verified businesses
Area: 1.676 square miles
Population: 397
Population density:
| Kings Grant: | 237 people per square mile |
| Fredericksburg: | 2,687 people per square mile |

- 32381.8%White
- 287.1%Two or more races
- 235.8%Black
- 194.8%Hispanic or Latino
- 20.5%Asian

Median household income in 2022:
| Kings Grant: | $154,641 |
| Fredericksburg: | $83,445 |
Distribution of median household income
![Distribution of median household income]()
- 1Less than $10,000
- 3$10,000 to $19,999
- 3$20,000 to $29,999
- 5$30,000 to $39,999
- 2$40,000 to $49,999
- 2$50,000 to $59,999
- 2$60,000 to $74,999
- 18$75,000 to $99,999
- 16$100,000 to $124,999
- 23$125,000 to $149,999
- 14$150,000 to $199,999
- 44$200,000 or more

Distribution of owner-occupied house/condo value
![Distribution of owner-occupied house/condo value]()
- 4Less than $50,000
- 2$150,000 to $199,999
- 2$200,000 to $249,999
- 4$250,000 to $299,999
- 20$300,000 to $399,999
- 40$400,000 to $499,999
- 40$500,000 to $749,999
- 3$750,000 to $999,999
- 2$1,000,000 or more

Distribution of rent paid by renters
![Distribution of rent paid by renters]()
- 1$600 to $699
- 2$1,000 to $1,249
- 2$1,500 to $1,999
- 8$2,000 or more

Median rent in 2022:
| Kings Grant: | $2,732 |
| Fredericksburg: | $1,317 |
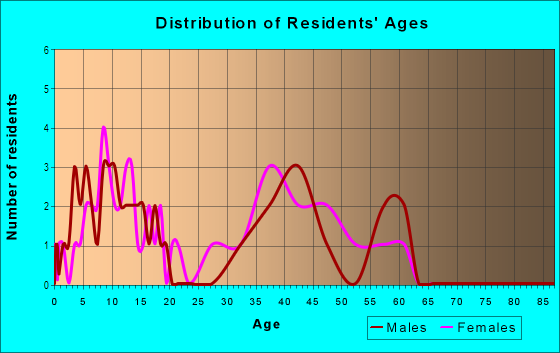
| Males: | 215 |
| Females: | 181 |
Males:
| This neighborhood: | 38.8 years |
| Whole city: | 30.9 years |
| This neighborhood: | 41.4 years |
| Whole city: | 31.0 years |
Average household size:
| Kings Grant: | 3.5 people |
| Fredericksburg: | 2.3 people |
Percentage of family households:
| Kings Grant: | 66.0% |
| Fredericksburg: | 41.8% |
| Here: | 83.2% |
| Fredericksburg: | 35.4% |
Percentage of married-couple families with children (among all households):
| Kings Grant: | 28.7% |
| Fredericksburg: | 21.2% |
Percentage of single-mother households (among all households):
| Kings Grant: | 0.9% |
| Fredericksburg: | 15.3% |
Percentage of never married males 15 years old and over:
Percentage of never married females 15 years old and over:
| Kings Grant: | 15.6% |
| Fredericksburg: | 21.8% |
Percentage of never married females 15 years old and over:
| Kings Grant: | 13.1% |
| city: | 24.0% |
Percentage of people that speak English not well or not at all:
| Kings Grant: | 0.3% |
| Fredericksburg: | 3.5% |
Percentage of people born in this state:
Percentage of people born in another U.S. state:
Percentage of native residents but born outside the U.S.:
Percentage of foreign born residents:
| Here: | 51.6% |
| Fredericksburg: | 50.3% |
Percentage of people born in another U.S. state:
| Kings Grant: | 44.0% |
| Fredericksburg: | 36.1% |
Percentage of native residents but born outside the U.S.:
| Here: | 2.4% |
| city: | 2.3% |
Percentage of foreign born residents:
| Here: | 2.0% |
| Fredericksburg: | 11.3% |

Owner-occupied
Renter-occupied


- Rooms in owner-occupied houses and condos in Kings Grant
- 01 room
- 02 rooms
- 03 rooms
- 04 rooms
- 45 rooms
- 176 rooms
- 77 rooms
- 308 rooms
- 459+ rooms

- Rooms in renter-occupied apartments in Kings Grant
- 01 room
- 02 rooms
- 03 rooms
- 04 rooms
- 35 rooms
- 16 rooms
- 07 rooms
- 08 rooms
- 69+ rooms
Owner-occupied
Renter-occupied

- Bedrooms in owner-occupied houses and condos in Kings Grant
- 0no bedroom
- 01 bedroom
- 22 bedrooms
- 423 bedrooms
- 494 bedrooms
- 125+ bedrooms

- Bedrooms in renter-occupied apartments in Kings Grant
- 0no bedroom
- 01 bedroom
- 12 bedrooms
- 23 bedrooms
- 64 bedrooms
- 05+ bedrooms
Average number of cars or other vehicles available in houses/condos:
Average number of cars or other vehicles available in apartments:
| This neighborhood: | 2.8 |
| Fredericksburg: | 2.1 |
Average number of cars or other vehicles available in apartments:
| Here: | 2.8 |
| city: | 1.3 |
Percentage of units with a mortgage:
| Kings Grant: | 74.5% |
| Fredericksburg: | 71.9% |

- Year house built in Kings Grant
- 02020 or later
- 82010 to 2019
- 302000 to 2009
- 171990 to 1999
- 341980 to 1989
- 191970 to 1979
- 41960 to 1969
- 41950 to 1959
- 01940 to 1949
- 21939 or earlier

City-data.com crime index for city in 2020 (higher means more crime):
| City: | 256.5 |
| U.S. average: | 219.5 |
Travel time to work (commute)
![Travel time to work (commute)]()
- 410 to 14 minutes
- 1715 to 19 minutes
- 1720 to 24 minutes
- 1425 to 29 minutes
- 2930 to 34 minutes
- 1035 to 39 minutes
- 1240 to 44 minutes
- 2545 to 59 minutes
- 5060 to 89 minutes
- 2890 or more minutes

Means of transportation to work
![Means of transportation to work]()
- 77.1%151Drove a car alone
- 9.7%19Carpooled
- 0.5%1Bus
- 0.5%1Bicycle
- 12.2%24Worked at home

Time leaving home to go to work
![Time leaving home to go to work]()
- 1212:00 a.m. to 4:59 a.m.
- 305:00 a.m. to 5:29 a.m.
- 115:30 a.m. to 5:59 a.m.
- 136:00 a.m. to 6:29 a.m.
- 136:30 a.m. to 6:59 a.m.
- 327:00 a.m. to 7:29 a.m.
- 117:30 a.m. to 7:59 a.m.
- 368:00 a.m. to 8:29 a.m.
- 48:30 a.m. to 8:59 a.m.
- 169:00 a.m. to 9:59 a.m.
- 310:00 a.m. to 10:59 a.m.
- 411:00 a.m. to 11:59 a.m.
- 712:00 p.m. to 3:59 p.m.
- 104:00 p.m. to 11:59 p.m.

Occupations of males:
- Percentage of males in management occupations (except farmers):
Here: 37.5% city: 11.5%
- Percentage of males in business and financial operations occupations:
Here: 1.4% city: 8.2%
- Percentage of males in computer and mathematical occupations:
Here: 9.0% city: 10.4%
- Percentage of males in architecture and engineering occupations:
Here: 11.6% city: 2.4%
- Percentage of males in community and social services occupations:
Here: 1.0% city: 0.4%
- Percentage of males in education, training, and library occupations:
Here: 1.5% city: 5.0%
- Percentage of males in arts, design, entertainment, sports, and media occupations:
Here: 6.3% city: 1.9%
- Percentage of males in healthcare practitioners and technical occupations:
Here: 1.6% city: 2.9%
- Percentage of males in service occupations:
Here: 15.0% city: 13.8%
- Percentage of males in sales and office occupations:
Here: 2.6% city: 13.6%
- Percentage of males in construction, extraction, and maintenance occupations:
Here: 6.5% city: 8.4%
- Percentage of males in production occupations:
Here: 2.8% city: 2.9%
- Percentage of males in transportation occupations:
Here: 1.6% city: 7.2%
- Percentage of males in material moving occupations:
Here: 1.5% city: 3.8%
Occupations of females:
- Percentage of females in management occupations (except farmers):
Here: 11.4% city: 13.1%
- Percentage of females in business and financial operations occupations:
Here: 4.4% city: 12.3%
- Percentage of females in computer and mathematical occupations:
Here: 2.0% city: 2.0%
- Percentage of females in architecture and engineering occupations:
Here: 1.2% city: 0.5%
- Percentage of females in community and social services occupations:
Here: 5.6% city: 3.3%
- Percentage of females in education, training, and library occupations:
Here: 16.6% city: 11.3%
- Percentage of females in arts, design, entertainment, sports, and media occupations:
Here: 3.6% city: 2.3%
- Percentage of females in healthcare practitioners and technical occupations:
Here: 6.1% city: 6.4%
- Percentage of females in service occupations:
Here: 13.3% city: 17.6%
- Percentage of females in sales and office occupations:
Here: 46.3% city: 23.2%
- Percentage of females in material moving occupations:
Here: 1.6% city: 0.0%
Education in this neighborhood (subdivision or community):
- Percentage of people 3 years and older in K-12 schools:
Kings Grant: 20.3% Fredericksburg: 14.8%
- Percentage of people 3 years and older in undergraduate colleges:
Kings Grant: 4.4% Fredericksburg: 14.6%
- Percentage of people 3 years and older in grad. or professional schools:
Kings Grant: 0.5% Fredericksburg: 1.6%
- Percentage of students K-12 enrolled in private schools:
Kings Grant: 30.4% Fredericksburg: 12.4%
Percentage of population below poverty level:
| Kings Grant: | 5.0% |
| Fredericksburg: | 18.0% |
Median year owner moved in (as recorded in 2022):
Median year renter moved in (as recorded in 2022):
| Kings Grant: | 2082 |
| Fredericksburg: | 2012 |
Median year renter moved in (as recorded in 2022):
| Kings Grant: | 2094 |
| Fredericksburg: | 2019 |
Percentage of married-couple families with both working:
| Kings Grant: | 63.4% |
| Fredericksburg: | 58.8% |

- 60.5%Electricity
- 18.2%Bottled, tank, or LP gas
- 10.7%Fuel oil, kerosene, etc.
- 9.5%Wood
- 1.1%Utility gas
Roads and streets:
Queen Anne Dr
Length: 1.74 miles
Directions: E-W, N-S, SE-NW, SW-NE
Address range: 150 to 1299
Directions: E-W, N-S, SE-NW, SW-NE
Address range: 150 to 1299
Old Cropp Mill Rd
Length: 1.32 miles
Directions: E-W, N-S, SE-NW, SW-NE
Address range: 1 to 372
Directions: E-W, N-S, SE-NW, SW-NE
Address range: 1 to 372
King Alfred Way
Length: 0.67 miles
Directions: E-W, N-S, SE-NW, SW-NE
Address range: 122 to 225
Directions: E-W, N-S, SE-NW, SW-NE
Address range: 122 to 225
Lady Jane Ln
Length: 0.59 miles
Directions: E-W, N-S, SE-NW
Address range: 1 to 199
Directions: E-W, N-S, SE-NW
Address range: 1 to 199
Hazel Ln
Length: 0.55 miles
Directions: E-W, N-S, SE-NW
Address range: 1 to 199
Directions: E-W, N-S, SE-NW
Address range: 1 to 199
Lady Meaghan Way
Length: 0.48 miles
Directions: E-W, N-S, SE-NW, SW-NE
Address range: 1 to 99
Directions: E-W, N-S, SE-NW, SW-NE
Address range: 1 to 99
Queen Marys Ln
Length: 0.32 miles
Directions: E-W, N-S, SE-NW
Address range: 1 to 99
Directions: E-W, N-S, SE-NW
Address range: 1 to 99
Lady Jessica Ln
Length: 0.30 miles
Directions: E-W, N-S, SE-NW, SW-NE
Address range: 1 to 99
Directions: E-W, N-S, SE-NW, SW-NE
Address range: 1 to 99
King Daniel's Way
Length: 0.29 miles
Directions: E-W, N-S, SE-NW, SW-NE
Address range: 100 to 199
Directions: E-W, N-S, SE-NW, SW-NE
Address range: 100 to 199
Pierce Ct
Length: 0.28 miles
Directions: E-W, N-S, SE-NW, SW-NE
Address range: 37 to 99
Directions: E-W, N-S, SE-NW, SW-NE
Address range: 37 to 99
King Henry Ct
Length: 0.21 miles
Directions: E-W, N-S, SE-NW, SW-NE
Address range: 1 to 106
Directions: E-W, N-S, SE-NW, SW-NE
Address range: 1 to 106
Princess Gillian Ct
Length: 0.13 miles
Direction: E-W
Address range: 1 to 99
Direction: E-W
Address range: 1 to 99
Saint Micheal Ct
Length: 0.11 miles
Directions: E-W, N-S, SE-NW, SW-NE
Address range: 1 to 99
Directions: E-W, N-S, SE-NW, SW-NE
Address range: 1 to 99
Other features:
Alcotti Run
Length: 1.53 miles
Directions: E-W, N-S, SE-NW, SW-NE
Directions: E-W, N-S, SE-NW, SW-NE
Deep Run
Length: 0.01 miles
Direction: N-S
Direction: N-S