Kenmore neighborhood in Boston, Massachusetts (MA), 02215 detailed profile
Settings
X


Business Search - 14 Million verified businesses
Area: 0.299 square miles
Population: 6,106
Population density:
| Kenmore: | 20,448 people per square mile |
| Boston: | 13,418 people per square mile |

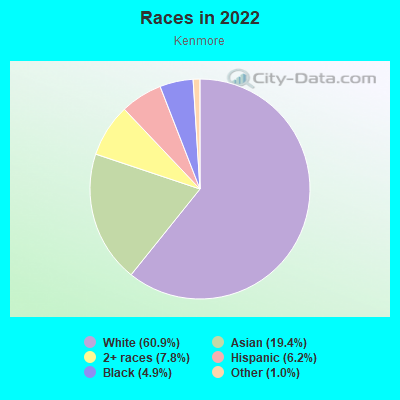
- 3,73760.9%White
- 1,18919.4%Asian
- 4777.8%Two or more races
- 3786.2%Hispanic or Latino
- 3004.9%Black
- 591.0%Some other race
Median household income in 2022:
| Kenmore: | $94,533 |
| Boston: | $86,331 |
Distribution of median household income
![Distribution of median household income]()
- 153Less than $10,000
- 203$10,000 to $19,999
- 99$20,000 to $29,999
- 134$30,000 to $39,999
- 125$40,000 to $49,999
- 107$50,000 to $59,999
- 153$60,000 to $74,999
- 193$75,000 to $99,999
- 117$100,000 to $124,999
- 66$125,000 to $149,999
- 110$150,000 to $199,999
- 430$200,000 or more

Distribution of owner-occupied house/condo value
![Distribution of owner-occupied house/condo value]()
- 17$300,000 to $399,999
- 17$400,000 to $499,999
- 18$500,000 to $749,999
- 366$750,000 to $999,999
- 660$1,000,000 or more

Distribution of rent paid by renters
![Distribution of rent paid by renters]()
- 69Less than $100
- 57$200 to $299
- 146$300 to $399
- 57$500 to $599
- 266$700 to $799
- 164$800 to $899
- 192$1,000 to $1,249
- 45$1,250 to $1,499
- 124$1,500 to $1,999
- 797$2,000 or more

Median rent in 2022:
| Kenmore: | $2,498 |
| Boston: | $1,814 |
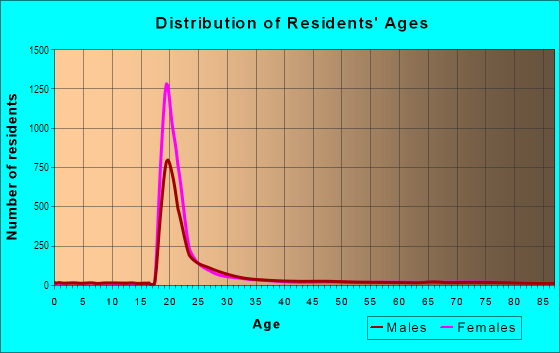
| Males: | 2,288 |
| Females: | 3,817 |
Males:
| This neighborhood: | 21.6 years |
| Whole city: | 32.7 years |
| This neighborhood: | 22.7 years |
| Whole city: | 34.1 years |
Average household size:
| Kenmore: | 1.7 people |
| Boston: | 2.1 people |
Percentage of family households:
| Kenmore: | 18.4% |
| Boston: | 34.5% |
| Here: | 26.0% |
| Boston: | 26.9% |
Percentage of married-couple families with children (among all households):
| Kenmore: | 26.7% |
| Boston: | 24.9% |
Percentage of single-mother households (among all households):
| Kenmore: | 2.4% |
| Boston: | 15.7% |
Percentage of never married males 15 years old and over:
Percentage of never married females 15 years old and over:
| Kenmore: | 31.1% |
| Boston: | 26.8% |
Percentage of never married females 15 years old and over:
| Kenmore: | 48.0% |
| city: | 28.3% |
Percentage of people that speak English not well or not at all:
| Kenmore: | 0.0% |
| Boston: | 8.0% |
Percentage of people born in this state:
Percentage of people born in another U.S. state:
Percentage of native residents but born outside the U.S.:
Percentage of foreign born residents:
| Here: | 27.9% |
| Boston: | 42.4% |
Percentage of people born in another U.S. state:
| Kenmore: | 43.2% |
| Boston: | 26.6% |
Percentage of native residents but born outside the U.S.:
| Here: | 1.5% |
| city: | 3.3% |
Percentage of foreign born residents:
| Here: | 27.4% |
| Boston: | 27.6% |
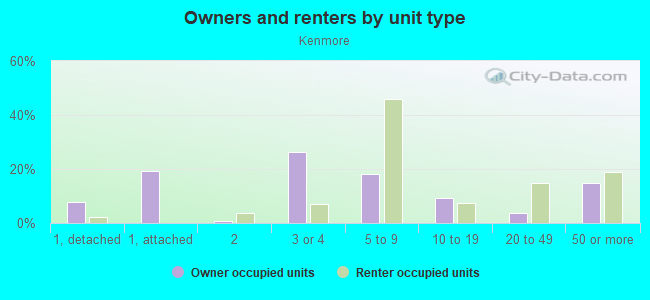
Owner-occupied
Renter-occupied

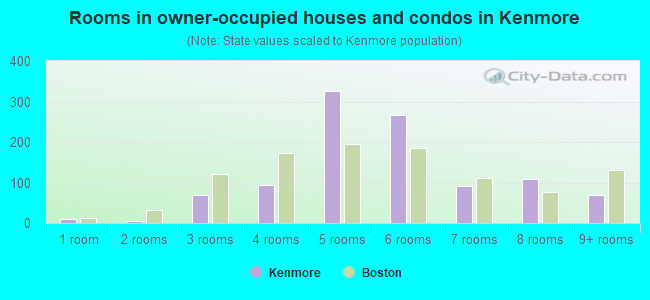
- Rooms in owner-occupied houses and condos in Kenmore
- 101 room
- 52 rooms
- 703 rooms
- 954 rooms
- 3255 rooms
- 2676 rooms
- 927 rooms
- 1088 rooms
- 699+ rooms
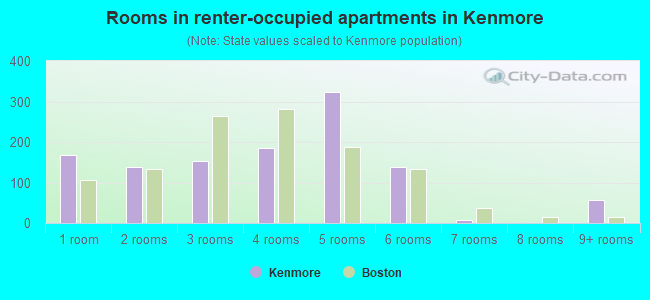
- Rooms in renter-occupied apartments in Kenmore
- 1681 room
- 1392 rooms
- 1523 rooms
- 1864 rooms
- 3245 rooms
- 1386 rooms
- 77 rooms
- 08 rooms
- 569+ rooms
Owner-occupied
Renter-occupied
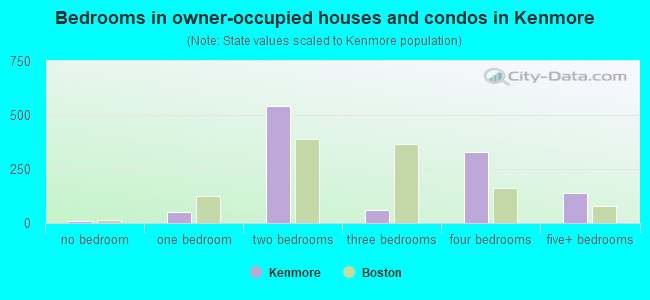
- Bedrooms in owner-occupied houses and condos in Kenmore
- 10no bedroom
- 521 bedroom
- 5432 bedrooms
- 613 bedrooms
- 3304 bedrooms
- 1405+ bedrooms
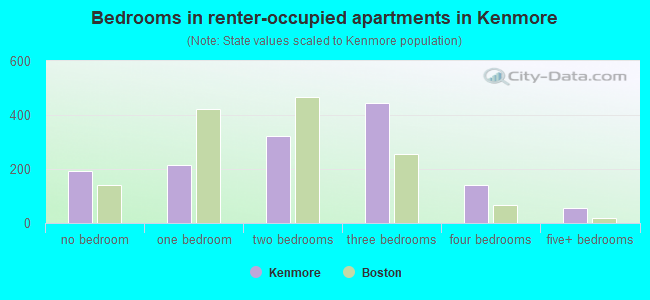
- Bedrooms in renter-occupied apartments in Kenmore
- 191no bedroom
- 2131 bedroom
- 3212 bedrooms
- 4463 bedrooms
- 1404 bedrooms
- 565+ bedrooms
Average number of cars or other vehicles available in houses/condos:
Average number of cars or other vehicles available in apartments:
| This neighborhood: | 2.3 |
| Boston: | 1.4 |
Average number of cars or other vehicles available in apartments:
| Here: | 1.0 |
| city: | 0.7 |
Percentage of units with a mortgage:
| Kenmore: | 27.4% |
| Boston: | 69.7% |
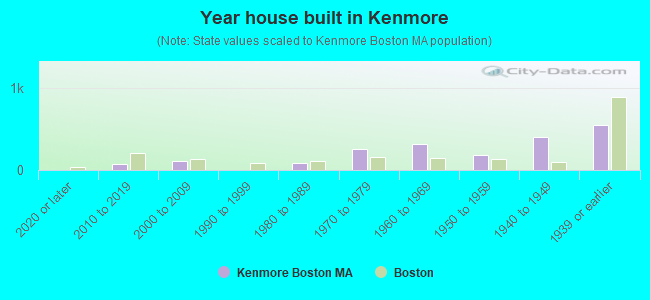
- Year house built in Kenmore
- 02020 or later
- 682010 to 2019
- 1082000 to 2009
- 51990 to 1999
- 891980 to 1989
- 2521970 to 1979
- 3161960 to 1969
- 1841950 to 1959
- 4051940 to 1949
- 5501939 or earlier
City-data.com crime index for city in 2020 (higher means more crime):
| City: | 258.2 |
| U.S. average: | 219.5 |
Travel time to work (commute)
![Travel time to work (commute)]()
- 99Less than 5 minutes
- 3605 to 9 minutes
- 33110 to 14 minutes
- 37215 to 19 minutes
- 25920 to 24 minutes
- 11225 to 29 minutes
- 28130 to 34 minutes
- 2735 to 39 minutes
- 6140 to 44 minutes
- 6845 to 59 minutes
- 7260 to 89 minutes
- 4890 or more minutes

Means of transportation to work
![Means of transportation to work]()
- 20.1%602Drove a car alone
- 8.8%263Carpooled
- 5.4%163Bus
- 4.7%141Subway or elevated rail
- 2.1%62Long-distance train or commuter rail
- 2.8%83Light rail, streetcar or trolley
- 6.4%191Bicycle
- 38.8%1,163Walked
- 1.1%34Other means
- 17.1%513Worked at home

Time leaving home to go to work
![Time leaving home to go to work]()
- 1412:00 a.m. to 4:59 a.m.
- 295:00 a.m. to 5:29 a.m.
- 685:30 a.m. to 5:59 a.m.
- 516:00 a.m. to 6:29 a.m.
- 986:30 a.m. to 6:59 a.m.
- 1687:00 a.m. to 7:29 a.m.
- 2327:30 a.m. to 7:59 a.m.
- 4348:00 a.m. to 8:29 a.m.
- 1728:30 a.m. to 8:59 a.m.
- 2269:00 a.m. to 9:59 a.m.
- 6510:00 a.m. to 10:59 a.m.
- 10411:00 a.m. to 11:59 a.m.
- 25212:00 p.m. to 3:59 p.m.
- 2484:00 p.m. to 11:59 p.m.

Occupations of males:
- Percentage of males in management occupations (except farmers):
Here: 15.5% city: 12.7%
- Percentage of males in business and financial operations occupations:
Here: 9.4% city: 9.1%
- Percentage of males in computer and mathematical occupations:
Here: 7.4% city: 7.4%
- Percentage of males in architecture and engineering occupations:
Here: 1.9% city: 3.1%
- Percentage of males in life, physical, and social science occupations:
Here: 9.8% city: 3.9%
- Percentage of males in legal occupations:
Here: 4.5% city: 2.5%
- Percentage of males in education, training, and library occupations:
Here: 14.6% city: 5.7%
- Percentage of males in arts, design, entertainment, sports, and media occupations:
Here: 1.2% city: 2.7%
- Percentage of males in healthcare practitioners and technical occupations:
Here: 10.1% city: 4.4%
- Percentage of males in service occupations:
Here: 8.8% city: 16.0%
- Percentage of males in sales and office occupations:
Here: 15.8% city: 15.2%
Occupations of females:
- Percentage of females in management occupations (except farmers):
Here: 14.2% city: 12.2%
- Percentage of females in business and financial operations occupations:
Here: 9.2% city: 9.5%
- Percentage of females in computer and mathematical occupations:
Here: 1.9% city: 3.2%
- Percentage of females in architecture and engineering occupations:
Here: 1.2% city: 1.0%
- Percentage of females in life, physical, and social science occupations:
Here: 3.7% city: 3.3%
- Percentage of females in legal occupations:
Here: 12.9% city: 2.3%
- Percentage of females in education, training, and library occupations:
Here: 13.3% city: 9.4%
- Percentage of females in arts, design, entertainment, sports, and media occupations:
Here: 1.9% city: 3.4%
- Percentage of females in healthcare practitioners and technical occupations:
Here: 6.5% city: 10.2%
- Percentage of females in service occupations:
Here: 12.7% city: 18.6%
- Percentage of females in sales and office occupations:
Here: 20.8% city: 20.2%
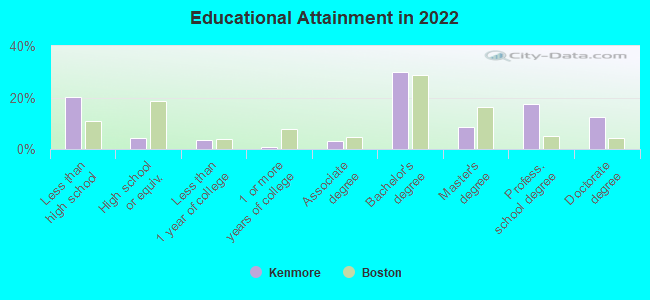
Education in this neighborhood (subdivision or community):
- Percentage of people 3 years and older in K-12 schools:
Kenmore: 15.4% Boston: 11.0%
- Percentage of people 3 years and older in undergraduate colleges:
Kenmore: 38.9% Boston: 11.0%
- Percentage of people 3 years and older in grad. or professional schools:
Kenmore: 12.7% Boston: 4.3%
- Percentage of students K-12 enrolled in private schools:
Kenmore: 16.7% Boston: 13.8%
Percentage of population below poverty level:
| Kenmore: | 19.6% |
| Boston: | 17.1% |
Median year owner moved in (as recorded in 2022):
Median year renter moved in (as recorded in 2022):
| Kenmore: | 2009 |
| Boston: | 2011 |
Median year renter moved in (as recorded in 2022):
| Kenmore: | 2019 |
| Boston: | 2020 |
Percentage of married-couple families with both working:
| Kenmore: | 100.0% |
| Boston: | 78.2% |
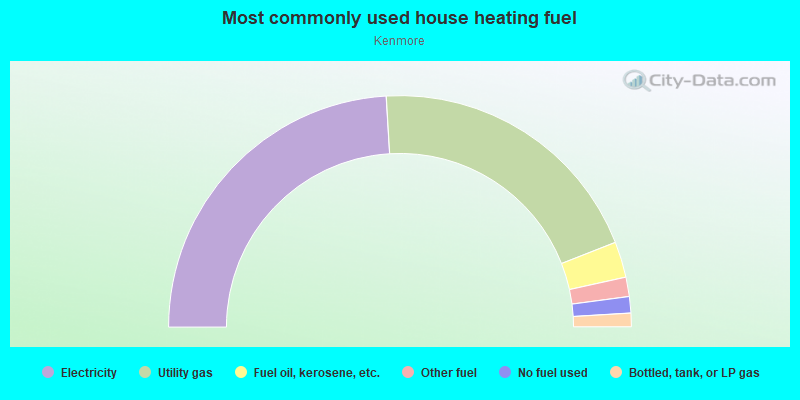
- 48.1%Electricity
- 40.0%Utility gas
- 5.0%Fuel oil, kerosene, etc.
- 2.7%Other fuel
- 2.3%No fuel used
- 1.9%Bottled, tank, or LP gas
Highways in this neighborhood:
Commonwealth Ave (US Hwy 20)
Length: 0.27 miles
Direction: E-W
Direction: E-W
US Hwy 20 (Commonwealth Ave, Saint Marys St)
Length: 0.02 miles
Direction: E-W
Direction: E-W
Roads and streets:
Saint Marys St (St Marys St)
Length: 0.00 miles
Direction: SE-NW
Address range: 197 to 199
Direction: SE-NW
Address range: 197 to 199
Limited-access highways (interstate or state) in this neighborhood:
Massachusetts Tpke (I- 90)
Length: 1.79 miles
Directions: E-W, SE-NW
Directions: E-W, SE-NW
Highways in this neighborhood:
Commonwealth Ave (US Hwy 20)
Length: 2.39 miles
Direction: E-W
Address range: 430 to 558
Direction: E-W
Address range: 430 to 558
State Hwy 2 (Beacon St)
Length: 1.60 miles
Direction: E-W
Address range: 551 to 680
Direction: E-W
Address range: 551 to 680
Commonwealth Ave (Saint Marys St, US Hwy 20)
Length: 0.02 miles
Direction: E-W
Direction: E-W
Roads and streets:
Storrow Memorial Dr
Length: 1.92 miles
Directions: E-W, SW-NE
Directions: E-W, SW-NE
Bay State Rd
Length: 1.23 miles
Directions: E-W, SE-NW
Address range: 1 to 297
Directions: E-W, SE-NW
Address range: 1 to 297
Back St
Length: 0.63 miles
Directions: E-W, SW-NE
Directions: E-W, SW-NE
Brookline Ave
Length: 0.58 miles
Direction: SW-NE
Address range: 1 to 232
Direction: SW-NE
Address range: 1 to 232
Park Dr
Length: 0.51 miles
Directions: N-S, SE-NW
Address range: 400 to 599
Directions: N-S, SE-NW
Address range: 400 to 599
Cummington St
Length: 0.37 miles
Directions: E-W, N-S
Address range: 1 to 199
Directions: E-W, N-S
Address range: 1 to 199
Newbury St
Length: 0.32 miles
Directions: E-W, SE-NW
Address range: 473 to 699
Directions: E-W, SE-NW
Address range: 473 to 699
Mountfort St
Length: 0.29 miles
Directions: E-W, N-S, SE-NW
Address range: 1 to 123
Directions: E-W, N-S, SE-NW
Address range: 1 to 123
Charlesgate W
Length: 0.17 miles
Direction: N-S
Address range: 7 to 78
Direction: N-S
Address range: 7 to 78
Fullerton St
Length: 0.16 miles
Direction: SE-NW
Direction: SE-NW
Overland St
Length: 0.15 miles
Directions: E-W, SE-NW
Address range: 1 to 99
Directions: E-W, SE-NW
Address range: 1 to 99
Buswell St
Length: 0.13 miles
Direction: E-W
Address range: 1 to 24
Direction: E-W
Address range: 1 to 24
Burlington Ave
Length: 0.13 miles
Direction: SE-NW
Address range: 1 to 99
Direction: SE-NW
Address range: 1 to 99
Deerfield St
Length: 0.12 miles
Directions: N-S, SE-NW
Address range: 1 to 99
Directions: N-S, SE-NW
Address range: 1 to 99
N389
Length: 0.12 miles
Directions: E-W, SE-NW, SW-NE
Directions: E-W, SE-NW, SW-NE
Sherborn St
Length: 0.10 miles
Direction: N-S
Address range: 1 to 99
Direction: N-S
Address range: 1 to 99
Medfield St
Length: 0.09 miles
Direction: E-W
Address range: 1 to 60
Direction: E-W
Address range: 1 to 60
Kenmore St
Length: 0.09 miles
Direction: N-S
Address range: 1 to 99
Direction: N-S
Address range: 1 to 99
Maitland St
Length: 0.09 miles
Directions: SE-NW, SW-NE
Directions: SE-NW, SW-NE
Granby St
Length: 0.09 miles
Direction: N-S
Address range: 1 to 99
Direction: N-S
Address range: 1 to 99
Blandford St
Length: 0.09 miles
Direction: N-S
Address range: 1 to 99
Direction: N-S
Address range: 1 to 99
Aberdeen St
Length: 0.08 miles
Direction: SE-NW
Address range: 9 to 99
Direction: SE-NW
Address range: 9 to 99
Raleigh St
Length: 0.08 miles
Directions: N-S, SE-NW
Address range: 1 to 99
Directions: N-S, SE-NW
Address range: 1 to 99
Miner St
Length: 0.08 miles
Direction: SE-NW
Address range: 11 to 99
Direction: SE-NW
Address range: 11 to 99
Fenway Plz
Length: 0.07 miles
Direction: SE-NW
Address range: 1 to 99
Direction: SE-NW
Address range: 1 to 99
University Rd
Length: 0.07 miles
Direction: N-S
Direction: N-S
Riverway
Length: 0.06 miles
Directions: E-W, SE-NW
Directions: E-W, SE-NW
Hinsdale St
Length: 0.06 miles
Direction: N-S
Direction: N-S
Arundel St
Length: 0.06 miles
Direction: SE-NW
Address range: 1 to 99
Direction: SE-NW
Address range: 1 to 99
Keswick St
Length: 0.06 miles
Direction: SE-NW
Address range: 1 to 99
Direction: SE-NW
Address range: 1 to 99
Munson St
Length: 0.05 miles
Direction: SE-NW
Address range: 17 to 99
Direction: SE-NW
Address range: 17 to 99
Railroad features:
Mbta Commuter Rail (Amtrak RR)
Length: 0.85 miles
Direction: E-W
Direction: E-W
Mass transit rail lines:
Mbta Green Line Trolley
Length: 1.39 miles
Directions: E-W, SW-NE
Directions: E-W, SW-NE