Indian Village neighborhood in Detroit, Michigan (MI), 48214 detailed profile
Settings
X


Business Search - 14 Million verified businesses
Area: 0.320 square miles
Population: 1,337
Population density:
| Indian Village: | 4,173 people per square mile |
| Detroit: | 4,471 people per square mile |

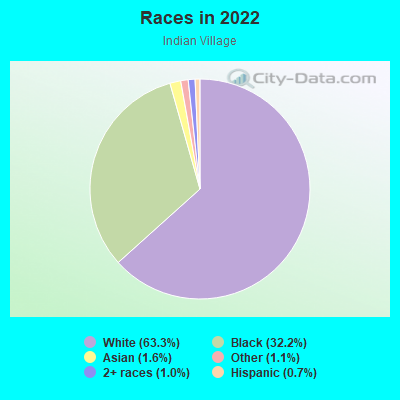
- 84563.3%White
- 42932.2%Black
- 211.6%Asian
- 151.1%Some other race
- 141.0%Two or more races
- 100.7%Hispanic or Latino
Median household income in 2022:
| Indian Village: | $79,848 |
| Detroit: | $36,453 |
Distribution of median household income
![Distribution of median household income]()
- 26Less than $10,000
- 277$10,000 to $19,999
- 68$20,000 to $29,999
- 80$30,000 to $39,999
- 59$40,000 to $49,999
- 28$50,000 to $59,999
- 37$60,000 to $74,999
- 100$75,000 to $99,999
- 38$100,000 to $124,999
- 59$125,000 to $149,999
- 46$150,000 to $199,999
- 179$200,000 or more

Distribution of owner-occupied house/condo value
![Distribution of owner-occupied house/condo value]()
- 426Less than $50,000
- 47$50,000 to $99,999
- 101$100,000 to $149,999
- 159$150,000 to $199,999
- 13$200,000 to $249,999
- 44$250,000 to $299,999
- 87$300,000 to $399,999
- 89$400,000 to $499,999
- 86$500,000 to $749,999
- 34$750,000 to $999,999
- 11$1,000,000 or more

Distribution of rent paid by renters
![Distribution of rent paid by renters]()
- 87$300 to $399
- 38$400 to $499
- 52$500 to $599
- 29$600 to $699
- 58$700 to $799
- 43$800 to $899
- 71$900 to $999
- 93$1,000 to $1,249
- 108$1,250 to $1,499
- 75$1,500 to $1,999
- 9$2,000 or more

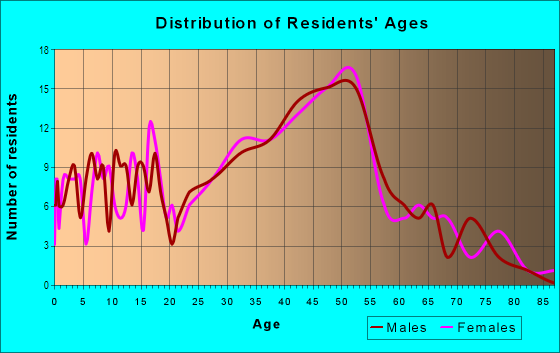
| Males: | 719 |
| Females: | 617 |
Males:
| This neighborhood: | 43.5 years |
| Whole city: | 33.9 years |
| This neighborhood: | 49.7 years |
| Whole city: | 37.0 years |
Average household size:
| Indian Village: | 2.3 people |
| Detroit: | 2.5 people |
Percentage of family households:
| Indian Village: | 32.4% |
| Detroit: | 37.4% |
| Here: | 31.8% |
| Detroit: | 17.7% |
Percentage of married-couple families with children (among all households):
| Indian Village: | 32.4% |
| Detroit: | 12.9% |
Percentage of single-mother households (among all households):
| Indian Village: | 31.1% |
| Detroit: | 22.7% |
Percentage of never married males 15 years old and over:
Percentage of never married females 15 years old and over:
| Indian Village: | 29.3% |
| Detroit: | 28.3% |
Percentage of never married females 15 years old and over:
| Indian Village: | 16.8% |
| city: | 30.2% |
Percentage of people that speak English not well or not at all:
| Indian Village: | 0.0% |
| Detroit: | 2.8% |
Percentage of people born in this state:
Percentage of people born in another U.S. state:
Percentage of native residents but born outside the U.S.:
Percentage of foreign born residents:
| Here: | 61.8% |
| Detroit: | 77.9% |
Percentage of people born in another U.S. state:
| Indian Village: | 32.5% |
| Detroit: | 15.0% |
Percentage of native residents but born outside the U.S.:
| Here: | 0.9% |
| city: | 1.0% |
Percentage of foreign born residents:
| Here: | 4.8% |
| Detroit: | 6.1% |
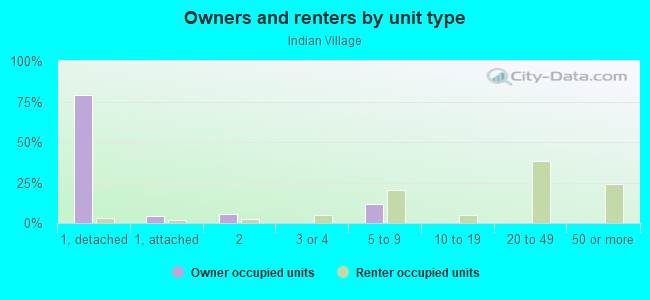
Owner-occupied
Renter-occupied

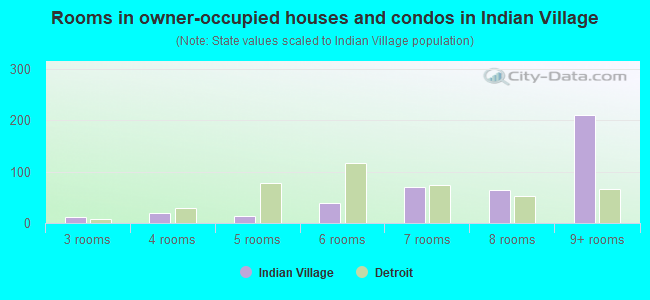
- Rooms in owner-occupied houses and condos in Indian Village
- 01 room
- 02 rooms
- 123 rooms
- 204 rooms
- 135 rooms
- 396 rooms
- 707 rooms
- 648 rooms
- 2109+ rooms
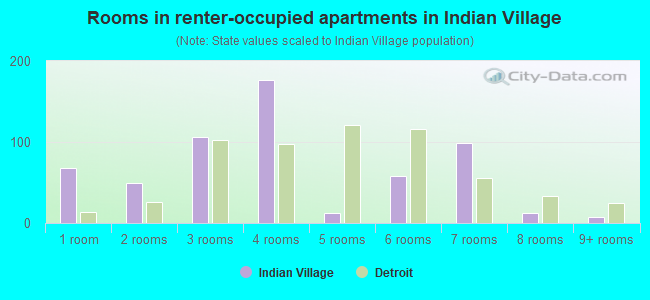
- Rooms in renter-occupied apartments in Indian Village
- 681 room
- 502 rooms
- 1063 rooms
- 1774 rooms
- 125 rooms
- 586 rooms
- 997 rooms
- 128 rooms
- 89+ rooms
Owner-occupied
Renter-occupied
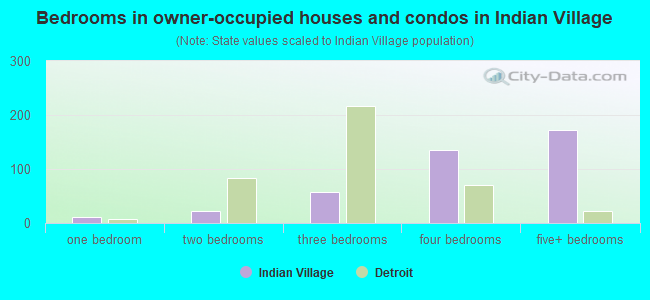
- Bedrooms in owner-occupied houses and condos in Indian Village
- 0no bedroom
- 121 bedroom
- 232 bedrooms
- 583 bedrooms
- 1354 bedrooms
- 1735+ bedrooms
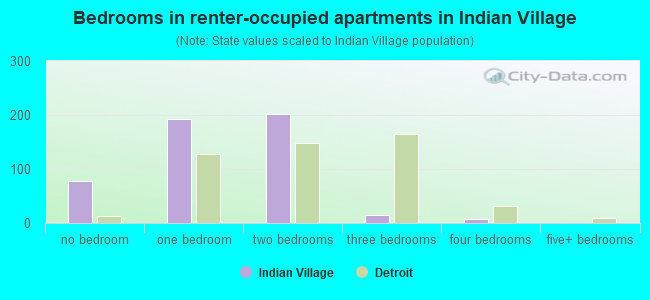
- Bedrooms in renter-occupied apartments in Indian Village
- 78no bedroom
- 1931 bedroom
- 2012 bedrooms
- 143 bedrooms
- 84 bedrooms
- 05+ bedrooms
Average number of cars or other vehicles available in houses/condos:
Average number of cars or other vehicles available in apartments:
| This neighborhood: | 1.8 |
| Detroit: | 1.5 |
Average number of cars or other vehicles available in apartments:
| Here: | |
| city: |
Percentage of units with a mortgage:
| Indian Village: | 70.1% |
| Detroit: | 34.2% |
Housing prices:
- Average estimated value of detached houses in 2022 (56.1% of all units):
Indian Village: $36,897 Detroit: $113,289
- Average estimated value of townhouses or other attached units in 2022 (4.8% of all units):
This neighborhood: $126,657 city: $167,441
- Average estimated value of housing units in 2-unit structures in 2022 (5.6% of all units):
This neighborhood: $125,346 Detroit: $91,488
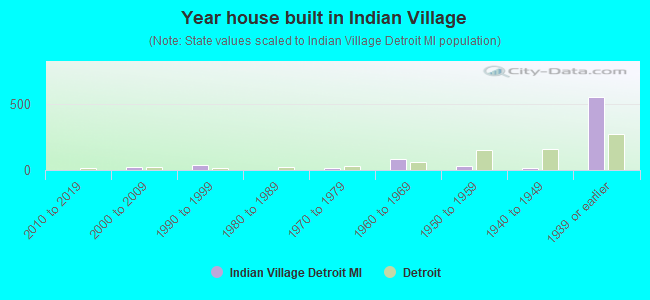
- Year house built in Indian Village
- 02020 or later
- 02010 to 2019
- 202000 to 2009
- 381990 to 1999
- 01980 to 1989
- 161970 to 1979
- 821960 to 1969
- 271950 to 1959
- 141940 to 1949
- 5511939 or earlier
City-data.com crime index for city in 2020 (higher means more crime):
| City: | 796.8 |
| U.S. average: | 219.5 |
Travel time to work (commute)
![Travel time to work (commute)]()
- 10Less than 5 minutes
- 335 to 9 minutes
- 8510 to 14 minutes
- 16515 to 19 minutes
- 3420 to 24 minutes
- 4725 to 29 minutes
- 8330 to 34 minutes
- 3135 to 39 minutes
- 2940 to 44 minutes
- 6345 to 59 minutes
- 2960 to 89 minutes
- 5390 or more minutes

Means of transportation to work
![Means of transportation to work]()
- 67.3%539Drove a car alone
- 1.1%9Carpooled
- 3.5%28Bus
- 2.0%16Subway or elevated rail
- 4.7%38Taxi
- 3.1%25Bicycle
- 10.2%82Walked
- 1.0%8Other means
- 18.9%151Worked at home

Time leaving home to go to work
![Time leaving home to go to work]()
- 2112:00 a.m. to 4:59 a.m.
- 55:00 a.m. to 5:29 a.m.
- 285:30 a.m. to 5:59 a.m.
- 136:00 a.m. to 6:29 a.m.
- 366:30 a.m. to 6:59 a.m.
- 427:00 a.m. to 7:29 a.m.
- 917:30 a.m. to 7:59 a.m.
- 1888:00 a.m. to 8:29 a.m.
- 908:30 a.m. to 8:59 a.m.
- 839:00 a.m. to 9:59 a.m.
- 2210:00 a.m. to 10:59 a.m.
- 3512:00 p.m. to 3:59 p.m.
- 124:00 p.m. to 11:59 p.m.

Occupations of males:
- Percentage of males in management occupations (except farmers):
Here: 20.8% city: 5.6%
- Percentage of males in business and financial operations occupations:
Here: 7.5% city: 3.1%
- Percentage of males in computer and mathematical occupations:
Here: 3.0% city: 2.3%
- Percentage of males in architecture and engineering occupations:
Here: 7.2% city: 2.3%
- Percentage of males in life, physical, and social science occupations:
Here: 3.6% city: 0.5%
- Percentage of males in community and social services occupations:
Here: 1.0% city: 1.4%
- Percentage of males in legal occupations:
Here: 5.3% city: 0.6%
- Percentage of males in education, training, and library occupations:
Here: 10.5% city: 2.3%
- Percentage of males in arts, design, entertainment, sports, and media occupations:
Here: 15.5% city: 1.9%
- Percentage of males in healthcare practitioners and technical occupations:
Here: 3.3% city: 1.8%
- Percentage of males in service occupations:
Here: 7.2% city: 21.4%
- Percentage of males in sales and office occupations:
Here: 6.6% city: 11.8%
- Percentage of males in construction, extraction, and maintenance occupations:
Here: 4.3% city: 7.9%
- Percentage of males in production occupations:
Here: 3.1% city: 14.4%
- Percentage of males in transportation occupations:
Here: 1.2% city: 8.3%
Occupations of females:
- Percentage of females in management occupations (except farmers):
Here: 17.6% city: 6.9%
- Percentage of females in business and financial operations occupations:
Here: 8.0% city: 4.5%
- Percentage of females in architecture and engineering occupations:
Here: 2.3% city: 0.4%
- Percentage of females in community and social services occupations:
Here: 1.1% city: 3.2%
- Percentage of females in education, training, and library occupations:
Here: 9.4% city: 6.0%
- Percentage of females in arts, design, entertainment, sports, and media occupations:
Here: 6.5% city: 1.2%
- Percentage of females in healthcare practitioners and technical occupations:
Here: 24.9% city: 6.4%
- Percentage of females in service occupations:
Here: 5.8% city: 27.1%
- Percentage of females in sales and office occupations:
Here: 18.8% city: 26.6%
- Percentage of females in production occupations:
Here: 4.6% city: 7.5%
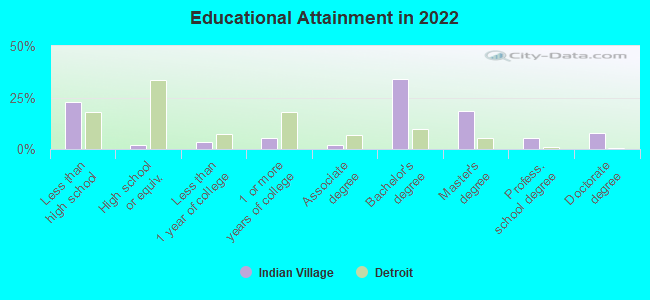
Education in this neighborhood (subdivision or community):
- Percentage of people 3 years and older in K-12 schools:
Indian Village: 16.8% Detroit: 18.0%
- Percentage of people 3 years and older in undergraduate colleges:
Indian Village: 1.0% Detroit: 3.8%
- Percentage of people 3 years and older in grad. or professional schools:
Indian Village: 2.0% Detroit: 1.0%
- Percentage of students K-12 enrolled in private schools:
Indian Village: 53.3% Detroit: 8.2%
Percentage of population below poverty level:
| Indian Village: | 9.8% |
| Detroit: | 33.8% |
Median year owner moved in (as recorded in 2022):
| Indian Village: | 2004 |
| Detroit: | 2005 |
Percentage of married-couple families with both working:
| Indian Village: | 92.7% |
| Detroit: | 40.7% |
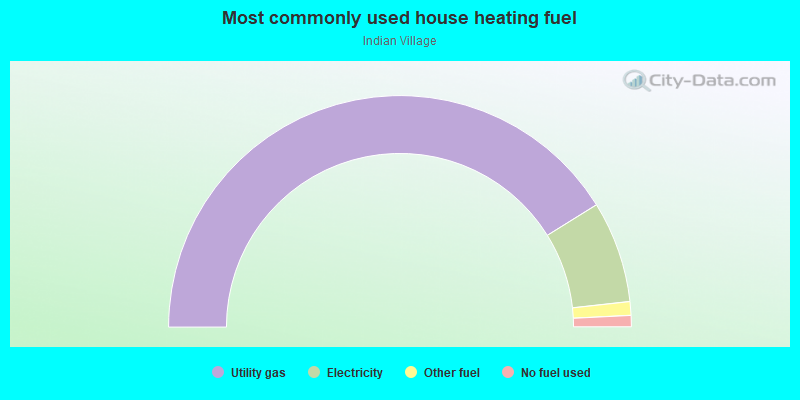
- 82.3%Utility gas
- 14.2%Electricity
- 1.9%Other fuel
- 1.6%No fuel used
Roads and streets:
Iroquois St
Length: 1.17 miles
Direction: SE-NW
Address range: 1001 to 3699
Direction: SE-NW
Address range: 1001 to 3699
Burns St
Length: 1.02 miles
Direction: SE-NW
Address range: 1400 to 3599
Direction: SE-NW
Address range: 1400 to 3599
Seminole St
Length: 1.00 miles
Direction: SE-NW
Address range: 1000 to 3399
Direction: SE-NW
Address range: 1000 to 3399
Maxwell St
Length: 0.38 miles
Direction: SE-NW
Address range: 2100 to 2899
Direction: SE-NW
Address range: 2100 to 2899
Charlevoix St
Length: 0.27 miles
Direction: E-W
Address range: 8200 to 8599
Direction: E-W
Address range: 8200 to 8599
E Vernor Hwy
Length: 0.27 miles
Direction: E-W
Address range: 8200 to 8599
Direction: E-W
Address range: 8200 to 8599
Kercheval St
Length: 0.27 miles
Direction: E-W
Address range: 8114 to 8599
Direction: E-W
Address range: 8114 to 8599
Agnes St
Length: 0.21 miles
Direction: E-W
Address range: 8300 to 8599
Direction: E-W
Address range: 8300 to 8599
Goethe St
Length: 0.21 miles
Direction: E-W
Address range: 8300 to 8599
Direction: E-W
Address range: 8300 to 8599
St Paul St
Length: 0.21 miles
Direction: E-W
Address range: 8300 to 8599
Direction: E-W
Address range: 8300 to 8599
Mack Ave
Length: 0.12 miles
Direction: E-W
Address range: 8400 to 8632
Direction: E-W
Address range: 8400 to 8632
Lafayette St E
Length: 0.11 miles
Direction: E-W
Address range: 8300 to 8369
Direction: E-W
Address range: 8300 to 8369