Harbor Islands neighborhood in Boston, Massachusetts (MA), 02171, 00157, 02152 detailed profile
Settings
X

Business Search - 14 Million verified businesses
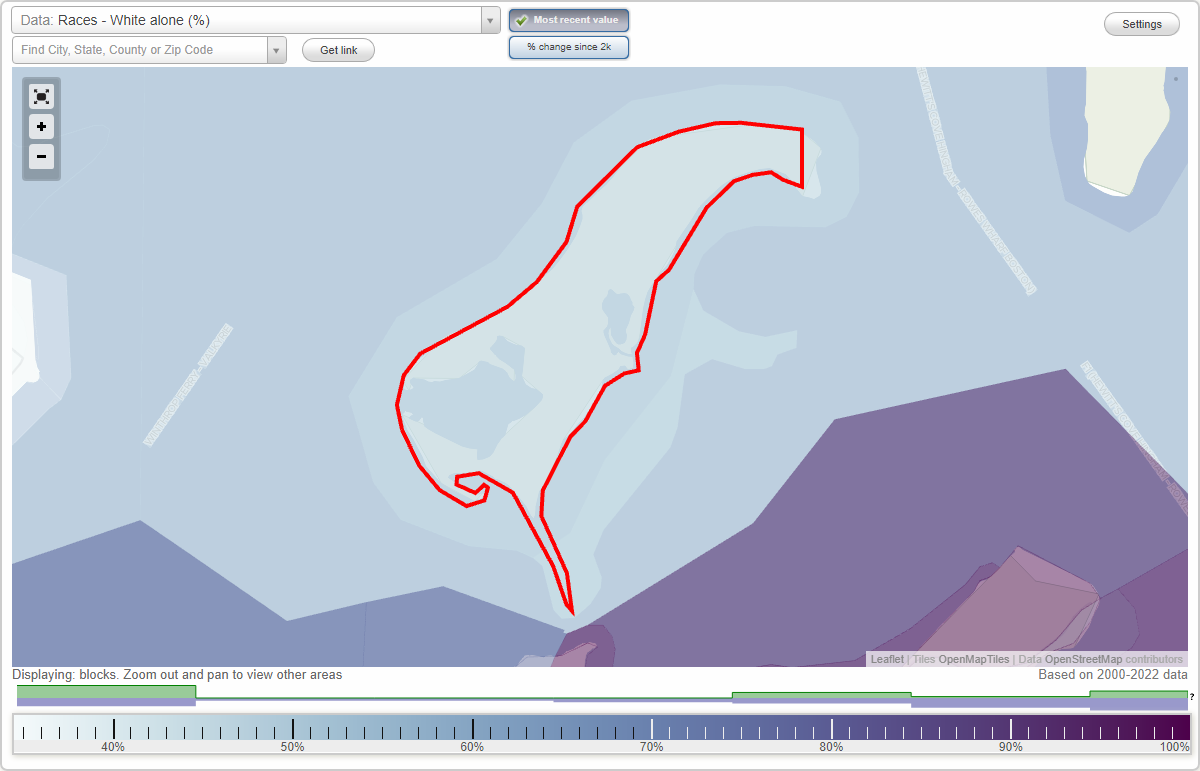
Area: 1.388 square miles
Population: 824
Population density:
| Harbor Islands: | 594 people per square mile |
| Boston: | 13,418 people per square mile |

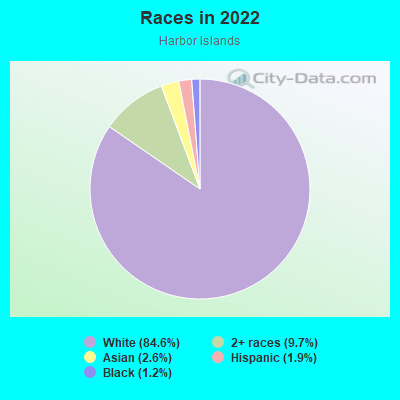
- 69684.6%White
- 809.7%Two or more races
- 212.6%Asian
- 161.9%Hispanic or Latino
- 101.2%Black
Median household income in 2022:
| Harbor Islands: | $174,143 |
| Boston: | $86,331 |
Distribution of median household income
![Distribution of median household income]()
- 6Less than $10,000
- 9$10,000 to $19,999
- 13$20,000 to $29,999
- 13$30,000 to $39,999
- 17$40,000 to $49,999
- 5$50,000 to $59,999
- 31$60,000 to $74,999
- 48$75,000 to $99,999
- 27$100,000 to $124,999
- 21$125,000 to $149,999
- 95$150,000 to $199,999
- 66$200,000 or more

Distribution of owner-occupied house/condo value
![Distribution of owner-occupied house/condo value]()
- 3Less than $50,000
- 4$50,000 to $99,999
- 4$200,000 to $249,999
- 9$250,000 to $299,999
- 16$300,000 to $399,999
- 85$400,000 to $499,999
- 59$500,000 to $749,999
- 59$750,000 to $999,999
- 30$1,000,000 or more

Distribution of rent paid by renters
![Distribution of rent paid by renters]()
- 1$500 to $599
- 2$600 to $699
- 3$800 to $899
- 2$900 to $999
- 5$1,000 to $1,249
- 10$1,250 to $1,499
- 12$1,500 to $1,999
- 37$2,000 or more

Median rent in 2022:
| Harbor Islands: | $2,166 |
| Boston: | $1,814 |
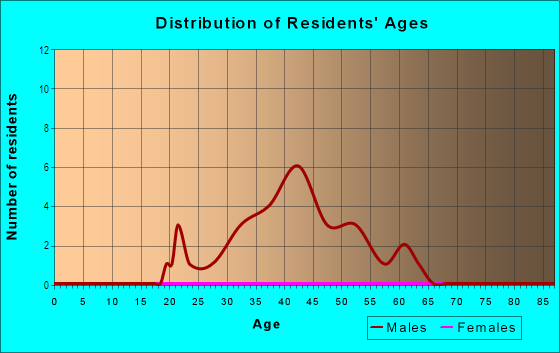
| Males: | 358 |
| Females: | 465 |
Males:
| This neighborhood: | 49.3 years |
| Whole city: | 32.7 years |
| This neighborhood: | 38.9 years |
| Whole city: | 34.1 years |
Average household size:
| Harbor Islands: | 2.9 people |
| Boston: | 2.1 people |
Percentage of family households:
| Harbor Islands: | 43.6% |
| Boston: | 34.5% |
| Here: | 64.1% |
| Boston: | 26.9% |
Percentage of married-couple families with children (among all households):
| Harbor Islands: | 34.7% |
| Boston: | 24.9% |
Percentage of single-mother households (among all households):
| Harbor Islands: | 1.8% |
| Boston: | 15.7% |
Percentage of never married males 15 years old and over:
Percentage of never married females 15 years old and over:
| Harbor Islands: | 12.2% |
| Boston: | 26.8% |
Percentage of never married females 15 years old and over:
| Harbor Islands: | 18.5% |
| city: | 28.3% |
Percentage of people that speak English not well or not at all:
| Harbor Islands: | 0.0% |
| Boston: | 8.0% |
Percentage of people born in this state:
Percentage of people born in another U.S. state:
Percentage of native residents but born outside the U.S.:
Percentage of foreign born residents:
| Here: | 56.6% |
| Boston: | 42.4% |
Percentage of people born in another U.S. state:
| Harbor Islands: | 26.1% |
| Boston: | 26.6% |
Percentage of native residents but born outside the U.S.:
| Here: | 4.2% |
| city: | 3.3% |
Percentage of foreign born residents:
| Here: | 13.1% |
| Boston: | 27.6% |
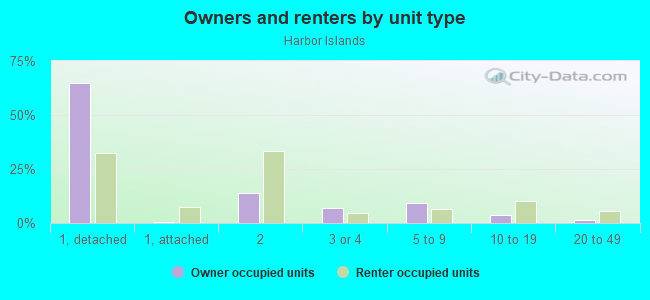
Owner-occupied
Renter-occupied

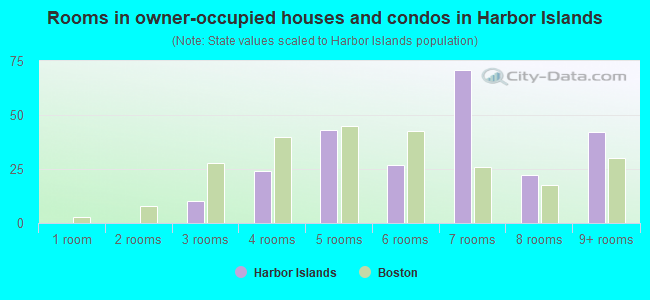
- Rooms in owner-occupied houses and condos in Harbor Islands
- 01 room
- 02 rooms
- 103 rooms
- 244 rooms
- 435 rooms
- 276 rooms
- 717 rooms
- 228 rooms
- 429+ rooms
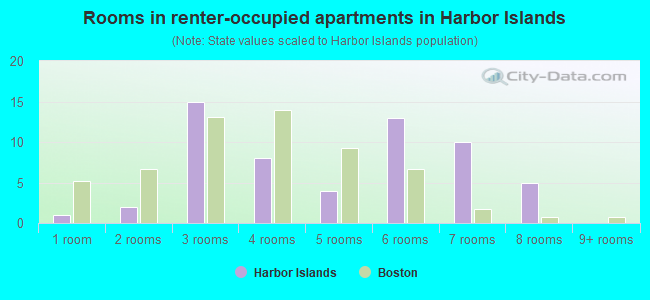
- Rooms in renter-occupied apartments in Harbor Islands
- 11 room
- 22 rooms
- 153 rooms
- 84 rooms
- 45 rooms
- 136 rooms
- 107 rooms
- 58 rooms
- 09+ rooms
Owner-occupied
Renter-occupied
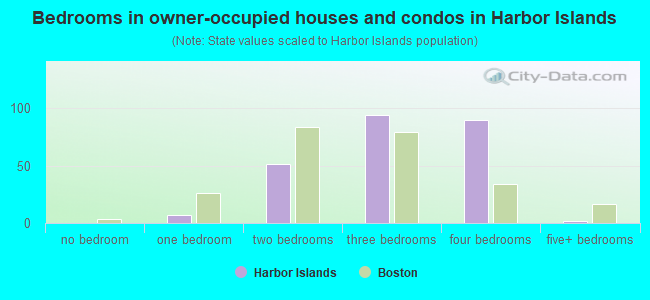
- Bedrooms in owner-occupied houses and condos in Harbor Islands
- 0no bedroom
- 71 bedroom
- 512 bedrooms
- 943 bedrooms
- 904 bedrooms
- 25+ bedrooms
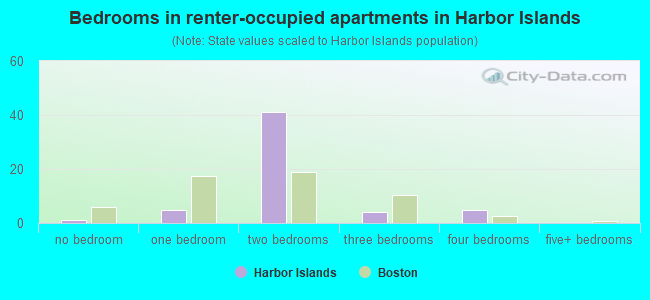
- Bedrooms in renter-occupied apartments in Harbor Islands
- 1no bedroom
- 51 bedroom
- 412 bedrooms
- 43 bedrooms
- 54 bedrooms
- 05+ bedrooms
Average number of cars or other vehicles available in houses/condos:
Average number of cars or other vehicles available in apartments:
| This neighborhood: | 1.6 |
| Boston: | 1.4 |
Average number of cars or other vehicles available in apartments:
| Here: | 1.1 |
| city: | 0.7 |
Percentage of units with a mortgage:
| Harbor Islands: | 73.7% |
| Boston: | 69.7% |
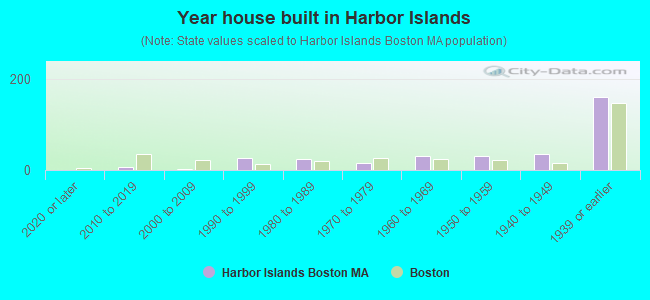
- Year house built in Harbor Islands
- 02020 or later
- 62010 to 2019
- 32000 to 2009
- 261990 to 1999
- 241980 to 1989
- 161970 to 1979
- 301960 to 1969
- 301950 to 1959
- 361940 to 1949
- 1601939 or earlier
City-data.com crime index for city in 2020 (higher means more crime):
| City: | 258.2 |
| U.S. average: | 219.5 |
Travel time to work (commute)
![Travel time to work (commute)]()
- 185 to 9 minutes
- 1410 to 14 minutes
- 715 to 19 minutes
- 2920 to 24 minutes
- 1725 to 29 minutes
- 4530 to 34 minutes
- 835 to 39 minutes
- 1840 to 44 minutes
- 4645 to 59 minutes
- 2060 to 89 minutes
- 990 or more minutes

Means of transportation to work
![Means of transportation to work]()
- 60.8%245Drove a car alone
- 4.2%17Carpooled
- 1.2%5Bus
- 8.2%33Subway or elevated rail
- 0.5%2Long-distance train or commuter rail
- 0.2%1Light rail, streetcar or trolley
- 0.2%1Ferryboat
- 3.5%14Other means
- 25.3%102Worked at home

Time leaving home to go to work
![Time leaving home to go to work]()
- 912:00 a.m. to 4:59 a.m.
- 15:00 a.m. to 5:29 a.m.
- 85:30 a.m. to 5:59 a.m.
- 376:00 a.m. to 6:29 a.m.
- 196:30 a.m. to 6:59 a.m.
- 217:00 a.m. to 7:29 a.m.
- 187:30 a.m. to 7:59 a.m.
- 378:00 a.m. to 8:29 a.m.
- 158:30 a.m. to 8:59 a.m.
- 129:00 a.m. to 9:59 a.m.
- 710:00 a.m. to 10:59 a.m.
- 411:00 a.m. to 11:59 a.m.
- 2712:00 p.m. to 3:59 p.m.
- 154:00 p.m. to 11:59 p.m.

Occupations of males:
- Percentage of males in management occupations (except farmers):
Here: 23.7% city: 12.7%
- Percentage of males in business and financial operations occupations:
Here: 11.7% city: 9.1%
- Percentage of males in computer and mathematical occupations:
Here: 7.1% city: 7.4%
- Percentage of males in architecture and engineering occupations:
Here: 1.5% city: 3.1%
- Percentage of males in community and social services occupations:
Here: 2.8% city: 1.4%
- Percentage of males in education, training, and library occupations:
Here: 10.2% city: 5.7%
- Percentage of males in arts, design, entertainment, sports, and media occupations:
Here: 9.8% city: 2.7%
- Percentage of males in healthcare practitioners and technical occupations:
Here: 3.1% city: 4.4%
- Percentage of males in service occupations:
Here: 7.4% city: 16.0%
- Percentage of males in sales and office occupations:
Here: 5.2% city: 15.2%
- Percentage of males in construction, extraction, and maintenance occupations:
Here: 6.2% city: 4.4%
- Percentage of males in transportation occupations:
Here: 4.0% city: 4.7%
- Percentage of males in material moving occupations:
Here: 2.9% city: 2.3%
Occupations of females:
- Percentage of females in management occupations (except farmers):
Here: 28.2% city: 12.2%
- Percentage of females in business and financial operations occupations:
Here: 27.7% city: 9.5%
- Percentage of females in computer and mathematical occupations:
Here: 7.6% city: 3.2%
- Percentage of females in life, physical, and social science occupations:
Here: 1.7% city: 3.3%
- Percentage of females in community and social services occupations:
Here: 2.6% city: 3.1%
- Percentage of females in legal occupations:
Here: 4.1% city: 2.3%
- Percentage of females in education, training, and library occupations:
Here: 10.7% city: 9.4%
- Percentage of females in healthcare practitioners and technical occupations:
Here: 3.7% city: 10.2%
- Percentage of females in service occupations:
Here: 4.2% city: 18.6%
- Percentage of females in sales and office occupations:
Here: 16.1% city: 20.2%
- Percentage of females in transportation occupations:
Here: 8.1% city: 0.8%
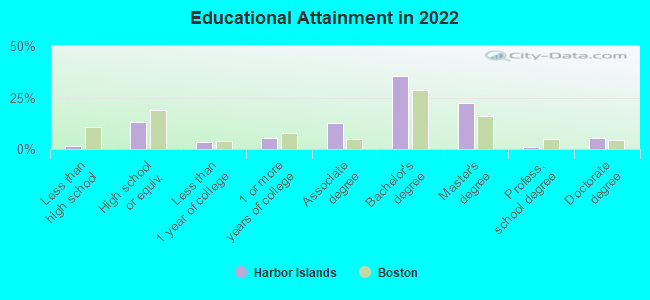
Education in this neighborhood (subdivision or community):
- Percentage of people 3 years and older in K-12 schools:
Harbor Islands: 16.6% Boston: 11.0%
- Percentage of people 3 years and older in undergraduate colleges:
Harbor Islands: 3.9% Boston: 11.0%
- Percentage of people 3 years and older in grad. or professional schools:
Harbor Islands: 8.0% Boston: 4.3%
- Percentage of students K-12 enrolled in private schools:
Harbor Islands: 0.7% Boston: 13.8%
Percentage of population below poverty level:
| Harbor Islands: | 6.4% |
| Boston: | 17.1% |
Median year owner moved in (as recorded in 2022):
Median year renter moved in (as recorded in 2022):
| Harbor Islands: | 2148 |
| Boston: | 2011 |
Median year renter moved in (as recorded in 2022):
| Harbor Islands: | 2158 |
| Boston: | 2020 |
Percentage of married-couple families with both working:
| Harbor Islands: | 92.0% |
| Boston: | 78.2% |
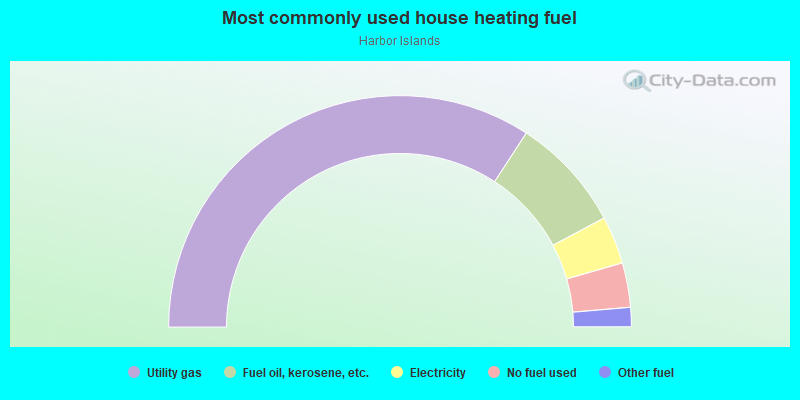
- 68.4%Utility gas
- 16.0%Fuel oil, kerosene, etc.
- 6.7%Electricity
- 6.2%No fuel used
- 2.7%Other fuel
Roads and streets:
Long Island Rd
Length: 1.63 miles
Directions: E-W, N-S, SE-NW, SW-NE
Directions: E-W, N-S, SE-NW, SW-NE
Tafts Ave
Length: 1.26 miles
Directions: E-W, N-S, SE-NW
Directions: E-W, N-S, SE-NW
Deer Island Rd
Length: 0.82 miles
Directions: E-W, N-S, SE-NW, SW-NE
Directions: E-W, N-S, SE-NW, SW-NE
Gallups Island St
Length: 0.46 miles
Direction: E-W
Direction: E-W
Taft Ave
Length: 0.46 miles
Directions: E-W, N-S, SE-NW
Directions: E-W, N-S, SE-NW
Lovell Island Rd
Length: 0.40 miles
Directions: E-W, SE-NW
Directions: E-W, SE-NW
Correction House Rd
Length: 0.35 miles
Directions: E-W, N-S, SW-NE
Directions: E-W, N-S, SW-NE
Fort Dawes Rd
Length: 0.16 miles
Directions: E-W, SE-NW
Directions: E-W, SE-NW