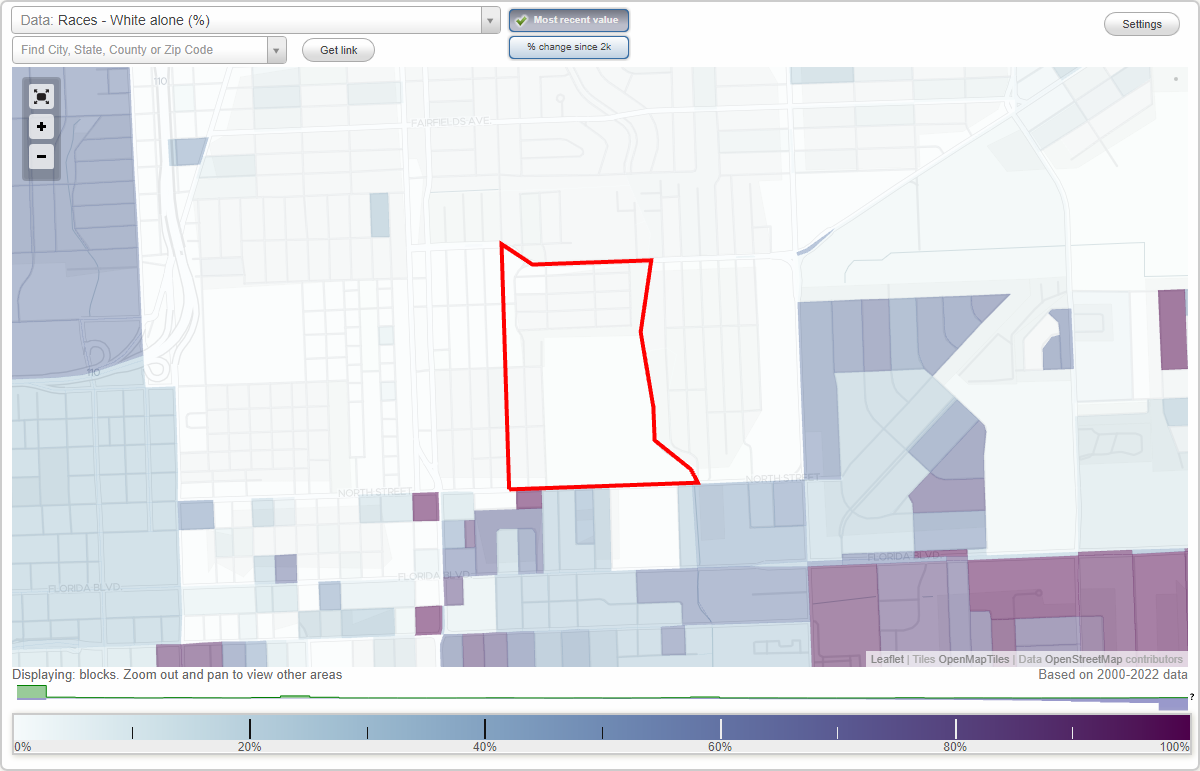
Greenville Addition neighborhood in Baton Rouge, Louisiana (LA), 70802 detailed profile
Settings
X

Business Search - 14 Million verified businesses
Area: 0.219 square miles
Population: 2,427
Population density:
| Greenville Addition: | 11,063 people per square mile |
| Baton Rouge: | 2,882 people per square mile |

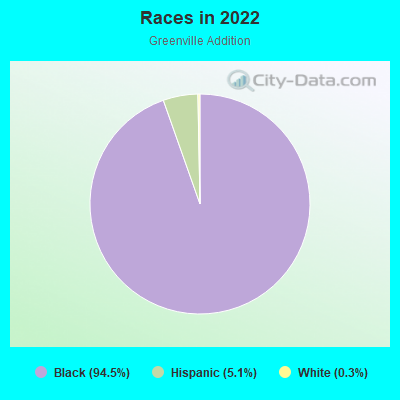
- 2,29494.5%Black
- 1255.1%Hispanic or Latino
- 70.3%White
- 20.08%Two or more races
Median household income in 2022:
| Greenville Addition: | $35,441 |
| Baton Rouge: | $50,304 |
Distribution of median household income
![Distribution of median household income]()
- 88Less than $10,000
- 166$10,000 to $19,999
- 169$20,000 to $29,999
- 173$30,000 to $39,999
- 193$40,000 to $49,999
- 62$50,000 to $59,999
- 60$60,000 to $74,999
- 54$75,000 to $99,999
- 96$100,000 to $124,999
- 44$125,000 to $149,999
- 13$200,000 or more

Distribution of owner-occupied house/condo value
![Distribution of owner-occupied house/condo value]()
- 121Less than $50,000
- 274$50,000 to $99,999
- 111$100,000 to $149,999
- 15$200,000 to $249,999

Distribution of rent paid by renters
![Distribution of rent paid by renters]()
- 44Less than $100
- 122$300 to $399
- 83$400 to $499
- 124$500 to $599
- 98$600 to $699
- 89$700 to $799
- 125$800 to $899
- 44$900 to $999
- 21$1,000 to $1,249

Median rent in 2022:
| Greenville Addition: | $653 |
| Baton Rouge: | $832 |
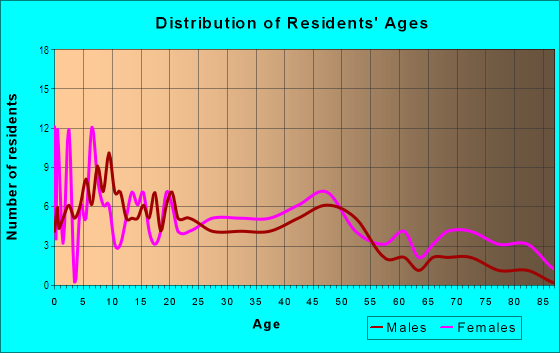
| Males: | 1,201 |
| Females: | 1,226 |
Males:
| This neighborhood: | 42.7 years |
| Whole city: | 29.6 years |
| This neighborhood: | 39.9 years |
| Whole city: | 32.8 years |
Average household size:
| Greenville Addition: | 2.4 people |
| Baton Rouge: | 2.3 people |
Percentage of family households:
| Greenville Addition: | 36.9% |
| Baton Rouge: | 36.6% |
| Here: | 11.0% |
| Baton Rouge: | 27.8% |
Percentage of married-couple families with children (among all households):
| Greenville Addition: | 16.2% |
| Baton Rouge: | 15.1% |
Percentage of single-mother households (among all households):
| Greenville Addition: | 36.5% |
| Baton Rouge: | 22.4% |
Percentage of never married males 15 years old and over:
Percentage of never married females 15 years old and over:
| Greenville Addition: | 36.2% |
| Baton Rouge: | 27.3% |
Percentage of never married females 15 years old and over:
| Greenville Addition: | 22.7% |
| city: | 27.2% |
Percentage of people that speak English not well or not at all:
| Greenville Addition: | 0.0% |
| Baton Rouge: | 1.8% |
Percentage of people born in this state:
Percentage of people born in another U.S. state:
Percentage of native residents but born outside the U.S.:
Percentage of foreign born residents:
| Here: | 94.5% |
| Baton Rouge: | 74.7% |
Percentage of people born in another U.S. state:
| Greenville Addition: | 5.5% |
| Baton Rouge: | 17.8% |
Percentage of native residents but born outside the U.S.:
| Here: | 0.0% |
| city: | 0.5% |
Percentage of foreign born residents:
| Here: | 0.0% |
| Baton Rouge: | 7.0% |
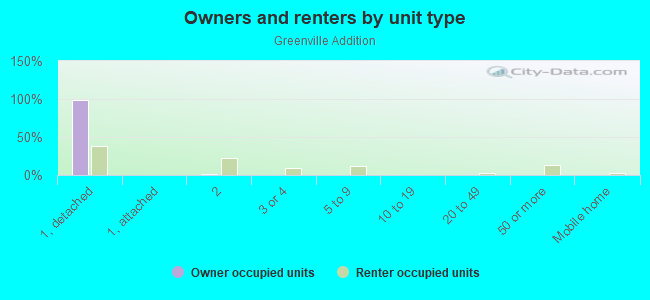
Owner-occupied
Renter-occupied

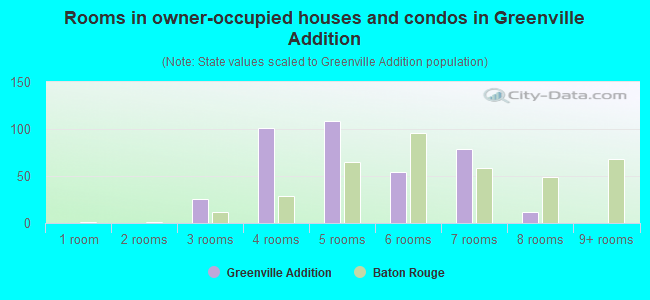
- Rooms in owner-occupied houses and condos in Greenville Addition
- 01 room
- 02 rooms
- 263 rooms
- 1014 rooms
- 1085 rooms
- 546 rooms
- 797 rooms
- 128 rooms
- 09+ rooms
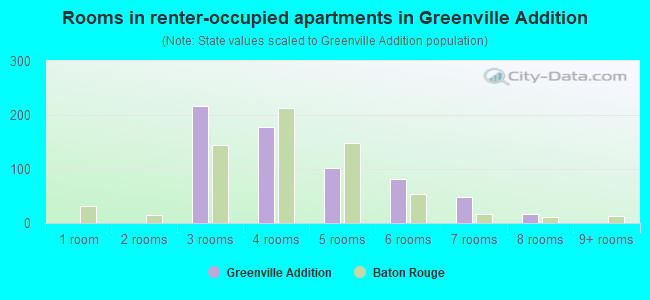
- Rooms in renter-occupied apartments in Greenville Addition
- 01 room
- 02 rooms
- 2163 rooms
- 1784 rooms
- 1025 rooms
- 826 rooms
- 497 rooms
- 168 rooms
- 09+ rooms
Owner-occupied
Renter-occupied
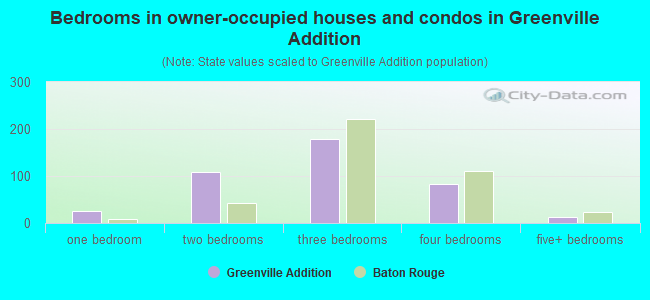
- Bedrooms in owner-occupied houses and condos in Greenville Addition
- 0no bedroom
- 261 bedroom
- 1092 bedrooms
- 1783 bedrooms
- 834 bedrooms
- 125+ bedrooms
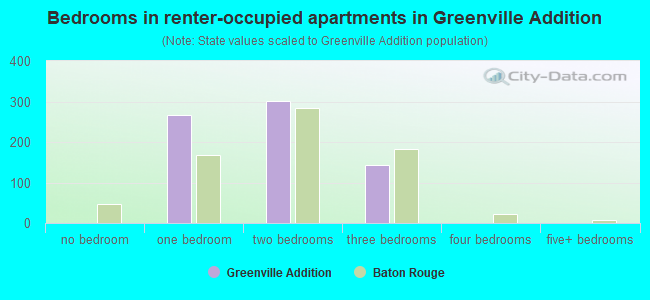
- Bedrooms in renter-occupied apartments in Greenville Addition
- 0no bedroom
- 2661 bedroom
- 3012 bedrooms
- 1433 bedrooms
- 04 bedrooms
- 05+ bedrooms
Average number of cars or other vehicles available in houses/condos:
Average number of cars or other vehicles available in apartments:
| This neighborhood: | 1.3 |
| Baton Rouge: | 1.7 |
Average number of cars or other vehicles available in apartments:
| Here: | 1.2 |
| city: | 1.3 |
Percentage of units with a mortgage:
| Greenville Addition: | 21.5% |
| Baton Rouge: | 56.3% |
Average estimated value of detached houses in 2022 (73.3% of all units):
| Greenville Addition: | $67,673 |
| Louisiana: | $273,555 |
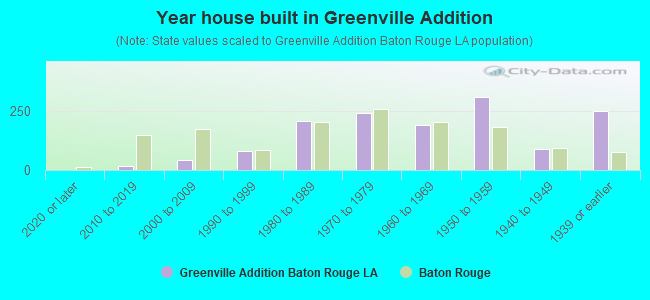
- Year house built in Greenville Addition
- 02020 or later
- 162010 to 2019
- 412000 to 2009
- 821990 to 1999
- 2071980 to 1989
- 2411970 to 1979
- 1891960 to 1969
- 3061950 to 1959
- 881940 to 1949
- 2501939 or earlier
City-data.com crime index for city in 2020 (higher means more crime):
| City: | 544.1 |
| U.S. average: | 219.5 |
Travel time to work (commute)
![Travel time to work (commute)]()
- 17Less than 5 minutes
- 475 to 9 minutes
- 4310 to 14 minutes
- 5215 to 19 minutes
- 1320 to 24 minutes
- 825 to 29 minutes
- 2930 to 34 minutes
- 440 to 44 minutes
- 7345 to 59 minutes
- 160 to 89 minutes
- 390 or more minutes

Means of transportation to work
![Means of transportation to work]()
- 73.9%834Drove a car alone
- 19.6%221Carpooled
- 5.8%65Bus
- 3.3%37Walked
- 3.8%43Other means
- 1.2%14Worked at home

Time leaving home to go to work
![Time leaving home to go to work]()
- 512:00 a.m. to 4:59 a.m.
- 105:00 a.m. to 5:29 a.m.
- 165:30 a.m. to 5:59 a.m.
- 186:00 a.m. to 6:29 a.m.
- 126:30 a.m. to 6:59 a.m.
- 497:00 a.m. to 7:29 a.m.
- 467:30 a.m. to 7:59 a.m.
- 98:00 a.m. to 8:29 a.m.
- 139:00 a.m. to 9:59 a.m.
- 610:00 a.m. to 10:59 a.m.
- 111:00 a.m. to 11:59 a.m.
- 3512:00 p.m. to 3:59 p.m.
- 264:00 p.m. to 11:59 p.m.

Occupations of males:
- Percentage of males in management occupations (except farmers):
Here: 3.7% city: 9.5%
- Percentage of males in service occupations:
Here: 43.1% city: 16.2%
- Percentage of males in sales and office occupations:
Here: 22.9% city: 12.7%
- Percentage of males in construction, extraction, and maintenance occupations:
Here: 2.4% city: 8.7%
- Percentage of males in production occupations:
Here: 13.8% city: 6.5%
- Percentage of males in transportation occupations:
Here: 6.9% city: 6.6%
- Percentage of males in material moving occupations:
Here: 7.3% city: 7.0%
Occupations of females:
- Percentage of females in management occupations (except farmers):
Here: 1.7% city: 8.6%
- Percentage of females in business and financial operations occupations:
Here: 4.4% city: 4.9%
- Percentage of females in life, physical, and social science occupations:
Here: 1.9% city: 1.3%
- Percentage of females in education, training, and library occupations:
Here: 6.9% city: 10.7%
- Percentage of females in service occupations:
Here: 44.2% city: 24.5%
- Percentage of females in sales and office occupations:
Here: 37.7% city: 26.5%
- Percentage of females in transportation occupations:
Here: 2.6% city: 1.4%
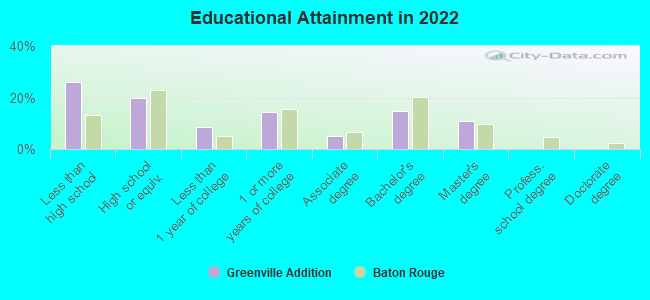
Education in this neighborhood (subdivision or community):
- Percentage of people 3 years and older in K-12 schools:
Greenville Addition: 25.7% Baton Rouge: 14.3%
- Percentage of people 3 years and older in undergraduate colleges:
Greenville Addition: 11.1% Baton Rouge: 14.0%
- Percentage of people 3 years and older in grad. or professional schools:
Greenville Addition: 3.0% Baton Rouge: 2.5%
- Percentage of students K-12 enrolled in private schools:
Greenville Addition: 2.5% Baton Rouge: 22.0%
Percentage of population below poverty level:
| Greenville Addition: | 19.1% |
| Baton Rouge: | 22.4% |
Median year owner moved in (as recorded in 2022):
Median year renter moved in (as recorded in 2022):
| Greenville Addition: | 1999 |
| Baton Rouge: | 2007 |
Median year renter moved in (as recorded in 2022):
| Greenville Addition: | 2014 |
| Baton Rouge: | 2020 |
Percentage of married-couple families with both working:
| Greenville Addition: | 100.0% |
| Baton Rouge: | 80.7% |
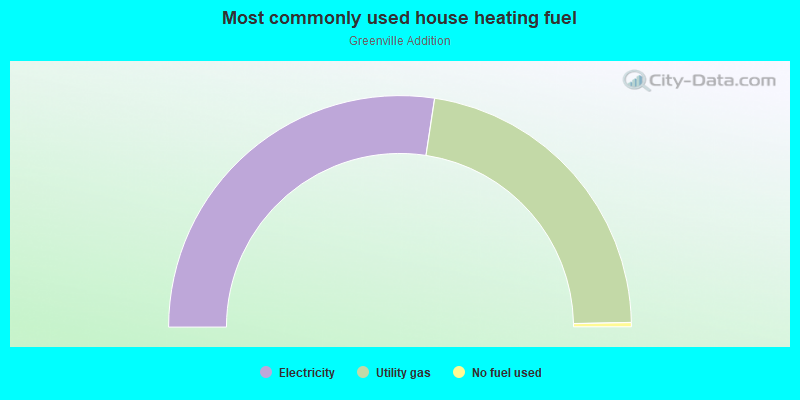
- 54.8%Electricity
- 44.6%Utility gas
- 0.6%No fuel used
Roads and streets:
N 40th St
Length: 0.55 miles
Direction: N-S
Address range: 600 to 1526
Direction: N-S
Address range: 600 to 1526
N 39th St
Length: 0.44 miles
Directions: E-W, N-S, SE-NW, SW-NE
Address range: 800 to 1499
Directions: E-W, N-S, SE-NW, SW-NE
Address range: 800 to 1499
Provost St
Length: 0.34 miles
Direction: E-W
Address range: 3900 to 4299
Direction: E-W
Address range: 3900 to 4299
Billops St
Length: 0.34 miles
Direction: E-W
Address range: 3900 to 4299
Direction: E-W
Address range: 3900 to 4299
Pitcher St
Length: 0.34 miles
Direction: E-W
Address range: 3900 to 4299
Direction: E-W
Address range: 3900 to 4299
Odell St
Length: 0.34 miles
Direction: E-W
Address range: 3900 to 4299
Direction: E-W
Address range: 3900 to 4299
Gus Young Ave
Length: 0.30 miles
Direction: E-W
Direction: E-W
N 42nd St
Length: 0.16 miles
Direction: N-S
Address range: 1200 to 1495
Direction: N-S
Address range: 1200 to 1495
N 43rd St
Length: 0.16 miles
Directions: N-S, SW-NE
Address range: 1200 to 1495
Directions: N-S, SW-NE
Address range: 1200 to 1495
Zion St
Length: 0.05 miles
Direction: E-W
Address range: 3900 to 3999
Direction: E-W
Address range: 3900 to 3999
Jonah St
Length: 0.05 miles
Direction: E-W
Address range: 3900 to 3999
Direction: E-W
Address range: 3900 to 3999
Other features:
Ward Crk
Length: 0.26 miles
Direction: N-S
Direction: N-S