Greektown neighborhood in Detroit, Michigan (MI), 48226 detailed profile
Settings
X

Business Search - 14 Million verified businesses
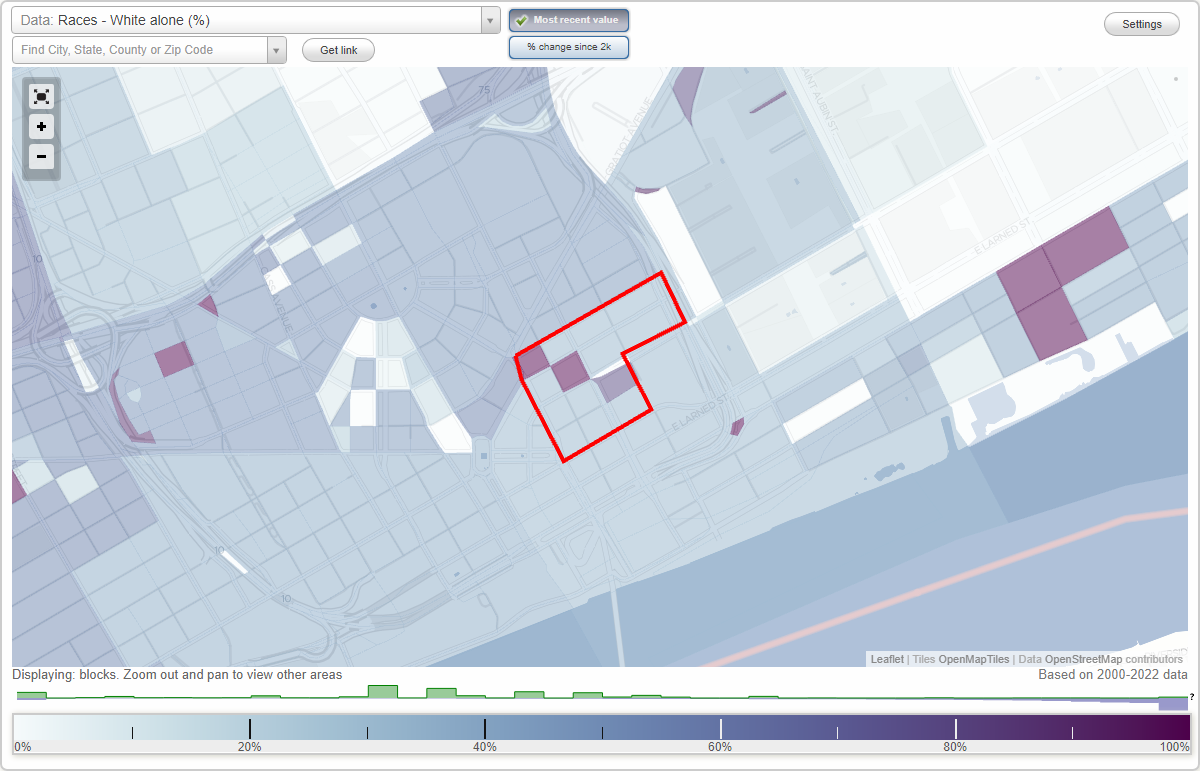
Area: 0.074 square miles
Population: 912
Population density:
| Greektown: | 12,356 people per square mile |
| Detroit: | 4,471 people per square mile |

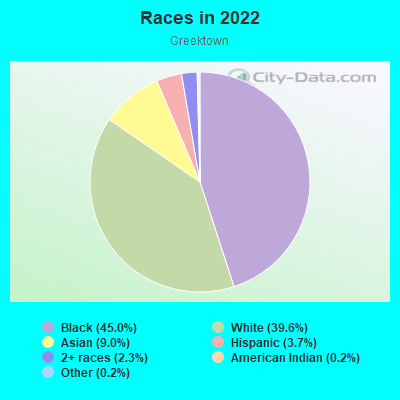
- 41145.0%Black
- 36239.6%White
- 829.0%Asian
- 343.7%Hispanic or Latino
- 212.3%Two or more races
- 20.2%American Indian
- 20.2%Some other race
Median household income in 2022:
| Greektown: | $67,685 |
| Detroit: | $36,453 |
Distribution of median household income
![Distribution of median household income]()
- 42Less than $10,000
- 35$10,000 to $19,999
- 55$20,000 to $29,999
- 34$30,000 to $39,999
- 85$40,000 to $49,999
- 69$50,000 to $59,999
- 87$60,000 to $74,999
- 127$75,000 to $99,999
- 68$100,000 to $124,999
- 50$125,000 to $149,999
- 23$150,000 to $199,999
- 42$200,000 or more

Distribution of owner-occupied house/condo value
![Distribution of owner-occupied house/condo value]()
- 29$50,000 to $99,999
- 5$100,000 to $149,999
- 34$150,000 to $199,999
- 2$250,000 to $299,999
- 4$300,000 to $399,999
- 3$400,000 to $499,999
- 2$500,000 to $749,999
- 5$750,000 to $999,999

Distribution of rent paid by renters
![Distribution of rent paid by renters]()
- 4$200 to $299
- 9$400 to $499
- 3$600 to $699
- 39$700 to $799
- 57$800 to $899
- 110$900 to $999
- 144$1,000 to $1,249
- 59$1,250 to $1,499
- 198$1,500 to $1,999
- 169$2,000 or more

Median rent in 2022:
| Greektown: | $1,246 |
| Detroit: | $735 |
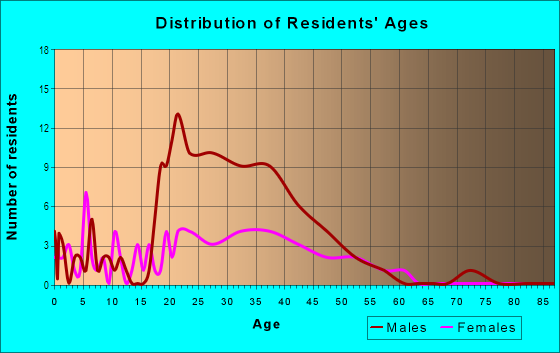
| Males: | 440 |
| Females: | 472 |
Males:
| This neighborhood: | 34.5 years |
| Whole city: | 33.9 years |
| This neighborhood: | 34.2 years |
| Whole city: | 37.0 years |
Average household size:
| Greektown: | 1.3 people |
| Detroit: | 2.5 people |
Percentage of family households:
| Greektown: | 9.7% |
| Detroit: | 37.4% |
| Here: | 8.4% |
| Detroit: | 17.7% |
Percentage of married-couple families with children (among all households):
| Greektown: | 25.5% |
| Detroit: | 12.9% |
Percentage of single-mother households (among all households):
| Greektown: | 64.1% |
| Detroit: | 22.7% |
Percentage of never married males 15 years old and over:
Percentage of never married females 15 years old and over:
| Greektown: | 36.9% |
| Detroit: | 28.3% |
Percentage of never married females 15 years old and over:
| Greektown: | 30.4% |
| city: | 30.2% |
Percentage of people that speak English not well or not at all:
| Greektown: | 5.6% |
| Detroit: | 2.8% |
Percentage of people born in this state:
Percentage of people born in another U.S. state:
Percentage of native residents but born outside the U.S.:
Percentage of foreign born residents:
| Here: | 70.7% |
| Detroit: | 77.9% |
Percentage of people born in another U.S. state:
| Greektown: | 21.0% |
| Detroit: | 15.0% |
Percentage of native residents but born outside the U.S.:
| Here: | 0.4% |
| city: | 1.0% |
Percentage of foreign born residents:
| Here: | 7.9% |
| Detroit: | 6.1% |
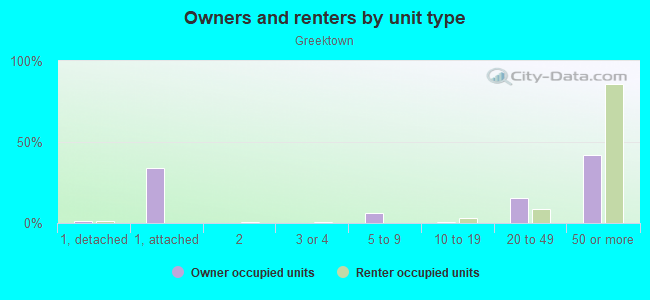
Owner-occupied
Renter-occupied

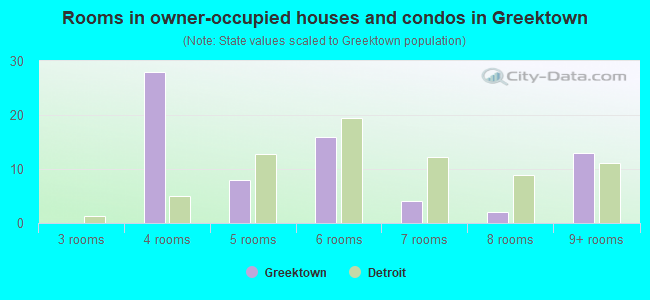
- Rooms in owner-occupied houses and condos in Greektown
- 01 room
- 02 rooms
- 03 rooms
- 284 rooms
- 85 rooms
- 166 rooms
- 47 rooms
- 28 rooms
- 139+ rooms
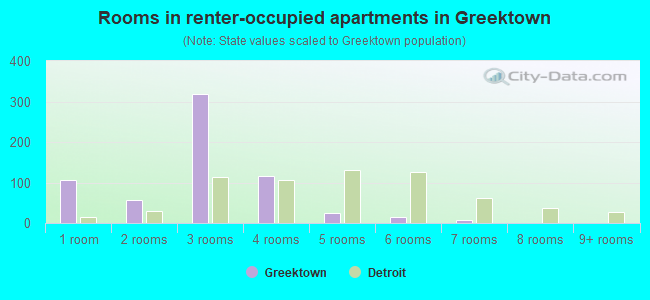
- Rooms in renter-occupied apartments in Greektown
- 1071 room
- 582 rooms
- 3193 rooms
- 1174 rooms
- 255 rooms
- 156 rooms
- 77 rooms
- 08 rooms
- 09+ rooms
Owner-occupied
Renter-occupied
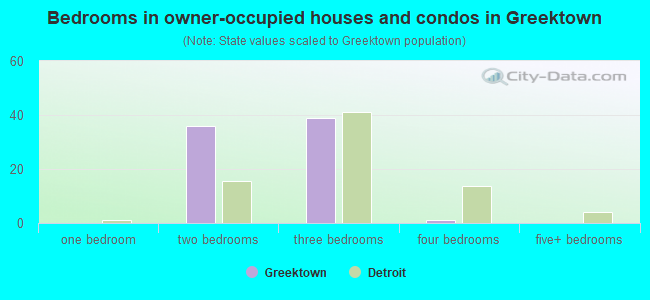
- Bedrooms in owner-occupied houses and condos in Greektown
- 0no bedroom
- 01 bedroom
- 362 bedrooms
- 393 bedrooms
- 14 bedrooms
- 05+ bedrooms
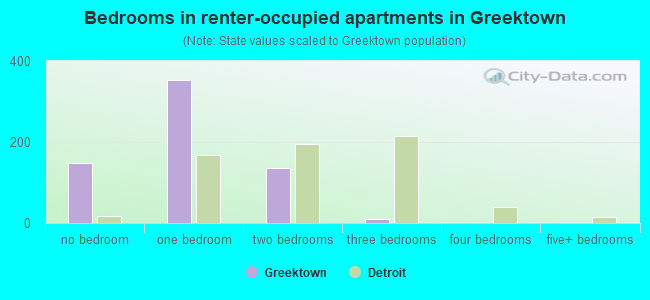
- Bedrooms in renter-occupied apartments in Greektown
- 149no bedroom
- 3531 bedroom
- 1362 bedrooms
- 113 bedrooms
- 04 bedrooms
- 05+ bedrooms
Average number of cars or other vehicles available in houses/condos:
Average number of cars or other vehicles available in apartments:
| This neighborhood: | |
| Detroit: |
Average number of cars or other vehicles available in apartments:
| Here: | 0.8 |
| city: | 0.9 |
Percentage of units with a mortgage:
| Greektown: | 17.5% |
| Detroit: | 34.2% |
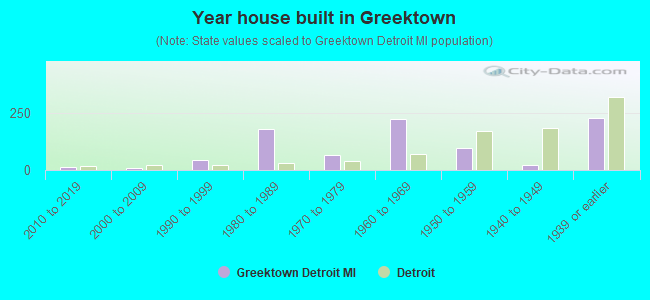
- Year house built in Greektown
- 02020 or later
- 112010 to 2019
- 72000 to 2009
- 441990 to 1999
- 1771980 to 1989
- 641970 to 1979
- 2221960 to 1969
- 971950 to 1959
- 201940 to 1949
- 2291939 or earlier
City-data.com crime index for city in 2020 (higher means more crime):
| City: | 796.8 |
| U.S. average: | 219.5 |
Travel time to work (commute)
![Travel time to work (commute)]()
- 8Less than 5 minutes
- 165 to 9 minutes
- 2710 to 14 minutes
- 1315 to 19 minutes
- 920 to 24 minutes
- 325 to 29 minutes
- 330 to 34 minutes
- 435 to 39 minutes
- 140 to 44 minutes
- 2045 to 59 minutes
- 260 to 89 minutes

Means of transportation to work
![Means of transportation to work]()
- 42.1%282Drove a car alone
- 2.8%19Carpooled
- 0.7%5Bus
- 2.1%14Subway or elevated rail
- 1.3%9Taxi
- 1.6%11Bicycle
- 29.4%197Walked
- 1.8%12Other means
- 22.2%149Worked at home

Time leaving home to go to work
![Time leaving home to go to work]()
- 15:00 a.m. to 5:29 a.m.
- 26:00 a.m. to 6:29 a.m.
- 36:30 a.m. to 6:59 a.m.
- 57:00 a.m. to 7:29 a.m.
- 107:30 a.m. to 7:59 a.m.
- 228:00 a.m. to 8:29 a.m.
- 78:30 a.m. to 8:59 a.m.
- 229:00 a.m. to 9:59 a.m.
- 110:00 a.m. to 10:59 a.m.
- 1611:00 a.m. to 11:59 a.m.
- 312:00 p.m. to 3:59 p.m.
- 44:00 p.m. to 11:59 p.m.

Occupations of males:
- Percentage of males in management occupations (except farmers):
Here: 12.7% city: 5.6%
- Percentage of males in business and financial operations occupations:
Here: 6.6% city: 3.1%
- Percentage of males in computer and mathematical occupations:
Here: 16.1% city: 2.3%
- Percentage of males in architecture and engineering occupations:
Here: 12.0% city: 2.3%
- Percentage of males in community and social services occupations:
Here: 1.5% city: 1.4%
- Percentage of males in legal occupations:
Here: 10.7% city: 0.6%
- Percentage of males in education, training, and library occupations:
Here: 3.8% city: 2.3%
- Percentage of males in arts, design, entertainment, sports, and media occupations:
Here: 3.6% city: 1.9%
- Percentage of males in healthcare practitioners and technical occupations:
Here: 5.0% city: 1.8%
- Percentage of males in service occupations:
Here: 4.7% city: 21.4%
- Percentage of males in sales and office occupations:
Here: 18.4% city: 11.8%
- Percentage of males in construction, extraction, and maintenance occupations:
Here: 19.1% city: 7.9%
- Percentage of males in production occupations:
Here: 9.6% city: 14.4%
- Percentage of males in transportation occupations:
Here: 1.7% city: 8.3%
- Percentage of males in material moving occupations:
Here: 1.3% city: 11.0%
Occupations of females:
- Percentage of females in management occupations (except farmers):
Here: 16.3% city: 6.9%
- Percentage of females in business and financial operations occupations:
Here: 9.8% city: 4.5%
- Percentage of females in architecture and engineering occupations:
Here: 3.0% city: 0.4%
- Percentage of females in life, physical, and social science occupations:
Here: 1.7% city: 0.6%
- Percentage of females in legal occupations:
Here: 4.1% city: 0.8%
- Percentage of females in education, training, and library occupations:
Here: 11.4% city: 6.0%
- Percentage of females in arts, design, entertainment, sports, and media occupations:
Here: 4.3% city: 1.2%
- Percentage of females in healthcare practitioners and technical occupations:
Here: 3.6% city: 6.4%
- Percentage of females in service occupations:
Here: 20.5% city: 27.1%
- Percentage of females in sales and office occupations:
Here: 12.7% city: 26.6%
- Percentage of females in production occupations:
Here: 12.4% city: 7.5%
- Percentage of females in transportation occupations:
Here: 2.3% city: 2.2%
- Percentage of females in material moving occupations:
Here: 1.5% city: 4.2%
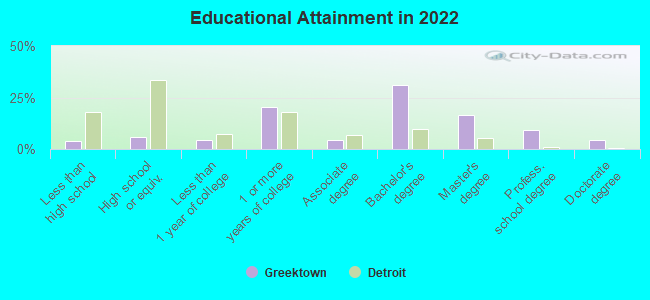
Education in this neighborhood (subdivision or community):
- Percentage of people 3 years and older in K-12 schools:
Greektown: 6.1% Detroit: 18.0%
- Percentage of people 3 years and older in undergraduate colleges:
Greektown: 3.3% Detroit: 3.8%
- Percentage of people 3 years and older in grad. or professional schools:
Greektown: 6.0% Detroit: 1.0%
- Percentage of students K-12 enrolled in private schools:
Greektown: 9.1% Detroit: 8.2%
Percentage of population below poverty level:
| Greektown: | 9.0% |
| Detroit: | 33.8% |
Median year renter moved in (as recorded in 2022):
| Greektown: | 2017 |
| Detroit: | 2019 |
Percentage of married-couple families with both working:
| Greektown: | 100.0% |
| Detroit: | 40.7% |
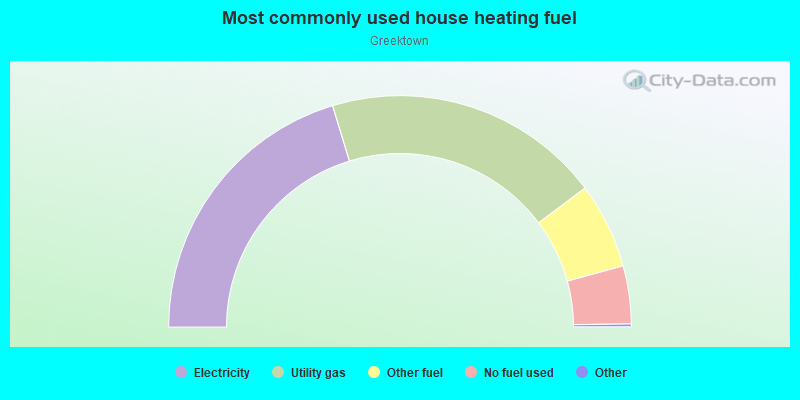
- 40.6%Electricity
- 38.9%Utility gas
- 12.0%Other fuel
- 8.1%No fuel used
Limited-access highways (interstate or state) in this neighborhood:
Walter P Chrysler Fwy (I- 375)
Length: 0.07 miles
Direction: SE-NW
Direction: SE-NW
Highways in this neighborhood:
State Hwy 3 (Randolph St)
Length: 0.22 miles
Directions: N-S, SE-NW
Address range: 700 to 1199
Directions: N-S, SE-NW
Address range: 700 to 1199
Roads and streets:
Monroe St
Length: 0.47 miles
Directions: E-W, SW-NE
Address range: 300 to 899
Directions: E-W, SW-NE
Address range: 300 to 899
Beaubien St
Length: 0.36 miles
Directions: E-W, N-S, SE-NW
Address range: 601 to 1199
Directions: E-W, N-S, SE-NW
Address range: 601 to 1199
Brush St
Length: 0.21 miles
Direction: SE-NW
Address range: 600 to 1199
Direction: SE-NW
Address range: 600 to 1199
Lafayette St E
Length: 0.19 miles
Directions: E-W, SW-NE
Address range: 300 to 499
Directions: E-W, SW-NE
Address range: 300 to 499
E Fort St
Length: 0.17 miles
Directions: E-W, SW-NE
Address range: 300 to 499
Directions: E-W, SW-NE
Address range: 300 to 499
Congress St
Length: 0.17 miles
Direction: SW-NE
Address range: 300 to 499
Direction: SW-NE
Address range: 300 to 499
Chrysler Expy
Length: 0.07 miles
Direction: SE-NW
Address range: 1001 to 1199
Direction: SE-NW
Address range: 1001 to 1199