Greektown neighborhood in Chicago, Illinois (IL), 60607, 60661 detailed profile
Settings
X


Business Search - 14 Million verified businesses
Area: 0.039 square miles
Population: 1,037
Population density:
| Greektown: | 26,279 people per square mile |
| Chicago: | 11,734 people per square mile |

- 46244.6%Asian
- 32631.5%White
- 16415.8%Hispanic or Latino
- 514.9%Two or more races
- 171.6%Black
- 151.4%Some other race

Median household income in 2022:
| Greektown: | $105,979 |
| Chicago: | $70,386 |
Distribution of median household income
![Distribution of median household income]()
- 50Less than $10,000
- 30$10,000 to $19,999
- 35$20,000 to $29,999
- 28$30,000 to $39,999
- 53$40,000 to $49,999
- 53$50,000 to $59,999
- 91$60,000 to $74,999
- 92$75,000 to $99,999
- 104$100,000 to $124,999
- 37$125,000 to $149,999
- 65$150,000 to $199,999
- 153$200,000 or more

Distribution of owner-occupied house/condo value
![Distribution of owner-occupied house/condo value]()
- 14$50,000 to $99,999
- 98$200,000 to $249,999
- 21$250,000 to $299,999
- 34$300,000 to $399,999
- 46$400,000 to $499,999
- 110$500,000 to $749,999
- 16$750,000 to $999,999
- 37$1,000,000 or more

Distribution of rent paid by renters
![Distribution of rent paid by renters]()
- 6Less than $100
- 12$200 to $299
- 12$600 to $699
- 39$1,000 to $1,249
- 12$1,250 to $1,499
- 252$1,500 to $1,999
- 226$2,000 or more

Median rent in 2022:
| Greektown: | $1,932 |
| Chicago: | $1,161 |
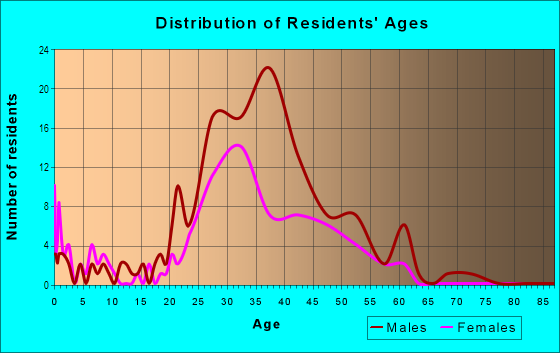
| Males: | 539 |
| Females: | 498 |
Males:
| This neighborhood: | 30.3 years |
| Whole city: | 35.3 years |
| This neighborhood: | 29.0 years |
| Whole city: | 36.2 years |
Average household size:
| Greektown: | 1.4 people |
| Chicago: | 2.3 people |
Percentage of family households:
| Greektown: | 22.7% |
| Chicago: | 36.7% |
| Here: | 15.2% |
| Chicago: | 30.4% |
Percentage of married-couple families with children (among all households):
| Greektown: | 70.5% |
| Chicago: | 24.1% |
Percentage of single-mother households (among all households):
| Greektown: | 13.3% |
| Chicago: | 16.0% |
Percentage of never married males 15 years old and over:
Percentage of never married females 15 years old and over:
| Greektown: | 35.6% |
| Chicago: | 24.5% |
Percentage of never married females 15 years old and over:
| Greektown: | 31.1% |
| city: | 24.9% |
Percentage of people that speak English not well or not at all:
| Greektown: | 1.2% |
| Chicago: | 7.1% |
Percentage of people born in this state:
Percentage of people born in another U.S. state:
Percentage of native residents but born outside the U.S.:
Percentage of foreign born residents:
| Here: | 30.5% |
| Chicago: | 58.6% |
Percentage of people born in another U.S. state:
| Greektown: | 40.9% |
| Chicago: | 18.8% |
Percentage of native residents but born outside the U.S.:
| Here: | 1.8% |
| city: | 2.1% |
Percentage of foreign born residents:
| Here: | 26.8% |
| Chicago: | 20.6% |

Owner-occupied
Renter-occupied


- Rooms in owner-occupied houses and condos in Greektown
- 151 room
- 232 rooms
- 1223 rooms
- 384 rooms
- 155 rooms
- 146 rooms
- 287 rooms
- 98 rooms
- 29+ rooms

- Rooms in renter-occupied apartments in Greektown
- 1201 room
- 2172 rooms
- 1023 rooms
- 854 rooms
- 75 rooms
- 76 rooms
- 117 rooms
- 08 rooms
- 69+ rooms
Owner-occupied
Renter-occupied

- Bedrooms in owner-occupied houses and condos in Greektown
- 15no bedroom
- 1151 bedroom
- 462 bedrooms
- 283 bedrooms
- 184 bedrooms
- 05+ bedrooms

- Bedrooms in renter-occupied apartments in Greektown
- 185no bedroom
- 3281 bedroom
- 122 bedrooms
- 73 bedrooms
- 64 bedrooms
- 65+ bedrooms
Average number of cars or other vehicles available in houses/condos:
Average number of cars or other vehicles available in apartments:
| This neighborhood: | 0.5 |
| Chicago: | 1.5 |
Average number of cars or other vehicles available in apartments:
| Here: | 0.3 |
| city: | 0.8 |
Percentage of units with a mortgage:
| Greektown: | 83.6% |
| Chicago: | 64.7% |

- Year house built in Greektown
- 232020 or later
- 1112010 to 2019
- 2262000 to 2009
- 101990 to 1999
- 3041980 to 1989
- 31970 to 1979
- 471960 to 1969
- 81950 to 1959
- 231940 to 1949
- 851939 or earlier

City-data.com crime index for city in 2020 (higher means more crime):
| City: | 421.1 |
| U.S. average: | 219.5 |
Travel time to work (commute)
![Travel time to work (commute)]()
- 8Less than 5 minutes
- 895 to 9 minutes
- 17610 to 14 minutes
- 24115 to 19 minutes
- 12420 to 24 minutes
- 6625 to 29 minutes
- 10630 to 34 minutes
- 335 to 39 minutes
- 6240 to 44 minutes
- 3645 to 59 minutes
- 9760 to 89 minutes
- 2490 or more minutes

Means of transportation to work
![Means of transportation to work]()
- 12.7%109Drove a car alone
- 4.5%39Carpooled
- 25.0%215Bus
- 16.4%141Subway or elevated rail
- 3.4%29Long-distance train or commuter rail
- 2.6%22Taxi
- 1.3%11Bicycle
- 22.4%193Walked
- 2.4%21Other means
- 36.1%311Worked at home

Time leaving home to go to work
![Time leaving home to go to work]()
- 35:00 a.m. to 5:29 a.m.
- 215:30 a.m. to 5:59 a.m.
- 856:00 a.m. to 6:29 a.m.
- 1326:30 a.m. to 6:59 a.m.
- 1717:00 a.m. to 7:29 a.m.
- 1357:30 a.m. to 7:59 a.m.
- 1878:00 a.m. to 8:29 a.m.
- 2208:30 a.m. to 8:59 a.m.
- 719:00 a.m. to 9:59 a.m.
- 610:00 a.m. to 10:59 a.m.
- 1112:00 p.m. to 3:59 p.m.
- 274:00 p.m. to 11:59 p.m.

Occupations of males:
- Percentage of males in management occupations (except farmers):
Here: 11.7% city: 12.0%
- Percentage of males in business and financial operations occupations:
Here: 20.6% city: 7.9%
- Percentage of males in computer and mathematical occupations:
Here: 24.5% city: 6.3%
- Percentage of males in architecture and engineering occupations:
Here: 1.8% city: 2.4%
- Percentage of males in life, physical, and social science occupations:
Here: 3.8% city: 1.1%
- Percentage of males in community and social services occupations:
Here: 2.5% city: 1.2%
- Percentage of males in legal occupations:
Here: 3.1% city: 2.1%
- Percentage of males in education, training, and library occupations:
Here: 3.6% city: 4.2%
- Percentage of males in healthcare practitioners and technical occupations:
Here: 9.9% city: 3.1%
- Percentage of males in service occupations:
Here: 13.7% city: 15.8%
- Percentage of males in sales and office occupations:
Here: 10.3% city: 14.5%
Occupations of females:
- Percentage of females in management occupations (except farmers):
Here: 11.2% city: 11.1%
- Percentage of females in business and financial operations occupations:
Here: 16.3% city: 9.2%
- Percentage of females in computer and mathematical occupations:
Here: 30.3% city: 2.3%
- Percentage of females in architecture and engineering occupations:
Here: 5.5% city: 0.8%
- Percentage of females in education, training, and library occupations:
Here: 13.9% city: 8.8%
- Percentage of females in arts, design, entertainment, sports, and media occupations:
Here: 6.7% city: 3.1%
- Percentage of females in healthcare practitioners and technical occupations:
Here: 6.2% city: 8.5%
- Percentage of females in sales and office occupations:
Here: 6.3% city: 23.3%
- Percentage of females in production occupations:
Here: 3.2% city: 3.0%
Percentage of people 16-64 in Armed Forces:
| Greektown: | 0.0% |
| Chicago: | 0.1% |
Education in this neighborhood (subdivision or community):
- Percentage of people 3 years and older in K-12 schools:
Greektown: 5.1% Chicago: 14.6%
- Percentage of people 3 years and older in undergraduate colleges:
Greektown: 4.4% Chicago: 5.1%
- Percentage of people 3 years and older in grad. or professional schools:
Greektown: 15.5% Chicago: 2.6%
- Percentage of students K-12 enrolled in private schools:
Greektown: 81.1% Chicago: 15.6%
Percentage of population below poverty level:
| Greektown: | 5.4% |
| Chicago: | 17.2% |
Median year owner moved in (as recorded in 2022):
Median year renter moved in (as recorded in 2022):
| Greektown: | 2016 |
| Chicago: | 2010 |
Median year renter moved in (as recorded in 2022):
| Greektown: | 2019 |
| Chicago: | 2020 |
Percentage of married-couple families with both working:
| Greektown: | 69.1% |
| Chicago: | 69.2% |

- 51.1%Electricity
- 39.8%Utility gas
- 5.6%Bottled, tank, or LP gas
- 3.5%No fuel used
Roads and streets:
S Halsted St
Length: 0.35 miles
Direction: N-S
Address range: 1 to 399
Direction: N-S
Address range: 1 to 399
Academy Pl
Length: 0.09 miles
Direction: N-S
Address range: 1 to 41
Direction: N-S
Address range: 1 to 41
W Adams St
Length: 0.07 miles
Direction: E-W
Address range: 784 to 799
Direction: E-W
Address range: 784 to 799
W Quincy St
Length: 0.06 miles
Direction: E-W
Address range: 742 to 799
Direction: E-W
Address range: 742 to 799
W Gladys Ave
Length: 0.06 miles
Direction: E-W
Address range: 742 to 799
Direction: E-W
Address range: 742 to 799
Halsted St
Length: 0.05 miles
Direction: N-S
Direction: N-S
W Van Buren St
Length: 0.05 miles
Direction: E-W
Address range: 777 to 799
Direction: E-W
Address range: 777 to 799
W Jackson Blvd
Length: 0.04 miles
Direction: E-W
Address range: 770 to 799
Direction: E-W
Address range: 770 to 799
W Madison St
Length: 0.04 miles
Direction: E-W
Address range: 800 to 813
Direction: E-W
Address range: 800 to 813
W Monroe St
Length: 0.04 miles
Direction: E-W
Address range: 800 to 815
Direction: E-W
Address range: 800 to 815