Elizabeth Park neighborhood in Norfolk, Virginia (VA), 23502 detailed profile
Settings
X


Business Search - 14 Million verified businesses
Area: 0.196 square miles
Population: 398
Population density:
| Elizabeth Park: | 2,031 people per square mile |
| Norfolk: | 4,337 people per square mile |

- 18847.5%White
- 17844.9%Black
- 215.3%Asian
- 51.3%Hispanic or Latino
- 41.0%Two or more races

Median household income in 2022:
| Elizabeth Park: | $93,754 |
| Norfolk: | $61,090 |
Distribution of median household income
![Distribution of median household income]()
- 5Less than $10,000
- 12$10,000 to $19,999
- 22$20,000 to $29,999
- 10$30,000 to $39,999
- 7$40,000 to $49,999
- 14$50,000 to $59,999
- 10$60,000 to $74,999
- 17$75,000 to $99,999
- 26$100,000 to $124,999
- 26$125,000 to $149,999
- 12$150,000 to $199,999
- 27$200,000 or more

Distribution of owner-occupied house/condo value
![Distribution of owner-occupied house/condo value]()
- 6Less than $50,000
- 20$100,000 to $149,999
- 23$150,000 to $199,999
- 31$200,000 to $249,999
- 33$250,000 to $299,999
- 9$300,000 to $399,999
- 31$400,000 to $499,999
- 3$500,000 to $749,999
- 3$750,000 to $999,999
- 7$1,000,000 or more

Distribution of rent paid by renters
![Distribution of rent paid by renters]()
- 3Less than $100
- 3$100 to $199
- 3$400 to $499
- 12$800 to $899
- 5$900 to $999
- 12$1,000 to $1,249
- 32$1,250 to $1,499
- 11$1,500 to $1,999
- 6$2,000 or more

Median rent in 2022:
| Elizabeth Park: | $1,083 |
| Norfolk: | $1,035 |
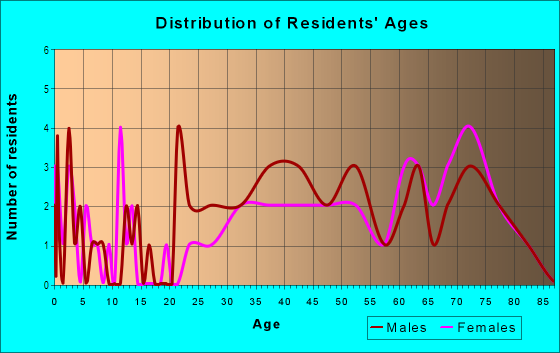
| Males: | 224 |
| Females: | 173 |
Males:
| This neighborhood: | 43.2 years |
| Whole city: | 31.3 years |
| This neighborhood: | 43.9 years |
| Whole city: | 34.4 years |
Average household size:
| Elizabeth Park: | 2.4 people |
| Norfolk: | 2.3 people |
Percentage of family households:
| Elizabeth Park: | 38.5% |
| Norfolk: | 41.3% |
| Here: | 47.8% |
| Norfolk: | 31.7% |
Percentage of married-couple families with children (among all households):
| Elizabeth Park: | 19.0% |
| Norfolk: | 20.2% |
Percentage of single-mother households (among all households):
| Elizabeth Park: | 15.6% |
| Norfolk: | 16.3% |
Percentage of never married males 15 years old and over:
Percentage of never married females 15 years old and over:
| Elizabeth Park: | 20.6% |
| Norfolk: | 25.4% |
Percentage of never married females 15 years old and over:
| Elizabeth Park: | 6.6% |
| city: | 20.5% |
Percentage of people that speak English not well or not at all:
| Elizabeth Park: | 0.0% |
| Norfolk: | 1.4% |
Percentage of people born in this state:
Percentage of people born in another U.S. state:
Percentage of native residents but born outside the U.S.:
Percentage of foreign born residents:
| Here: | 47.5% |
| Norfolk: | 51.1% |
Percentage of people born in another U.S. state:
| Elizabeth Park: | 40.1% |
| Norfolk: | 40.8% |
Percentage of native residents but born outside the U.S.:
| Here: | 3.0% |
| city: | 1.6% |
Percentage of foreign born residents:
| Here: | 9.4% |
| Norfolk: | 6.5% |

Owner-occupied
Renter-occupied


- Rooms in owner-occupied houses and condos in Elizabeth Park
- 01 room
- 02 rooms
- 13 rooms
- 234 rooms
- 15 rooms
- 186 rooms
- 377 rooms
- 328 rooms
- 349+ rooms

- Rooms in renter-occupied apartments in Elizabeth Park
- 01 room
- 22 rooms
- 63 rooms
- 154 rooms
- 105 rooms
- 36 rooms
- 127 rooms
- 98 rooms
- 59+ rooms
Owner-occupied
Renter-occupied

- Bedrooms in owner-occupied houses and condos in Elizabeth Park
- 0no bedroom
- 01 bedroom
- 12 bedrooms
- 603 bedrooms
- 554 bedrooms
- 95+ bedrooms

- Bedrooms in renter-occupied apartments in Elizabeth Park
- 0no bedroom
- 131 bedroom
- 112 bedrooms
- 153 bedrooms
- 34 bedrooms
- 65+ bedrooms
Average number of cars or other vehicles available in houses/condos:
Average number of cars or other vehicles available in apartments:
| This neighborhood: | 2.6 |
| Norfolk: | 2.0 |
Average number of cars or other vehicles available in apartments:
| Here: | 1.0 |
| city: | 1.3 |
Percentage of units with a mortgage:
| Elizabeth Park: | 72.0% |
| Norfolk: | 70.0% |
Average estimated value of detached houses in 2022 (85.9% of all units):
| Elizabeth Park: | $344,525 |
| Norfolk: | $337,508 |

- Year house built in Elizabeth Park
- 102020 or later
- 42010 to 2019
- 52000 to 2009
- 151990 to 1999
- 151980 to 1989
- 51970 to 1979
- 451960 to 1969
- 831950 to 1959
- 71940 to 1949
- 21939 or earlier

City-data.com crime index for city in 2020 (higher means more crime):
| City: | 327.9 |
| U.S. average: | 219.5 |
Travel time to work (commute)
![Travel time to work (commute)]()
- 4Less than 5 minutes
- 115 to 9 minutes
- 3310 to 14 minutes
- 3915 to 19 minutes
- 4320 to 24 minutes
- 3425 to 29 minutes
- 1430 to 34 minutes
- 135 to 39 minutes
- 440 to 44 minutes
- 145 to 59 minutes
- 660 to 89 minutes
- 690 or more minutes

Means of transportation to work
![Means of transportation to work]()
- 79.5%191Drove a car alone
- 3.7%9Carpooled
- 2.5%6Bus
- 2.5%6Light rail, streetcar or trolley
- 2.5%6Walked
- 17.5%42Worked at home

Time leaving home to go to work
![Time leaving home to go to work]()
- 512:00 a.m. to 4:59 a.m.
- 15:00 a.m. to 5:29 a.m.
- 75:30 a.m. to 5:59 a.m.
- 206:00 a.m. to 6:29 a.m.
- 156:30 a.m. to 6:59 a.m.
- 467:00 a.m. to 7:29 a.m.
- 167:30 a.m. to 7:59 a.m.
- 198:00 a.m. to 8:29 a.m.
- 38:30 a.m. to 8:59 a.m.
- 159:00 a.m. to 9:59 a.m.
- 1110:00 a.m. to 10:59 a.m.
- 1912:00 p.m. to 3:59 p.m.
- 104:00 p.m. to 11:59 p.m.

Occupations of males:
- Percentage of males in management occupations (except farmers):
Here: 9.5% city: 8.2%
- Percentage of males in business and financial operations occupations:
Here: 5.7% city: 4.4%
- Percentage of males in computer and mathematical occupations:
Here: 10.9% city: 4.2%
- Percentage of males in architecture and engineering occupations:
Here: 2.9% city: 3.7%
- Percentage of males in life, physical, and social science occupations:
Here: 1.7% city: 1.2%
- Percentage of males in education, training, and library occupations:
Here: 2.5% city: 3.9%
- Percentage of males in arts, design, entertainment, sports, and media occupations:
Here: 3.2% city: 2.2%
- Percentage of males in healthcare practitioners and technical occupations:
Here: 2.3% city: 3.2%
- Percentage of males in service occupations:
Here: 22.8% city: 16.9%
- Percentage of males in sales and office occupations:
Here: 14.6% city: 15.6%
- Percentage of males in construction, extraction, and maintenance occupations:
Here: 6.7% city: 9.8%
- Percentage of males in production occupations:
Here: 1.3% city: 6.5%
- Percentage of males in transportation occupations:
Here: 4.0% city: 5.3%
- Percentage of males in material moving occupations:
Here: 12.0% city: 5.3%
Occupations of females:
- Percentage of females in management occupations (except farmers):
Here: 6.7% city: 7.7%
- Percentage of females in business and financial operations occupations:
Here: 9.7% city: 5.2%
- Percentage of females in computer and mathematical occupations:
Here: 1.7% city: 1.7%
- Percentage of females in education, training, and library occupations:
Here: 23.4% city: 9.1%
- Percentage of females in arts, design, entertainment, sports, and media occupations:
Here: 2.5% city: 1.3%
- Percentage of females in healthcare practitioners and technical occupations:
Here: 12.7% city: 9.6%
- Percentage of females in service occupations:
Here: 12.4% city: 22.3%
- Percentage of females in sales and office occupations:
Here: 19.6% city: 28.7%
- Percentage of females in production occupations:
Here: 6.7% city: 2.7%
- Percentage of females in transportation occupations:
Here: 4.4% city: 1.6%
- Percentage of females in material moving occupations:
Here: 4.6% city: 2.4%
Percentage of people 16-64 in Armed Forces:
| Elizabeth Park: | 8.6% |
| Norfolk: | 15.8% |
Education in this neighborhood (subdivision or community):
- Percentage of people 3 years and older in K-12 schools:
Elizabeth Park: 15.9% Norfolk: 14.3%
- Percentage of people 3 years and older in undergraduate colleges:
Elizabeth Park: 7.3% Norfolk: 8.0%
- Percentage of people 3 years and older in grad. or professional schools:
Elizabeth Park: 3.3% Norfolk: 2.1%
- Percentage of students K-12 enrolled in private schools:
Elizabeth Park: 42.9% Norfolk: 16.2%
Percentage of population below poverty level:
| Elizabeth Park: | 9.0% |
| Norfolk: | 17.7% |
Median year owner moved in (as recorded in 2022):
Median year renter moved in (as recorded in 2022):
| Elizabeth Park: | 2008 |
| Norfolk: | 2013 |
Median year renter moved in (as recorded in 2022):
| Elizabeth Park: | 2017 |
| Norfolk: | 2020 |
Percentage of married-couple families with both working:
| Elizabeth Park: | 98.1% |
| Norfolk: | 65.5% |

- 45.3%Utility gas
- 32.2%Electricity
- 14.0%Solar energy
- 3.1%Bottled, tank, or LP gas
- 2.9%Fuel oil, kerosene, etc.
- 1.4%Wood
- 1.1%Other fuel
Roads and streets:
Curlew Dr
Length: 1.00 miles
Directions: E-W, N-S, SE-NW, SW-NE
Address range: 5200 to 5499
Directions: E-W, N-S, SE-NW, SW-NE
Address range: 5200 to 5499
Orion Ave
Length: 0.55 miles
Directions: E-W, N-S, SE-NW
Address range: 5300 to 5499
Directions: E-W, N-S, SE-NW
Address range: 5300 to 5499
Pine Grove Ave
Length: 0.39 miles
Directions: E-W, N-S, SE-NW
Address range: 5300 to 5499
Directions: E-W, N-S, SE-NW
Address range: 5300 to 5499
Riverwood Rd
Length: 0.39 miles
Directions: E-W, N-S, SE-NW, SW-NE
Address range: 5200 to 5299
Directions: E-W, N-S, SE-NW, SW-NE
Address range: 5200 to 5299
Huntsman Rd
Length: 0.30 miles
Directions: N-S, SW-NE
Address range: 100 to 299
Directions: N-S, SW-NE
Address range: 100 to 299
Revere Dr
Length: 0.23 miles
Directions: E-W, SE-NW
Address range: 5200 to 5299
Directions: E-W, SE-NW
Address range: 5200 to 5299
Welaka Rd
Length: 0.21 miles
Direction: E-W
Address range: 5400 to 5499
Direction: E-W
Address range: 5400 to 5499
Corporate Blvd
Length: 0.19 miles
Directions: N-S, SE-NW
Address range: 100 to 207
Directions: N-S, SE-NW
Address range: 100 to 207
Kimberly Ln
Length: 0.17 miles
Directions: N-S, SE-NW, SW-NE
Address range: 100 to 199
Directions: N-S, SE-NW, SW-NE
Address range: 100 to 199
Lucian Ct
Length: 0.11 miles
Directions: E-W, N-S, SE-NW
Address range: 200 to 299
Directions: E-W, N-S, SE-NW
Address range: 200 to 299
Valleau Rd
Length: 0.11 miles
Directions: N-S, SW-NE
Address range: 200 to 299
Directions: N-S, SW-NE
Address range: 200 to 299
Betty Ct
Length: 0.06 miles
Directions: N-S, SW-NE
Address range: 200 to 299
Directions: N-S, SW-NE
Address range: 200 to 299
Railroad features:
Norfolk Southern Rlwy
Length: 0.24 miles
Direction: E-W
Direction: E-W