El Toro neighborhood in Lake Forest, California (CA), 92630 detailed profile
Settings
X


Business Search - 14 Million verified businesses
Area: 0.095 square miles
Population: 987
Population density:
| El Toro: | 10,411 people per square mile |
| Lake Forest: | 6,854 people per square mile |

- 39739.1%White
- 38738.1%Hispanic or Latino
- 16316.0%Asian
- 242.4%Two or more races
- 202.0%Some other race
- 151.5%Black
- 70.7%American Indian
- 30.3%Native Hawaiian and Other
Pacific Islander

Distribution of median household income
![Distribution of median household income]()
- 5Less than $10,000
- 8$10,000 to $19,999
- 7$20,000 to $29,999
- 9$30,000 to $39,999
- 53$40,000 to $49,999
- 30$50,000 to $59,999
- 16$60,000 to $74,999
- 32$75,000 to $99,999
- 29$100,000 to $124,999
- 68$125,000 to $149,999
- 35$150,000 to $199,999
- 40$200,000 or more

Distribution of owner-occupied house/condo value
![Distribution of owner-occupied house/condo value]()
- 7Less than $50,000
- 37$50,000 to $99,999
- 30$100,000 to $149,999
- 12$150,000 to $199,999
- 7$200,000 to $249,999
- 5$250,000 to $299,999
- 19$300,000 to $399,999
- 46$400,000 to $499,999
- 53$500,000 to $749,999
- 130$750,000 to $999,999
- 32$1,000,000 or more

Distribution of rent paid by renters
![Distribution of rent paid by renters]()
- 6$600 to $699
- 31$700 to $799
- 2$900 to $999
- 10$1,000 to $1,249
- 13$1,250 to $1,499
- 27$1,500 to $1,999
- 116$2,000 or more

Median rent in 2022:
| El Toro: | $2,544 |
| Lake Forest: | $2,001 |
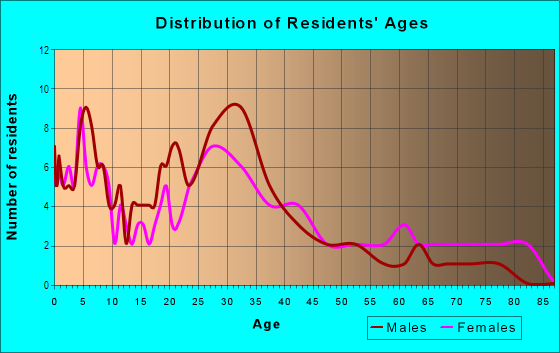
| Males: | 490 |
| Females: | 497 |
Males:
| This neighborhood: | 38.8 years |
| Whole city: | 38.6 years |
| This neighborhood: | 35.3 years |
| Whole city: | 42.8 years |
Average household size:
| El Toro: | 3.2 people |
| Lake Forest: | 2.7 people |
Percentage of family households:
| El Toro: | 56.2% |
| Lake Forest: | 46.6% |
| Here: | 54.7% |
| Lake Forest: | 57.3% |
Percentage of married-couple families with children (among all households):
| El Toro: | 24.6% |
| Lake Forest: | 32.9% |
Percentage of single-mother households (among all households):
| El Toro: | 6.7% |
| Lake Forest: | 3.5% |
Percentage of never married males 15 years old and over:
Percentage of never married females 15 years old and over:
| El Toro: | 23.4% |
| Lake Forest: | 16.3% |
Percentage of never married females 15 years old and over:
| El Toro: | 18.6% |
| city: | 13.9% |
Percentage of people that speak English not well or not at all:
| El Toro: | 11.1% |
| Lake Forest: | 5.2% |
Percentage of people born in this state:
Percentage of people born in another U.S. state:
Percentage of native residents but born outside the U.S.:
Percentage of foreign born residents:
| Here: | 53.5% |
| Lake Forest: | 53.6% |
Percentage of people born in another U.S. state:
| El Toro: | 15.6% |
| Lake Forest: | 15.5% |
Percentage of native residents but born outside the U.S.:
| Here: | 1.5% |
| city: | 1.5% |
Percentage of foreign born residents:
| Here: | 29.4% |
| Lake Forest: | 29.4% |

Owner-occupied
Renter-occupied


- Rooms in owner-occupied houses and condos in El Toro
- 21 room
- 12 rooms
- 83 rooms
- 224 rooms
- 675 rooms
- 506 rooms
- 677 rooms
- 128 rooms
- 389+ rooms

- Rooms in renter-occupied apartments in El Toro
- 491 room
- 152 rooms
- 403 rooms
- 264 rooms
- 245 rooms
- 316 rooms
- 187 rooms
- 48 rooms
- 19+ rooms
Owner-occupied
Renter-occupied

- Bedrooms in owner-occupied houses and condos in El Toro
- 2no bedroom
- 91 bedroom
- 402 bedrooms
- 963 bedrooms
- 1004 bedrooms
- 275+ bedrooms

- Bedrooms in renter-occupied apartments in El Toro
- 49no bedroom
- 861 bedroom
- 362 bedrooms
- 503 bedrooms
- 274 bedrooms
- 35+ bedrooms
Average number of cars or other vehicles available in houses/condos:
Average number of cars or other vehicles available in apartments:
| This neighborhood: | 2.3 |
| Lake Forest: | 2.2 |
Average number of cars or other vehicles available in apartments:
| Here: | 2.8 |
| city: | 1.8 |
Percentage of units with a mortgage:
| El Toro: | 75.1% |
| Lake Forest: | 75.4% |
Housing prices:
- Average estimated value of detached houses in 2022 (53.7% of all units):
El Toro: $966,763 Lake Forest: $1,141,582
- Average estimated value of mobile home in 2022 (27.9% of all units):
El Toro: $163,178 Lake Forest: $112,596

- Year house built in El Toro
- 02020 or later
- 172010 to 2019
- 92000 to 2009
- 101990 to 1999
- 281980 to 1989
- 1331970 to 1979
- 1181960 to 1969
- 31950 to 1959
- 31940 to 1949
- 01939 or earlier

City-data.com crime index for city in 2020 (higher means more crime):
| City: | 85.7 |
| U.S. average: | 219.5 |
Travel time to work (commute)
![Travel time to work (commute)]()
- 9Less than 5 minutes
- 435 to 9 minutes
- 9710 to 14 minutes
- 7315 to 19 minutes
- 8220 to 24 minutes
- 3525 to 29 minutes
- 5730 to 34 minutes
- 1035 to 39 minutes
- 2640 to 44 minutes
- 945 to 59 minutes
- 2560 to 89 minutes
- 590 or more minutes

Means of transportation to work
![Means of transportation to work]()
- 77.4%429Drove a car alone
- 7.9%44Carpooled
- 3.6%20Bus
- 0.4%2Subway or elevated rail
- 1.3%7Bicycle
- 2.3%13Walked
- 0.7%4Other means
- 9.9%55Worked at home

Time leaving home to go to work
![Time leaving home to go to work]()
- 1412:00 a.m. to 4:59 a.m.
- 205:00 a.m. to 5:29 a.m.
- 285:30 a.m. to 5:59 a.m.
- 456:00 a.m. to 6:29 a.m.
- 436:30 a.m. to 6:59 a.m.
- 667:00 a.m. to 7:29 a.m.
- 677:30 a.m. to 7:59 a.m.
- 368:00 a.m. to 8:29 a.m.
- 328:30 a.m. to 8:59 a.m.
- 639:00 a.m. to 9:59 a.m.
- 1710:00 a.m. to 10:59 a.m.
- 911:00 a.m. to 11:59 a.m.
- 4112:00 p.m. to 3:59 p.m.
- 294:00 p.m. to 11:59 p.m.

Occupations of males:
- Percentage of males in management occupations (except farmers):
Here: 13.2% city: 17.7%
- Percentage of males in business and financial operations occupations:
Here: 10.2% city: 8.1%
- Percentage of males in computer and mathematical occupations:
Here: 3.6% city: 8.8%
- Percentage of males in architecture and engineering occupations:
Here: 4.9% city: 6.9%
- Percentage of males in healthcare practitioners and technical occupations:
Here: 1.3% city: 2.1%
- Percentage of males in service occupations:
Here: 11.8% city: 12.6%
- Percentage of males in sales and office occupations:
Here: 7.8% city: 16.6%
- Percentage of males in farming, fishing, and forestry occupations:
Here: 2.7% city: 0.2%
- Percentage of males in construction, extraction, and maintenance occupations:
Here: 15.0% city: 4.3%
- Percentage of males in production occupations:
Here: 14.4% city: 3.9%
- Percentage of males in transportation occupations:
Here: 2.8% city: 4.4%
- Percentage of males in material moving occupations:
Here: 2.4% city: 3.1%
Occupations of females:
- Percentage of females in management occupations (except farmers):
Here: 8.0% city: 15.3%
- Percentage of females in business and financial operations occupations:
Here: 1.7% city: 11.0%
- Percentage of females in computer and mathematical occupations:
Here: 5.7% city: 1.9%
- Percentage of females in architecture and engineering occupations:
Here: 4.3% city: 1.3%
- Percentage of females in community and social services occupations:
Here: 2.2% city: 3.0%
- Percentage of females in education, training, and library occupations:
Here: 5.8% city: 6.9%
- Percentage of females in healthcare practitioners and technical occupations:
Here: 5.3% city: 6.7%
- Percentage of females in service occupations:
Here: 30.5% city: 17.1%
- Percentage of females in sales and office occupations:
Here: 22.1% city: 27.1%
- Percentage of females in production occupations:
Here: 5.5% city: 1.6%
- Percentage of females in material moving occupations:
Here: 8.3% city: 2.0%
Percentage of people 16-64 in Armed Forces:
| El Toro: | 0.3% |
| Lake Forest: | 0.1% |
Education in this neighborhood (subdivision or community):
- Percentage of people 3 years and older in K-12 schools:
El Toro: 14.9% Lake Forest: 14.5%
- Percentage of people 3 years and older in undergraduate colleges:
El Toro: 10.1% Lake Forest: 7.6%
- Percentage of people 3 years and older in grad. or professional schools:
El Toro: 4.2% Lake Forest: 1.2%
- Percentage of students K-12 enrolled in private schools:
El Toro: 41.6% Lake Forest: 10.9%
Percentage of population below poverty level:
| El Toro: | 11.8% |
| Lake Forest: | 8.5% |
Median year owner moved in (as recorded in 2022):
Median year renter moved in (as recorded in 2022):
| El Toro: | 2012 |
| Lake Forest: | 2011 |
Median year renter moved in (as recorded in 2022):
| El Toro: | 2014 |
| Lake Forest: | 2019 |
Percentage of married-couple families with both working:
| El Toro: | 54.0% |
| Lake Forest: | 65.9% |

- 72.0%Utility gas
- 20.8%Electricity
- 2.4%Other fuel
- 1.8%Bottled, tank, or LP gas
- 1.8%No fuel used
- 1.2%Solar energy
Roads and streets:
Front St
Length: 0.26 miles
Directions: E-W, N-S, SE-NW, SW-NE
Address range: 25001 to 25299
Directions: E-W, N-S, SE-NW, SW-NE
Address range: 25001 to 25299
Orange Ave
Length: 0.21 miles
Direction: SW-NE
Address range: 23104 to 23299
Direction: SW-NE
Address range: 23104 to 23299
Cherry Ave
Length: 0.21 miles
Direction: SW-NE
Address range: 23150 to 23398
Direction: SW-NE
Address range: 23150 to 23398
Olive Ave
Length: 0.18 miles
Directions: N-S, SW-NE
Address range: 23100 to 25299
Directions: N-S, SW-NE
Address range: 23100 to 25299
Whisler Dr
Length: 0.08 miles
Direction: SE-NW
Address range: 23285 to 25099
Direction: SE-NW
Address range: 23285 to 25099
Railroad features:
at and Sf Rlwy
Length: 0.13 miles
Direction: SE-NW
Direction: SE-NW