East Lower Mills (Cedar Grove) neighborhood in Boston, Massachusetts (MA), 02124 detailed profile
Settings
X


Business Search - 14 Million verified businesses
Area: 0.763 square miles
Population: 5,155
Population density:
| East Lower Mills (Cedar Grove): | 6,754 people per square mile |
| Boston: | 13,418 people per square mile |

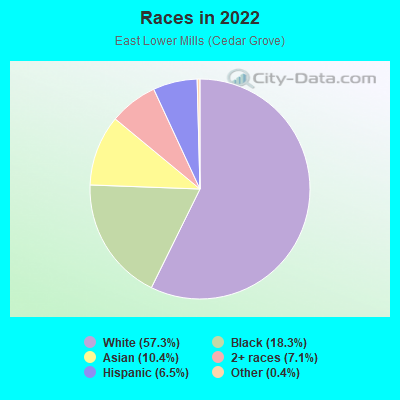
- 3,25157.3%White
- 1,04118.3%Black
- 59310.4%Asian
- 4017.1%Two or more races
- 3686.5%Hispanic or Latino
- 230.4%Some other race
Distribution of median household income
![Distribution of median household income]()
- 62Less than $10,000
- 250$10,000 to $19,999
- 109$20,000 to $29,999
- 219$30,000 to $39,999
- 111$40,000 to $49,999
- 135$50,000 to $59,999
- 270$60,000 to $74,999
- 283$75,000 to $99,999
- 278$100,000 to $124,999
- 226$125,000 to $149,999
- 295$150,000 to $199,999
- 522$200,000 or more

Distribution of owner-occupied house/condo value
![Distribution of owner-occupied house/condo value]()
- 1,023Less than $50,000
- 313$50,000 to $99,999
- 133$150,000 to $199,999
- 133$200,000 to $249,999
- 109$250,000 to $299,999
- 176$300,000 to $399,999
- 179$400,000 to $499,999
- 557$500,000 to $749,999
- 334$750,000 to $999,999
- 276$1,000,000 or more

Distribution of rent paid by renters
![Distribution of rent paid by renters]()
- 1,251Less than $100
- 205$100 to $199
- 94$200 to $299
- 324$300 to $399
- 118$400 to $499
- 76$500 to $599
- 19$600 to $699
- 132$700 to $799
- 81$800 to $899
- 87$900 to $999
- 231$1,000 to $1,249
- 147$1,250 to $1,499
- 197$1,500 to $1,999
- 654$2,000 or more

| Males: | 2,619 |
| Females: | 2,535 |
Males:
| This neighborhood: | 36.4 years |
| Whole city: | 32.7 years |
| This neighborhood: | 42.5 years |
| Whole city: | 34.1 years |
Average household size:
| East Lower Mills (Cedar Grove): | 4.4 people |
| Boston: | 2.1 people |
Percentage of family households:
| East Lower Mills (Cedar Grove): | 40.9% |
| Boston: | 34.5% |
| Here: | 46.8% |
| Boston: | 26.9% |
Percentage of married-couple families with children (among all households):
| East Lower Mills (Cedar Grove): | 34.3% |
| Boston: | 24.9% |
Percentage of single-mother households (among all households):
| East Lower Mills (Cedar Grove): | 11.0% |
| Boston: | 15.7% |
Percentage of never married males 15 years old and over:
Percentage of never married females 15 years old and over:
| East Lower Mills (Cedar Grove): | 20.3% |
| Boston: | 26.8% |
Percentage of never married females 15 years old and over:
| East Lower Mills (Cedar Grove): | 21.1% |
| city: | 28.3% |
Percentage of people that speak English not well or not at all:
| East Lower Mills (Cedar Grove): | 3.3% |
| Boston: | 8.0% |
Percentage of people born in this state:
Percentage of people born in another U.S. state:
Percentage of native residents but born outside the U.S.:
Percentage of foreign born residents:
| Here: | 66.3% |
| Boston: | 42.4% |
Percentage of people born in another U.S. state:
| East Lower Mills (Cedar Grove): | 17.3% |
| Boston: | 26.6% |
Percentage of native residents but born outside the U.S.:
| Here: | 1.7% |
| city: | 3.3% |
Percentage of foreign born residents:
| Here: | 14.7% |
| Boston: | 27.6% |
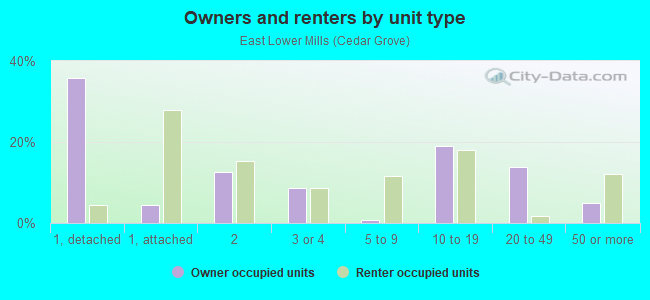
Owner-occupied
Renter-occupied

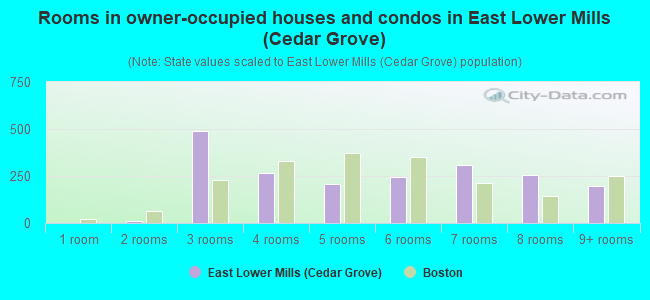
- Rooms in owner-occupied houses and condos in East Lower Mills <
> - 01 room
- 122 rooms
- 4893 rooms
- 2684 rooms
- 2085 rooms
- 2456 rooms
- 3087 rooms
- 2548 rooms
- 1979+ rooms
- Rooms in renter-occupied apartments in East Lower Mills <
> - 941 room
- 752 rooms
- 2543 rooms
- 2714 rooms
- 2245 rooms
- 2026 rooms
- 1227 rooms
- 798 rooms
- 479+ rooms
Owner-occupied
Renter-occupied
- Bedrooms in owner-occupied houses and condos in East Lower Mills <
> - 27no bedroom
- 1211 bedroom
- 3182 bedrooms
- 4563 bedrooms
- 3244 bedrooms
- 2195+ bedrooms
- Bedrooms in renter-occupied apartments in East Lower Mills <
> - 94no bedroom
- 3411 bedroom
- 2202 bedrooms
- 3453 bedrooms
- 474 bedrooms
- 05+ bedrooms
Average number of cars or other vehicles available in houses/condos:
Average number of cars or other vehicles available in apartments:
| This neighborhood: | 1.6 |
| Boston: | 1.4 |
Average number of cars or other vehicles available in apartments:
| Here: | |
| city: |
Percentage of units with a mortgage:
| East Lower Mills (Cedar Grove): | 78.1% |
| Boston: | 69.7% |
Housing prices:
- Average estimated value of detached houses in 2022 (31.7% of all units):
East Lower Mills (Cedar Grove): $478,198 Massachusetts: $651,570
- Average estimated value of housing units in 2-unit structures in 2022 (25.2% of all units):
This neighborhood: $606,216 Massachusetts: $594,808
- Year house built in East Lower Mills <
> - 252020 or later
- 472010 to 2019
- 1682000 to 2009
- 1071990 to 1999
- 1321980 to 1989
- 1901970 to 1979
- 2951960 to 1969
- 1801950 to 1959
- 2311940 to 1949
- 1,2661939 or earlier
City-data.com crime index for city in 2020 (higher means more crime):
| City: | 258.2 |
| U.S. average: | 219.5 |
Travel time to work (commute)
![Travel time to work (commute)]()
- 24Less than 5 minutes
- 485 to 9 minutes
- 23910 to 14 minutes
- 18615 to 19 minutes
- 28520 to 24 minutes
- 9425 to 29 minutes
- 40930 to 34 minutes
- 8635 to 39 minutes
- 17640 to 44 minutes
- 37445 to 59 minutes
- 41660 to 89 minutes
- 20490 or more minutes

Means of transportation to work
![Means of transportation to work]()
- 59.2%1,802Drove a car alone
- 8.0%243Carpooled
- 8.4%257Bus
- 17.1%521Subway or elevated rail
- 2.7%82Long-distance train or commuter rail
- 3.4%103Light rail, streetcar or trolley
- 4.5%136Taxi
- 4.6%140Bicycle
- 3.2%98Walked
- 2.3%70Other means
- 11.2%340Worked at home

Time leaving home to go to work
![Time leaving home to go to work]()
- 13312:00 a.m. to 4:59 a.m.
- 1115:00 a.m. to 5:29 a.m.
- 575:30 a.m. to 5:59 a.m.
- 2466:00 a.m. to 6:29 a.m.
- 2856:30 a.m. to 6:59 a.m.
- 3847:00 a.m. to 7:29 a.m.
- 2157:30 a.m. to 7:59 a.m.
- 4158:00 a.m. to 8:29 a.m.
- 1568:30 a.m. to 8:59 a.m.
- 1449:00 a.m. to 9:59 a.m.
- 4410:00 a.m. to 10:59 a.m.
- 3211:00 a.m. to 11:59 a.m.
- 10012:00 p.m. to 3:59 p.m.
- 844:00 p.m. to 11:59 p.m.

Occupations of males:
- Percentage of males in management occupations (except farmers):
Here: 5.6% city: 12.7%
- Percentage of males in business and financial operations occupations:
Here: 4.9% city: 9.1%
- Percentage of males in computer and mathematical occupations:
Here: 3.7% city: 7.4%
- Percentage of males in architecture and engineering occupations:
Here: 4.1% city: 3.1%
- Percentage of males in life, physical, and social science occupations:
Here: 2.3% city: 3.9%
- Percentage of males in community and social services occupations:
Here: 1.3% city: 1.4%
- Percentage of males in legal occupations:
Here: 1.0% city: 2.5%
- Percentage of males in education, training, and library occupations:
Here: 3.0% city: 5.7%
- Percentage of males in arts, design, entertainment, sports, and media occupations:
Here: 4.7% city: 2.7%
- Percentage of males in healthcare practitioners and technical occupations:
Here: 2.9% city: 4.4%
- Percentage of males in service occupations:
Here: 42.0% city: 16.0%
- Percentage of males in sales and office occupations:
Here: 12.6% city: 15.2%
- Percentage of males in construction, extraction, and maintenance occupations:
Here: 3.9% city: 4.4%
- Percentage of males in production occupations:
Here: 2.9% city: 2.4%
- Percentage of males in material moving occupations:
Here: 3.9% city: 2.3%
Occupations of females:
- Percentage of females in management occupations (except farmers):
Here: 6.5% city: 12.2%
- Percentage of females in business and financial operations occupations:
Here: 15.2% city: 9.5%
- Percentage of females in computer and mathematical occupations:
Here: 4.2% city: 3.2%
- Percentage of females in life, physical, and social science occupations:
Here: 2.5% city: 3.3%
- Percentage of females in community and social services occupations:
Here: 4.8% city: 3.1%
- Percentage of females in legal occupations:
Here: 3.5% city: 2.3%
- Percentage of females in education, training, and library occupations:
Here: 9.9% city: 9.4%
- Percentage of females in arts, design, entertainment, sports, and media occupations:
Here: 4.1% city: 3.4%
- Percentage of females in healthcare practitioners and technical occupations:
Here: 10.5% city: 10.2%
- Percentage of females in service occupations:
Here: 7.8% city: 18.6%
- Percentage of females in sales and office occupations:
Here: 24.3% city: 20.2%
- Percentage of females in farming, fishing, and forestry occupations:
Here: 1.0% city: 0.0%
- Percentage of females in production occupations:
Here: 5.2% city: 1.5%
- Percentage of females in material moving occupations:
Here: 1.6% city: 1.0%
Percentage of people 16-64 in Armed Forces:
| East Lower Mills (Cedar Grove): | 1.0% |
| Boston: | 0.1% |
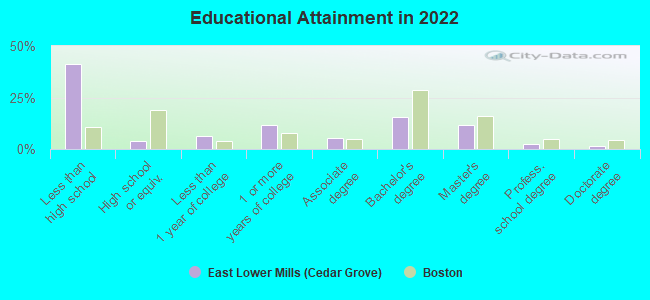
Education in this neighborhood (subdivision or community):
- Percentage of people 3 years and older in K-12 schools:
East Lower Mills (Cedar Grove): 51.6% Boston: 11.0%
- Percentage of people 3 years and older in undergraduate colleges:
East Lower Mills (Cedar Grove): 8.2% Boston: 11.0%
- Percentage of people 3 years and older in grad. or professional schools:
East Lower Mills (Cedar Grove): 5.7% Boston: 4.3%
- Percentage of students K-12 enrolled in private schools:
East Lower Mills (Cedar Grove): 92.1% Boston: 13.8%
Percentage of population below poverty level:
| East Lower Mills (Cedar Grove): | 8.2% |
| Boston: | 17.1% |
Median year owner moved in (as recorded in 2022):
| East Lower Mills (Cedar Grove): | 2000 |
| Boston: | 2011 |
Percentage of married-couple families with both working:
| East Lower Mills (Cedar Grove): | 145.0% |
| Boston: | 78.2% |
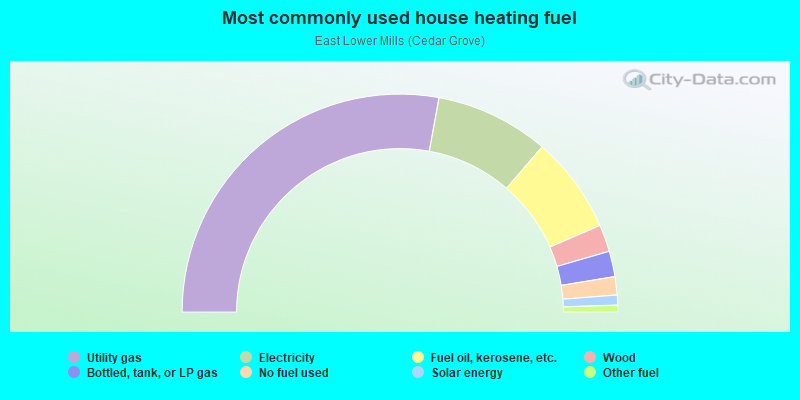
- 55.8%Utility gas
- 16.9%Electricity
- 14.4%Fuel oil, kerosene, etc.
- 4.0%Wood
- 3.8%Bottled, tank, or LP gas
- 2.7%No fuel used
- 1.5%Solar energy
- 1.0%Other fuel
Highways in this neighborhood:
Gallivan Blvd (State Hwy 203)
Length: 0.46 miles
Direction: E-W
Address range: 664 to 724
Direction: E-W
Address range: 664 to 724
Roads and streets:
Adams St
Length: 1.00 miles
Directions: E-W, N-S, SW-NE
Address range: 868 to 1225
Directions: E-W, N-S, SW-NE
Address range: 868 to 1225
Milton St
Length: 0.85 miles
Direction: E-W
Address range: 1 to 220
Direction: E-W
Address range: 1 to 220
Richmond St
Length: 0.58 miles
Directions: E-W, SE-NW
Address range: 1 to 199
Directions: E-W, SE-NW
Address range: 1 to 199
Washington St
Length: 0.51 miles
Directions: E-W, N-S, SE-NW
Address range: 969 to 1199
Directions: E-W, N-S, SE-NW
Address range: 969 to 1199
Dorchester Ave
Length: 0.47 miles
Direction: N-S
Address range: 2081 to 2299
Direction: N-S
Address range: 2081 to 2299
Hill Top St
Length: 0.47 miles
Directions: E-W, SW-NE
Address range: 1 to 199
Directions: E-W, SW-NE
Address range: 1 to 199
Granite Ave
Length: 0.31 miles
Directions: N-S, SE-NW
Address range: 40 to 199
Directions: N-S, SE-NW
Address range: 40 to 199
Hallet St
Length: 0.31 miles
Directions: N-S, SE-NW, SW-NE
Address range: 12 to 149
Directions: N-S, SE-NW, SW-NE
Address range: 12 to 149
Richview St
Length: 0.30 miles
Directions: E-W, N-S, SE-NW, SW-NE
Address range: 1 to 81
Directions: E-W, N-S, SE-NW, SW-NE
Address range: 1 to 81
Butler St
Length: 0.28 miles
Directions: N-S, SE-NW
Address range: 1 to 99
Directions: N-S, SE-NW
Address range: 1 to 99
Medway St
Length: 0.26 miles
Directions: E-W, SE-NW
Address range: 1 to 36
Directions: E-W, SE-NW
Address range: 1 to 36
St Gregory St
Length: 0.24 miles
Direction: E-W
Address range: 1 to 75
Direction: E-W
Address range: 1 to 75
Valley Rd
Length: 0.21 miles
Direction: E-W
Address range: 1 to 99
Direction: E-W
Address range: 1 to 99
Bearse Ave
Length: 0.21 miles
Directions: E-W, SW-NE
Address range: 1 to 99
Directions: E-W, SW-NE
Address range: 1 to 99
Rugdale Rd
Length: 0.20 miles
Directions: E-W, N-S, SW-NE
Address range: 1 to 99
Directions: E-W, N-S, SW-NE
Address range: 1 to 99
Oconnell Rd
Length: 0.17 miles
Directions: E-W, N-S, SE-NW
Address range: 1 to 99
Directions: E-W, N-S, SE-NW
Address range: 1 to 99
Hillsdale St
Length: 0.17 miles
Direction: SE-NW
Address range: 1 to 99
Direction: SE-NW
Address range: 1 to 99
Cedar Grove St
Length: 0.16 miles
Direction: E-W
Address range: 1 to 99
Direction: E-W
Address range: 1 to 99
Avondale St
Length: 0.15 miles
Direction: N-S
Address range: 1 to 99
Direction: N-S
Address range: 1 to 99
Rita Rd
Length: 0.15 miles
Directions: E-W, N-S
Address range: 1 to 99
Directions: E-W, N-S
Address range: 1 to 99
St Brendan Rd
Length: 0.14 miles
Direction: SE-NW
Address range: 1 to 58
Direction: SE-NW
Address range: 1 to 58
Brookvale St
Length: 0.14 miles
Direction: E-W
Address range: 1 to 99
Direction: E-W
Address range: 1 to 99
Branchfield St
Length: 0.14 miles
Direction: SW-NE
Address range: 1 to 99
Direction: SW-NE
Address range: 1 to 99
Ventura St
Length: 0.13 miles
Directions: N-S, SW-NE
Address range: 1 to 99
Directions: N-S, SW-NE
Address range: 1 to 99
Huntoon St
Length: 0.13 miles
Directions: E-W, SW-NE
Address range: 1 to 99
Directions: E-W, SW-NE
Address range: 1 to 99
Grayson St
Length: 0.13 miles
Direction: N-S
Address range: 1 to 99
Direction: N-S
Address range: 1 to 99
Crockett Ave
Length: 0.12 miles
Directions: N-S, SE-NW
Address range: 1 to 26
Directions: N-S, SE-NW
Address range: 1 to 26
Rockne Ave
Length: 0.12 miles
Direction: SE-NW
Address range: 42 to 99
Direction: SE-NW
Address range: 42 to 99
Myrtlebank Ave
Length: 0.12 miles
Direction: SE-NW
Address range: 60 to 106
Direction: SE-NW
Address range: 60 to 106
Belton St
Length: 0.11 miles
Direction: N-S
Address range: 1 to 99
Direction: N-S
Address range: 1 to 99
Whitridge St
Length: 0.11 miles
Direction: SE-NW
Address range: 1 to 99
Direction: SE-NW
Address range: 1 to 99
Lenoxdale Ave
Length: 0.11 miles
Direction: SE-NW
Address range: 54 to 99
Direction: SE-NW
Address range: 54 to 99
Mother Julian Rd
Length: 0.10 miles
Direction: E-W
Address range: 1 to 99
Direction: E-W
Address range: 1 to 99
River St
Length: 0.10 miles
Directions: E-W, SW-NE
Address range: 1 to 23
Directions: E-W, SW-NE
Address range: 1 to 23
Marsh St
Length: 0.09 miles
Direction: E-W
Address range: 1 to 99
Direction: E-W
Address range: 1 to 99
Edna Rd
Length: 0.09 miles
Direction: E-W
Address range: 1 to 99
Direction: E-W
Address range: 1 to 99
Fellsway St
Length: 0.09 miles
Direction: SE-NW
Address range: 1 to 99
Direction: SE-NW
Address range: 1 to 99
Milwood Ter
Length: 0.08 miles
Directions: E-W, N-S
Address range: 1 to 99
Directions: E-W, N-S
Address range: 1 to 99
Beaufield St
Length: 0.07 miles
Directions: E-W, N-S, SW-NE
Address range: 1 to 99
Directions: E-W, N-S, SW-NE
Address range: 1 to 99
Frazer St
Length: 0.07 miles
Direction: N-S
Address range: 1 to 99
Direction: N-S
Address range: 1 to 99
Jo Anne Ter
Length: 0.06 miles
Directions: E-W, SE-NW
Address range: 1 to 99
Directions: E-W, SE-NW
Address range: 1 to 99
Sunset Ln
Length: 0.06 miles
Direction: E-W
Address range: 1 to 99
Direction: E-W
Address range: 1 to 99
Grant Pl
Length: 0.06 miles
Direction: E-W
Address range: 1 to 99
Direction: E-W
Address range: 1 to 99
Hutchinson St
Length: 0.06 miles
Direction: SE-NW
Address range: 37 to 99
Direction: SE-NW
Address range: 37 to 99
Packard Ave
Length: 0.05 miles
Directions: E-W, N-S
Address range: 16 to 99
Directions: E-W, N-S
Address range: 16 to 99
Tanglewood Rd
Length: 0.05 miles
Direction: E-W
Address range: 1 to 99
Direction: E-W
Address range: 1 to 99
Wichita Ter
Length: 0.05 miles
Direction: N-S
Address range: 1 to 99
Direction: N-S
Address range: 1 to 99
Milwood St
Length: 0.05 miles
Direction: N-S
Address range: 38 to 99
Direction: N-S
Address range: 38 to 99
Hallet Davis St
Length: 0.05 miles
Directions: N-S, SE-NW
Address range: 1 to 99
Directions: N-S, SE-NW
Address range: 1 to 99
Patterson St
Length: 0.04 miles
Directions: N-S, SE-NW
Address range: 15 to 99
Directions: N-S, SE-NW
Address range: 15 to 99
Irena Rd
Length: 0.04 miles
Directions: E-W, SE-NW
Address range: 1 to 99
Directions: E-W, SE-NW
Address range: 1 to 99
Morton St
Length: 0.04 miles
Direction: SE-NW
Address range: 1200 to 1299
Direction: SE-NW
Address range: 1200 to 1299
Adirondack Pl
Length: 0.03 miles
Direction: E-W
Address range: 1 to 99
Direction: E-W
Address range: 1 to 99
Granville St
Length: 0.03 miles
Direction: N-S
Address range: 36 to 99
Direction: N-S
Address range: 36 to 99
Swan Ct
Length: 0.03 miles
Direction: SE-NW
Address range: 1 to 99
Direction: SE-NW
Address range: 1 to 99
Railroad features:
Penn Central RR
Length: 1.62 miles
Directions: E-W, N-S, SE-NW, SW-NE
Directions: E-W, N-S, SE-NW, SW-NE
Mass transit rail lines:
Mbta Red Line RR (Ashmont-Mattapan Trolley)
Length: 0.91 miles
Directions: E-W, N-S, SE-NW, SW-NE
Directions: E-W, N-S, SE-NW, SW-NE