Downtown neighborhood in Galveston, Texas (TX), 77550 detailed profile
Settings
X


Business Search - 14 Million verified businesses
Area: 0.232 square miles
Population: 526
Population density:
| Downtown: | 2,270 people per square mile |
| Galveston: | 1,154 people per square mile |

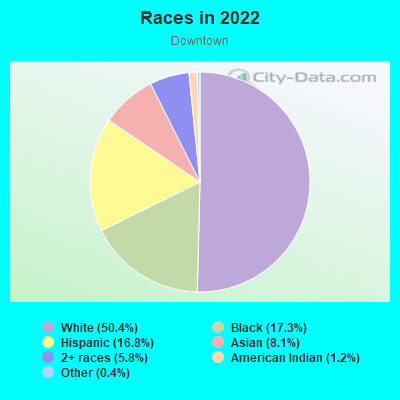
- 36870.1%White
- 11421.7%Hispanic or Latino
- 305.7%Black
- 81.5%Two or more races
- 51.0%Asian
Median household income in 2022:
| Downtown: | $47,375 |
| Galveston: | $57,453 |
Distribution of median household income
![Distribution of median household income]()
- 57Less than $10,000
- 19$10,000 to $19,999
- 52$20,000 to $29,999
- 20$30,000 to $39,999
- 19$40,000 to $49,999
- 31$50,000 to $59,999
- 23$60,000 to $74,999
- 14$75,000 to $99,999
- 28$100,000 to $124,999
- 9$125,000 to $149,999
- 24$150,000 to $199,999
- 14$200,000 or more

Distribution of owner-occupied house/condo value
![Distribution of owner-occupied house/condo value]()
- 4Less than $50,000
- 5$50,000 to $99,999
- 6$100,000 to $149,999
- 12$200,000 to $249,999
- 3$250,000 to $299,999
- 24$300,000 to $399,999
- 6$500,000 to $749,999
- 3$750,000 to $999,999

Distribution of rent paid by renters
![Distribution of rent paid by renters]()
- 4$400 to $499
- 2$600 to $699
- 21$700 to $799
- 48$800 to $899
- 28$900 to $999
- 51$1,000 to $1,249
- 30$1,250 to $1,499
- 28$1,500 to $1,999
- 19$2,000 or more

Median rent in 2022:
| Downtown: | $1,061 |
| Galveston: | $1,046 |
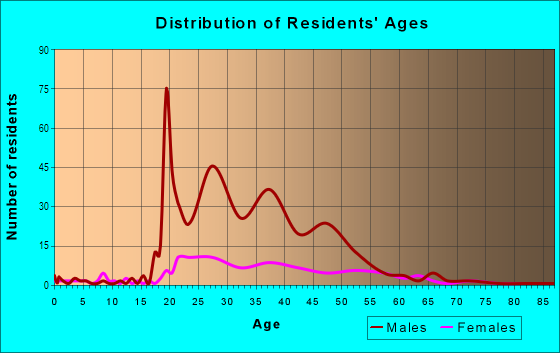
| Males: | 299 |
| Females: | 227 |
Males:
| This neighborhood: | 43.5 years |
| Whole city: | 38.8 years |
| This neighborhood: | 35.6 years |
| Whole city: | 40.0 years |
Average household size:
| Downtown: | 1.7 people |
| Galveston: | 28.0 people |
Percentage of family households:
| Downtown: | 21.3% |
| Galveston: | 35.7% |
| Here: | 27.5% |
| Galveston: | 34.9% |
Percentage of married-couple families with children (among all households):
| Downtown: | 29.8% |
| Galveston: | 25.9% |
Percentage of single-mother households (among all households):
| Downtown: | 0.0% |
| Galveston: | 16.0% |
Percentage of never married males 15 years old and over:
Percentage of never married females 15 years old and over:
| Downtown: | 30.4% |
| Galveston: | 21.7% |
Percentage of never married females 15 years old and over:
| Downtown: | 19.0% |
| city: | 17.2% |
Percentage of people that speak English not well or not at all:
| Downtown: | 0.0% |
| Galveston: | 4.5% |
Percentage of people born in this state:
Percentage of people born in another U.S. state:
Percentage of native residents but born outside the U.S.:
Percentage of foreign born residents:
| Here: | 53.9% |
| Galveston: | 60.2% |
Percentage of people born in another U.S. state:
| Downtown: | 34.4% |
| Galveston: | 25.0% |
Percentage of native residents but born outside the U.S.:
| Here: | 2.5% |
| city: | 1.8% |
Percentage of foreign born residents:
| Here: | 9.2% |
| Galveston: | 13.1% |
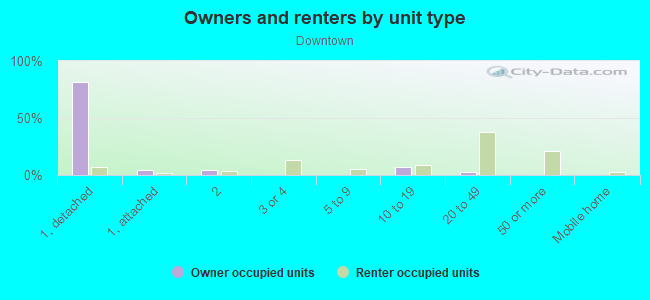
Owner-occupied
Renter-occupied

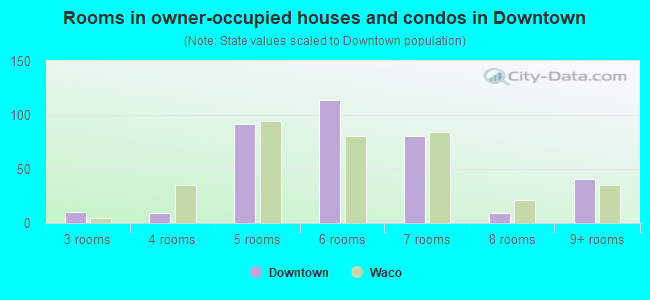
- Rooms in owner-occupied houses and condos in Downtown
- 01 room
- 72 rooms
- 83 rooms
- 14 rooms
- 95 rooms
- 216 rooms
- 27 rooms
- 28 rooms
- 69+ rooms
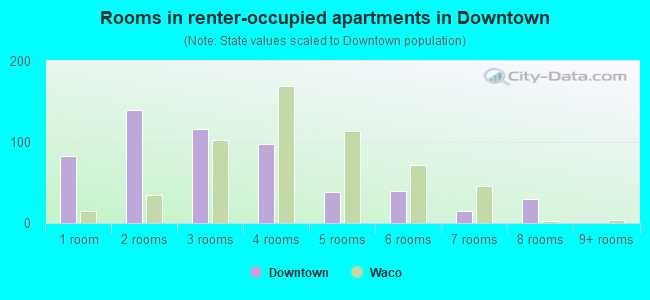
- Rooms in renter-occupied apartments in Downtown
- 271 room
- 452 rooms
- 763 rooms
- 454 rooms
- 225 rooms
- 126 rooms
- 137 rooms
- 08 rooms
- 09+ rooms
Owner-occupied
Renter-occupied
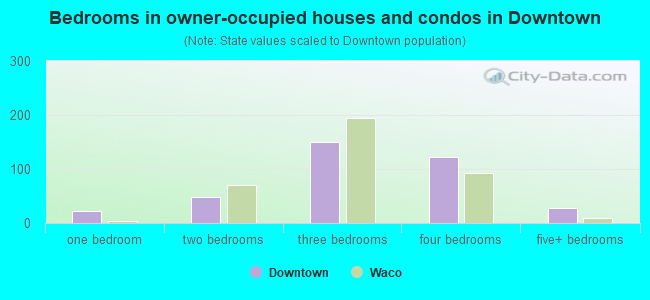
- Bedrooms in owner-occupied houses and condos in Downtown
- 0no bedroom
- 161 bedroom
- 252 bedrooms
- 83 bedrooms
- 54 bedrooms
- 35+ bedrooms
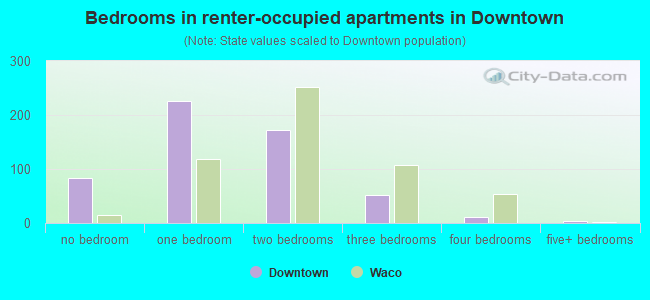
- Bedrooms in renter-occupied apartments in Downtown
- 36no bedroom
- 981 bedroom
- 802 bedrooms
- 273 bedrooms
- 04 bedrooms
- 05+ bedrooms
Average number of cars or other vehicles available in houses/condos:
Average number of cars or other vehicles available in apartments:
| This neighborhood: | 1.8 |
| Galveston: | 1.9 |
Average number of cars or other vehicles available in apartments:
| Here: | 0.9 |
| city: | 1.2 |
Percentage of units with a mortgage:
| Downtown: | 46.3% |
| Galveston: | 43.1% |
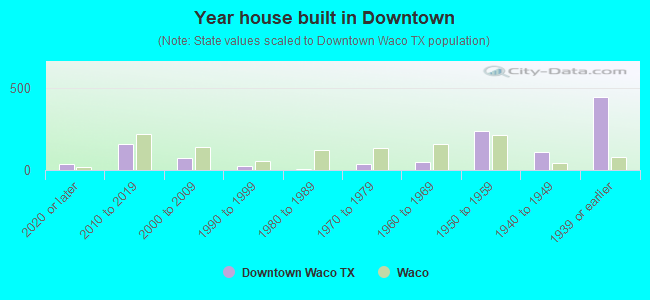
- Year house built in Downtown
- 02020 or later
- 92010 to 2019
- 32000 to 2009
- 51990 to 1999
- 151980 to 1989
- 251970 to 1979
- 341960 to 1969
- 401950 to 1959
- 131940 to 1949
- 2981939 or earlier
City-data.com crime index for city in 2020 (higher means more crime):
| City: | 424.2 |
| U.S. average: | 219.5 |
Travel time to work (commute)
![Travel time to work (commute)]()
- 8Less than 5 minutes
- 735 to 9 minutes
- 3510 to 14 minutes
- 3815 to 19 minutes
- 4420 to 24 minutes
- 1525 to 29 minutes
- 1430 to 34 minutes
- 540 to 44 minutes
- 260 to 89 minutes
- 1990 or more minutes

Means of transportation to work
![Means of transportation to work]()
- 47.2%132Drove a car alone
- 13.2%37Carpooled
- 1.4%4Motorcycle
- 12.9%36Bicycle
- 12.9%36Walked
- 3.6%10Other means
- 7.5%21Worked at home

Time leaving home to go to work
![Time leaving home to go to work]()
- 312:00 a.m. to 4:59 a.m.
- 105:00 a.m. to 5:29 a.m.
- 105:30 a.m. to 5:59 a.m.
- 66:00 a.m. to 6:29 a.m.
- 196:30 a.m. to 6:59 a.m.
- 137:00 a.m. to 7:29 a.m.
- 177:30 a.m. to 7:59 a.m.
- 298:00 a.m. to 8:29 a.m.
- 68:30 a.m. to 8:59 a.m.
- 409:00 a.m. to 9:59 a.m.
- 810:00 a.m. to 10:59 a.m.
- 3112:00 p.m. to 3:59 p.m.
- 604:00 p.m. to 11:59 p.m.

Occupations of males:
- Percentage of males in management occupations (except farmers):
Here: 14.5% city: 13.4%
- Percentage of males in business and financial operations occupations:
Here: 4.0% city: 3.9%
- Percentage of males in architecture and engineering occupations:
Here: 2.8% city: 1.0%
- Percentage of males in life, physical, and social science occupations:
Here: 4.8% city: 2.0%
- Percentage of males in community and social services occupations:
Here: 5.1% city: 0.7%
- Percentage of males in education, training, and library occupations:
Here: 7.4% city: 3.4%
- Percentage of males in healthcare practitioners and technical occupations:
Here: 2.0% city: 4.3%
- Percentage of males in service occupations:
Here: 43.6% city: 21.5%
- Percentage of males in sales and office occupations:
Here: 5.4% city: 13.0%
- Percentage of males in transportation occupations:
Here: 2.8% city: 5.4%
- Percentage of males in material moving occupations:
Here: 3.4% city: 5.8%
Occupations of females:
- Percentage of females in management occupations (except farmers):
Here: 3.6% city: 9.1%
- Percentage of females in business and financial operations occupations:
Here: 6.2% city: 3.9%
- Percentage of females in life, physical, and social science occupations:
Here: 12.5% city: 1.8%
- Percentage of females in education, training, and library occupations:
Here: 6.8% city: 9.8%
- Percentage of females in arts, design, entertainment, sports, and media occupations:
Here: 3.6% city: 2.6%
- Percentage of females in healthcare practitioners and technical occupations:
Here: 17.7% city: 13.0%
- Percentage of females in service occupations:
Here: 29.7% city: 23.6%
- Percentage of females in sales and office occupations:
Here: 7.8% city: 25.4%
- Percentage of females in construction, extraction, and maintenance occupations:
Here: 1.6% city: 0.7%
- Percentage of females in transportation occupations:
Here: 10.4% city: 1.6%
Percentage of people 16-64 in Armed Forces:
| Downtown: | 1.0% |
| Galveston: | 0.3% |
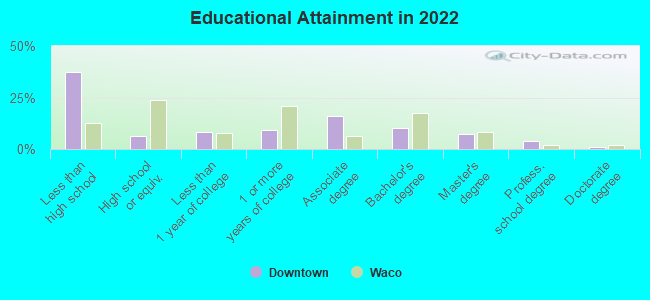
Education in this neighborhood (subdivision or community):
- Percentage of people 3 years and older in K-12 schools:
Downtown: 6.1% Galveston: 11.3%
- Percentage of people 3 years and older in undergraduate colleges:
Downtown: 7.8% Galveston: 9.5%
- Percentage of people 3 years and older in grad. or professional schools:
Downtown: 4.0% Galveston: 2.4%
- Percentage of students K-12 enrolled in private schools:
Downtown: 53.1% Galveston: 11.5%
Percentage of population below poverty level:
| Downtown: | 20.2% |
| Galveston: | 19.2% |
Median year owner moved in (as recorded in 2022):
Median year renter moved in (as recorded in 2022):
| Downtown: | 2013 |
| Galveston: | 2010 |
Median year renter moved in (as recorded in 2022):
| Downtown: | 2018 |
| Galveston: | 2018 |
Percentage of married-couple families with both working:
| Downtown: | 54.5% |
| Galveston: | 62.5% |
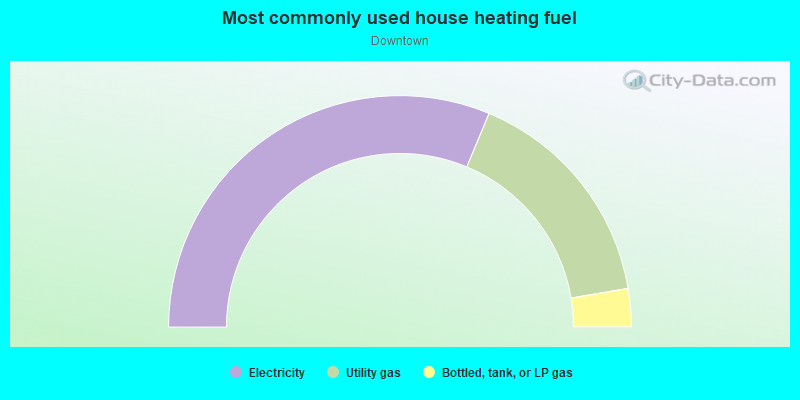
- 87.0%Electricity
- 12.5%Utility gas
- 0.6%No fuel used
Roads and streets:
Winnie Rear St (Ave G, Winnie St)
Length: 0.58 miles
Direction: E-W
Address range: 1900 to 2599
Direction: E-W
Address range: 1900 to 2599
Market Rear St (Ave D, Market St)
Length: 0.58 miles
Direction: E-W
Address range: 1900 to 2599
Direction: E-W
Address range: 1900 to 2599
Post Office Rear St (Post Office St, Avenue E)
Length: 0.58 miles
Direction: E-W
Address range: 1900 to 2599
Direction: E-W
Address range: 1900 to 2599
Ave F (Church St, Church Rear St)
Length: 0.58 miles
Direction: E-W
Address range: 1900 to 2599
Direction: E-W
Address range: 1900 to 2599
Ball St (Ball Rear St, Ave H)
Length: 0.49 miles
Direction: E-W
Address range: 1900 to 2499
Direction: E-W
Address range: 1900 to 2499
Ave C (Mechanic St, Ship Mechanic Row St)
Length: 0.49 miles
Direction: E-W
Address range: 1900 to 2499
Direction: E-W
Address range: 1900 to 2499
Ave B (Strand St, Strand Rear St)
Length: 0.49 miles
Direction: E-W
Address range: 1900 to 2499
Direction: E-W
Address range: 1900 to 2499
24th Street Rear (24th St)
Length: 0.45 miles
Direction: N-S
Address range: 150 to 848
Direction: N-S
Address range: 150 to 848
21st St (Moody St)
Length: 0.45 miles
Direction: N-S
Address range: 164 to 850
Direction: N-S
Address range: 164 to 850
23rd Street Rear (Tremont St, 23rd St)
Length: 0.45 miles
Direction: N-S
Address range: 154 to 847
Direction: N-S
Address range: 154 to 847
Kempner St (22nd St)
Length: 0.45 miles
Direction: N-S
Address range: 154 to 847
Direction: N-S
Address range: 154 to 847
Rosenberg St (25th St, 25th Street Rear)
Length: 0.41 miles
Direction: N-S
Address range: 157 to 851
Direction: N-S
Address range: 157 to 851
19th St
Length: 0.41 miles
Direction: N-S
Address range: 200 to 846
Direction: N-S
Address range: 200 to 846
20th St (20th Rear St)
Length: 0.35 miles
Directions: N-S, SE-NW
Address range: 200 to 847
Directions: N-S, SE-NW
Address range: 200 to 847
26th Street Rear (26th St)
Length: 0.19 miles
Direction: N-S
Address range: 400 to 699
Direction: N-S
Address range: 400 to 699