Cornell University neighborhood in Ithaca, New York (NY), 14853, 14850 detailed profile
Settings
X


Business Search - 14 Million verified businesses
Area: 0.484 square miles
Population: 1,009
Population density:
| Cornell University: | 2,084 people per square mile |
| Ithaca: | 5,740 people per square mile |

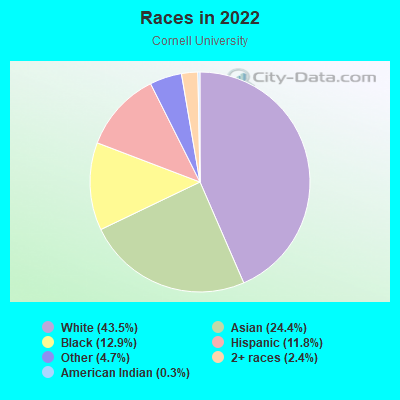
- 43743.5%White
- 24524.4%Asian
- 13012.9%Black
- 11811.8%Hispanic or Latino
- 474.7%Some other race
- 242.4%Two or more races
- 30.3%American Indian
Distribution of median household income
![Distribution of median household income]()
- 45Less than $10,000
- 208$10,000 to $19,999
- 112$20,000 to $29,999
- 4$30,000 to $39,999
- 111$40,000 to $49,999
- 264$50,000 to $59,999
- 2$60,000 to $74,999
- 9$75,000 to $99,999
- 115$100,000 to $124,999
- 3$125,000 to $149,999
- 10$150,000 to $199,999
- 5$200,000 or more

Distribution of owner-occupied house/condo value
![Distribution of owner-occupied house/condo value]()
- 74Less than $50,000
- 3$50,000 to $99,999
- 7$100,000 to $149,999
- 57$150,000 to $199,999
- 3$200,000 to $249,999
- 77$250,000 to $299,999
- 14$300,000 to $399,999
- 3$400,000 to $499,999
- 2$500,000 to $749,999
- 4$750,000 to $999,999
- 7$1,000,000 or more

Distribution of rent paid by renters
![Distribution of rent paid by renters]()
- 4$400 to $499
- 57$500 to $599
- 428$700 to $799
- 492$800 to $899
- 7$900 to $999
- 20$1,000 to $1,249
- 7$1,250 to $1,499
- 13$1,500 to $1,999
- 235$2,000 or more

Median rent in 2022:
| Cornell University: | $1,131 |
| Ithaca: | $1,274 |
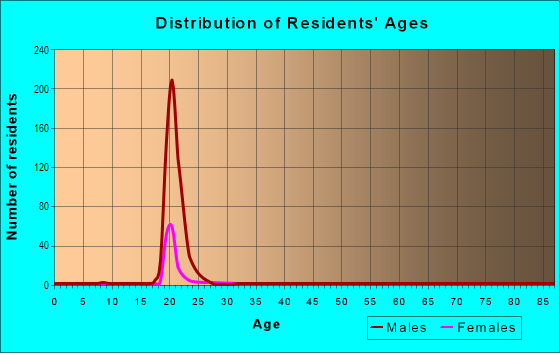
| Males: | 512 |
| Females: | 496 |
Males:
| This neighborhood: | 20.9 years |
| Whole city: | 22.9 years |
| This neighborhood: | 23.3 years |
| Whole city: | 22.7 years |
Average household size:
| Cornell University: | 1.5 people |
| Ithaca: | 1.8 people |
Percentage of family households:
| Cornell University: | 17.2% |
| Ithaca: | 21.1% |
| Here: | 21.1% |
| Ithaca: | 21.1% |
Percentage of married-couple families with children (among all households):
| Cornell University: | 6.1% |
| Ithaca: | 26.0% |
Percentage of single-mother households (among all households):
| Cornell University: | 198.5% |
| Ithaca: | 12.6% |
Percentage of never married males 15 years old and over:
Percentage of never married females 15 years old and over:
| Cornell University: | 48.5% |
| Ithaca: | 37.7% |
Percentage of never married females 15 years old and over:
| Cornell University: | 46.3% |
| city: | 34.4% |
Percentage of people that speak English not well or not at all:
| Cornell University: | 2.6% |
| Ithaca: | 1.0% |
Percentage of people born in this state:
Percentage of people born in another U.S. state:
Percentage of native residents but born outside the U.S.:
Percentage of foreign born residents:
| Here: | 41.5% |
| Ithaca: | 40.5% |
Percentage of people born in another U.S. state:
| Cornell University: | 28.4% |
| Ithaca: | 37.5% |
Percentage of native residents but born outside the U.S.:
| Here: | 3.1% |
| city: | 2.4% |
Percentage of foreign born residents:
| Here: | 26.9% |
| Ithaca: | 19.7% |
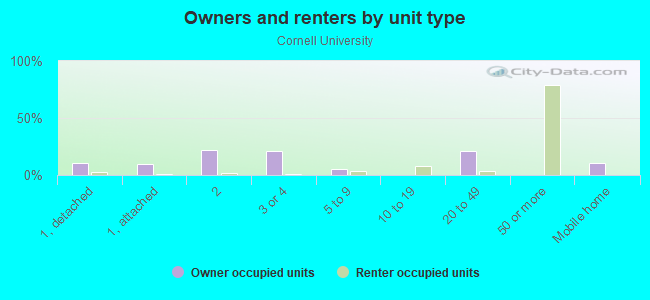
Owner-occupied
Renter-occupied

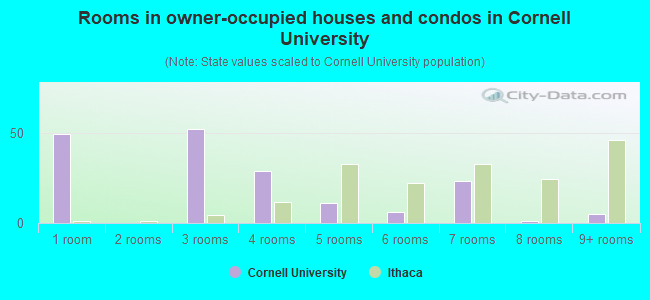
- Rooms in owner-occupied houses and condos in Cornell University
- 491 room
- 02 rooms
- 523 rooms
- 294 rooms
- 115 rooms
- 66 rooms
- 237 rooms
- 18 rooms
- 59+ rooms
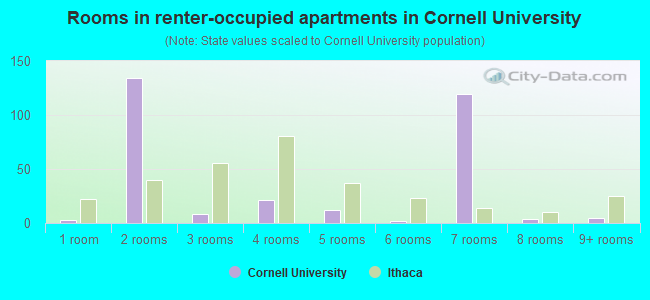
- Rooms in renter-occupied apartments in Cornell University
- 31 room
- 1342 rooms
- 83 rooms
- 214 rooms
- 125 rooms
- 26 rooms
- 1197 rooms
- 48 rooms
- 59+ rooms
Owner-occupied
Renter-occupied
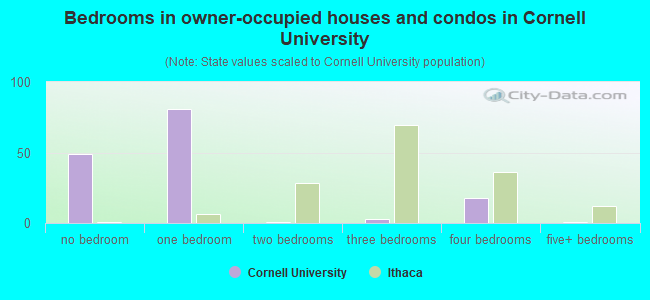
- Bedrooms in owner-occupied houses and condos in Cornell University
- 49no bedroom
- 811 bedroom
- 12 bedrooms
- 33 bedrooms
- 184 bedrooms
- 15+ bedrooms
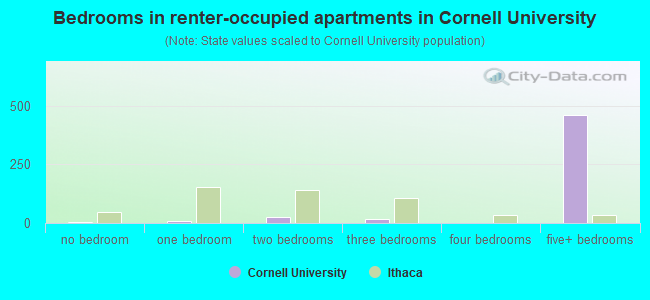
- Bedrooms in renter-occupied apartments in Cornell University
- 3no bedroom
- 71 bedroom
- 242 bedrooms
- 193 bedrooms
- 14 bedrooms
- 4615+ bedrooms
Average number of cars or other vehicles available in houses/condos:
Average number of cars or other vehicles available in apartments:
| This neighborhood: | 1.6 |
| Ithaca: | 1.6 |
Average number of cars or other vehicles available in apartments:
| Here: | 0.7 |
| city: | 1.0 |
Percentage of units with a mortgage:
| Cornell University: | 12.0% |
| Ithaca: | 57.6% |
Average estimated value of detached houses in 2022 (38.6% of all units):
| Cornell University: | $714,596 |
| Ithaca: | $346,289 |
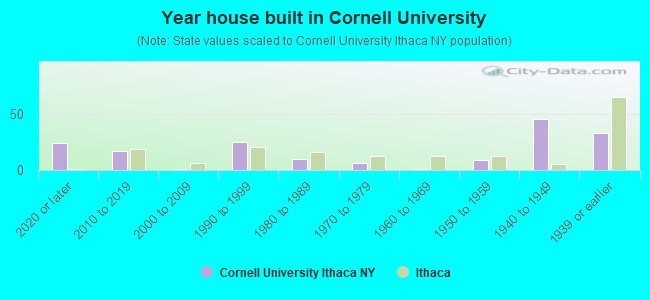
- Year house built in Cornell University
- 242020 or later
- 172010 to 2019
- 12000 to 2009
- 251990 to 1999
- 101980 to 1989
- 61970 to 1979
- 11960 to 1969
- 91950 to 1959
- 461940 to 1949
- 331939 or earlier
City-data.com crime index for city in 2020 (higher means more crime):
| City: | 265.9 |
| U.S. average: | 219.5 |
Travel time to work (commute)
![Travel time to work (commute)]()
- 15Less than 5 minutes
- 1145 to 9 minutes
- 12710 to 14 minutes
- 8115 to 19 minutes
- 10620 to 24 minutes
- 1425 to 29 minutes
- 2230 to 34 minutes
- 5335 to 39 minutes
- 4440 to 44 minutes
- 245 to 59 minutes
- 2260 to 89 minutes
- 390 or more minutes

Means of transportation to work
![Means of transportation to work]()
- 15.8%51Drove a car alone
- 3.1%10Carpooled
- 3.4%11Bus
- 3.1%10Motorcycle
- 0.3%1Bicycle
- 52.7%170Walked
- 2.2%7Other means
- 23.6%76Worked at home

Time leaving home to go to work
![Time leaving home to go to work]()
- 312:00 a.m. to 4:59 a.m.
- 345:00 a.m. to 5:29 a.m.
- 36:00 a.m. to 6:29 a.m.
- 46:30 a.m. to 6:59 a.m.
- 507:00 a.m. to 7:29 a.m.
- 397:30 a.m. to 7:59 a.m.
- 778:00 a.m. to 8:29 a.m.
- 138:30 a.m. to 8:59 a.m.
- 529:00 a.m. to 9:59 a.m.
- 3210:00 a.m. to 10:59 a.m.
- 2111:00 a.m. to 11:59 a.m.
- 11012:00 p.m. to 3:59 p.m.
- 1334:00 p.m. to 11:59 p.m.

Occupations of males:
- Percentage of males in management occupations (except farmers):
Here: 6.9% city: 6.8%
- Percentage of males in legal occupations:
Here: 10.2% city: 2.4%
- Percentage of males in education, training, and library occupations:
Here: 8.1% city: 22.0%
- Percentage of males in arts, design, entertainment, sports, and media occupations:
Here: 6.1% city: 5.6%
- Percentage of males in healthcare practitioners and technical occupations:
Here: 1.0% city: 0.6%
- Percentage of males in service occupations:
Here: 3.4% city: 18.1%
- Percentage of males in sales and office occupations:
Here: 40.5% city: 13.8%
- Percentage of males in farming, fishing, and forestry occupations:
Here: 3.6% city: 0.3%
- Percentage of males in production occupations:
Here: 1.2% city: 1.1%
- Percentage of males in transportation occupations:
Here: 6.9% city: 1.3%
- Percentage of males in material moving occupations:
Here: 3.4% city: 1.6%
Occupations of females:
- Percentage of females in management occupations (except farmers):
Here: 4.4% city: 6.2%
- Percentage of females in business and financial operations occupations:
Here: 2.2% city: 4.5%
- Percentage of females in life, physical, and social science occupations:
Here: 20.4% city: 8.1%
- Percentage of females in education, training, and library occupations:
Here: 8.1% city: 22.2%
- Percentage of females in service occupations:
Here: 43.8% city: 19.5%
- Percentage of females in sales and office occupations:
Here: 18.9% city: 14.3%
- Percentage of females in production occupations:
Here: 1.8% city: 1.3%
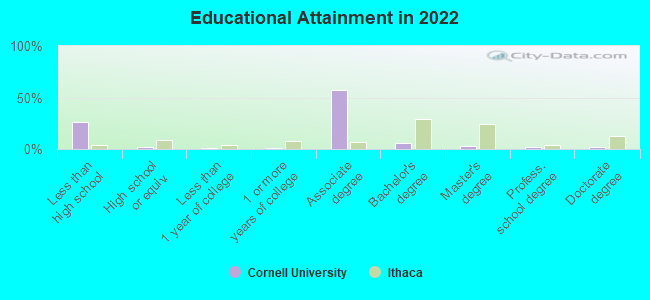
Education in this neighborhood (subdivision or community):
- Percentage of people 3 years and older in K-12 schools:
Cornell University: 31.2% Ithaca: 5.1%
- Percentage of people 3 years and older in undergraduate colleges:
Cornell University: 89.1% Ithaca: 42.7%
- Percentage of people 3 years and older in grad. or professional schools:
Cornell University: 3.0% Ithaca: 12.4%
- Percentage of students K-12 enrolled in private schools:
Cornell University: 28.6% Ithaca: 15.4%
Percentage of population below poverty level:
| Cornell University: | 54.5% |
| Ithaca: | 33.1% |
Median year owner moved in (as recorded in 2022):
| Cornell University: | 2005 |
| Ithaca: | 2007 |
Percentage of married-couple families with both working:
| Cornell University: | 333.3% |
| Ithaca: | 83.1% |
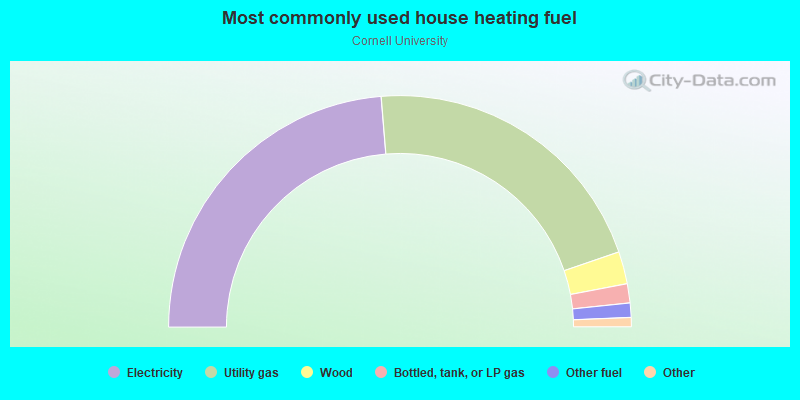
- 47.4%Electricity
- 42.1%Utility gas
- 4.5%Wood
- 2.7%Bottled, tank, or LP gas
- 2.0%Other fuel
- 0.8%Fuel oil, kerosene, etc.
- 0.5%No fuel used
Roads and streets:
Campus Rd
Length: 1.00 miles
Directions: E-W, SE-NW, SW-NE
Directions: E-W, SE-NW, SW-NE
Tower Rd
Length: 0.71 miles
Directions: E-W, SW-NE
Directions: E-W, SW-NE
University Ave
Length: 0.64 miles
Directions: E-W, SW-NE
Address range: 700 to 899
Directions: E-W, SW-NE
Address range: 700 to 899
Central Ave
Length: 0.62 miles
Directions: E-W, N-S, SE-NW, SW-NE
Address range: 1 to 20
Directions: E-W, N-S, SE-NW, SW-NE
Address range: 1 to 20
Forest Home Dr
Length: 0.53 miles
Directions: E-W, SE-NW
Directions: E-W, SE-NW
East Ave
Length: 0.46 miles
Directions: E-W, N-S, SW-NE
Directions: E-W, N-S, SW-NE
Garden Ave
Length: 0.37 miles
Directions: N-S, SE-NW, SW-NE
Directions: N-S, SE-NW, SW-NE
West Ave
Length: 0.37 miles
Directions: E-W, N-S, SE-NW
Address range: 100 to 299
Directions: E-W, N-S, SE-NW
Address range: 100 to 299
Reservoir Ave
Length: 0.32 miles
Directions: E-W, SE-NW
Directions: E-W, SE-NW
Edgemoor Ln
Length: 0.17 miles
Directions: E-W, SW-NE
Address range: 100 to 198
Directions: E-W, SW-NE
Address range: 100 to 198
Sage Ave
Length: 0.17 miles
Directions: N-S, SE-NW
Directions: N-S, SE-NW
McGraw Pl
Length: 0.17 miles
Directions: E-W, N-S, SE-NW
Address range: 1 to 199
Directions: E-W, N-S, SE-NW
Address range: 1 to 199
Stewart Ave
Length: 0.13 miles
Direction: N-S
Address range: 401 to 699
Direction: N-S
Address range: 401 to 699
Hollister Dr
Length: 0.09 miles
Direction: E-W
Direction: E-W
Garden Ave (Bailey Cir)
Length: 0.09 miles
Directions: E-W, N-S, SE-NW
Directions: E-W, N-S, SE-NW
Hoy Rd
Length: 0.08 miles
Direction: N-S
Direction: N-S
Forest Park Ln
Length: 0.08 miles
Directions: N-S, SE-NW
Address range: 1 to 99
Directions: N-S, SE-NW
Address range: 1 to 99
South Ave
Length: 0.06 miles
Direction: E-W
Address range: 1 to 13
Direction: E-W
Address range: 1 to 13
Reservoir Ave (Baker Ave)
Length: 0.05 miles
Direction: E-W
Direction: E-W
Thurston Ave
Length: 0.04 miles
Direction: SW-NE
Direction: SW-NE