City Hall neighborhood in Philadelphia, Pennsylvania (PA), 19107 detailed profile
Settings
X


Business Search - 14 Million verified businesses
Area: 0.019 square miles
Population: 290
Population density:
| City Hall: | 15,123 people per square mile |
| Philadelphia: | 11,602 people per square mile |

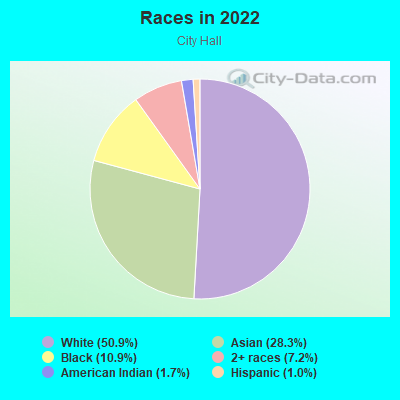
- 14950.9%White
- 8328.3%Asian
- 3210.9%Black
- 217.2%Two or more races
- 51.7%American Indian
- 31.0%Hispanic or Latino
Median household income in 2022:
| City Hall: | $91,500 |
| Philadelphia: | $56,517 |
Distribution of median household income
![Distribution of median household income]()
- 14Less than $10,000
- 14$10,000 to $19,999
- 7$20,000 to $29,999
- 13$30,000 to $39,999
- 5$40,000 to $49,999
- 26$50,000 to $59,999
- 13$60,000 to $74,999
- 35$75,000 to $99,999
- 9$100,000 to $124,999
- 28$125,000 to $149,999
- 26$150,000 to $199,999
- 30$200,000 or more

Distribution of owner-occupied house/condo value
![Distribution of owner-occupied house/condo value]()
- 2$200,000 to $249,999
- 3$300,000 to $399,999
- 4$400,000 to $499,999
- 2$750,000 to $999,999
- 5$1,000,000 or more

Distribution of rent paid by renters
![Distribution of rent paid by renters]()
- 1$100 to $199
- 6$200 to $299
- 2$300 to $399
- 6$400 to $499
- 1$600 to $699
- 4$700 to $799
- 4$800 to $899
- 6$900 to $999
- 7$1,000 to $1,249
- 12$1,250 to $1,499
- 69$1,500 to $1,999
- 108$2,000 or more

Median rent in 2022:
| City Hall: | $2,098 |
| Philadelphia: | $1,073 |
| Males: | 147 |
| Females: | 143 |
Males:
| This neighborhood: | 30.9 years |
| Whole city: | 34.1 years |
| This neighborhood: | 30.9 years |
| Whole city: | 36.3 years |
Average household size:
| City Hall: | 1.4 people |
| Philadelphia: | 2.2 people |
Percentage of family households:
| City Hall: | 16.3% |
| Philadelphia: | 36.5% |
| Here: | 9.5% |
| Philadelphia: | 28.0% |
Percentage of married-couple families with children (among all households):
| City Hall: | 67.2% |
| Philadelphia: | 23.5% |
Percentage of single-mother households (among all households):
| City Hall: | 72.3% |
| Philadelphia: | 17.6% |
Percentage of never married males 15 years old and over:
Percentage of never married females 15 years old and over:
| City Hall: | 37.4% |
| Philadelphia: | 23.9% |
Percentage of never married females 15 years old and over:
| City Hall: | 34.6% |
| city: | 26.0% |
Percentage of people that speak English not well or not at all:
| City Hall: | 3.3% |
| Philadelphia: | 7.0% |
Percentage of people born in this state:
Percentage of people born in another U.S. state:
Percentage of native residents but born outside the U.S.:
Percentage of foreign born residents:
| Here: | 41.2% |
| Philadelphia: | 61.6% |
Percentage of people born in another U.S. state:
| City Hall: | 37.9% |
| Philadelphia: | 18.9% |
Percentage of native residents but born outside the U.S.:
| Here: | 3.3% |
| city: | 3.7% |
Percentage of foreign born residents:
| Here: | 17.6% |
| Philadelphia: | 15.7% |
Owner-occupied
Renter-occupied

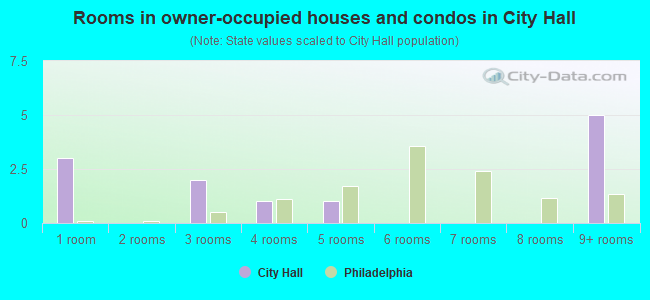
- Rooms in owner-occupied houses and condos in City Hall
- 31 room
- 02 rooms
- 23 rooms
- 14 rooms
- 15 rooms
- 06 rooms
- 07 rooms
- 08 rooms
- 59+ rooms
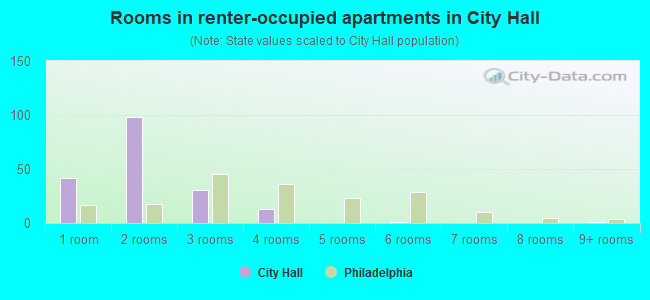
- Rooms in renter-occupied apartments in City Hall
- 421 room
- 982 rooms
- 313 rooms
- 134 rooms
- 05 rooms
- 16 rooms
- 07 rooms
- 08 rooms
- 19+ rooms
Owner-occupied
Renter-occupied
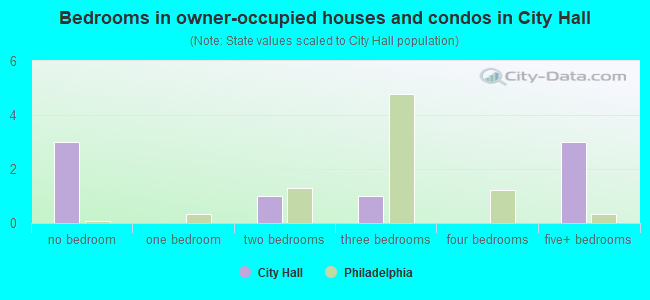
- Bedrooms in owner-occupied houses and condos in City Hall
- 3no bedroom
- 01 bedroom
- 12 bedrooms
- 13 bedrooms
- 04 bedrooms
- 35+ bedrooms
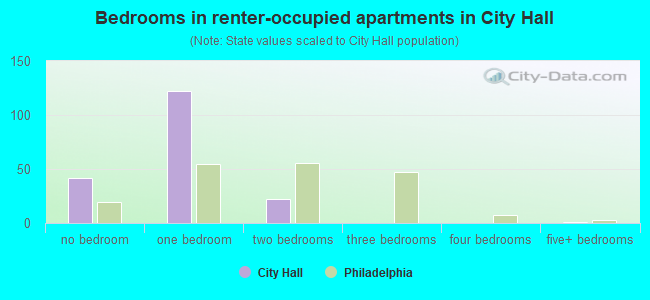
- Bedrooms in renter-occupied apartments in City Hall
- 42no bedroom
- 1221 bedroom
- 222 bedrooms
- 03 bedrooms
- 04 bedrooms
- 15+ bedrooms
Average number of cars or other vehicles available in houses/condos:
Average number of cars or other vehicles available in apartments:
| This neighborhood: | |
| Philadelphia: |
Average number of cars or other vehicles available in apartments:
| Here: | 0.5 |
| city: | 0.8 |
Percentage of units with a mortgage:
| City Hall: | 25.0% |
| Philadelphia: | 58.9% |
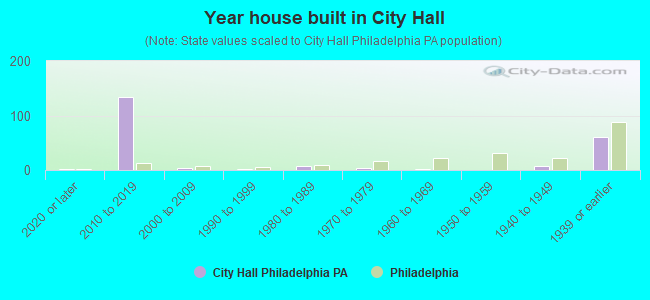
- Year house built in City Hall
- 12020 or later
- 1342010 to 2019
- 32000 to 2009
- 21990 to 1999
- 71980 to 1989
- 31970 to 1979
- 11960 to 1969
- 01950 to 1959
- 71940 to 1949
- 611939 or earlier
City-data.com crime index for city in 2020 (higher means more crime):
| City: | 169.8 |
| U.S. average: | 219.5 |
Travel time to work (commute)
![Travel time to work (commute)]()
- 2Less than 5 minutes
- 145 to 9 minutes
- 1510 to 14 minutes
- 2015 to 19 minutes
- 1720 to 24 minutes
- 625 to 29 minutes
- 1230 to 34 minutes
- 540 to 44 minutes
- 2945 to 59 minutes
- 1260 to 89 minutes
- 190 or more minutes

Means of transportation to work
![Means of transportation to work]()
- 30.3%70Drove a car alone
- 10.0%23Bus
- 4.8%11Subway or elevated rail
- 1.7%4Long-distance train or commuter rail
- 4.3%10Light rail, streetcar or trolley
- 23.8%55Walked
- 0.9%2Other means
- 25.1%58Worked at home

Time leaving home to go to work
![Time leaving home to go to work]()
- 512:00 a.m. to 4:59 a.m.
- 25:00 a.m. to 5:29 a.m.
- 35:30 a.m. to 5:59 a.m.
- 116:00 a.m. to 6:29 a.m.
- 56:30 a.m. to 6:59 a.m.
- 187:00 a.m. to 7:29 a.m.
- 227:30 a.m. to 7:59 a.m.
- 118:00 a.m. to 8:29 a.m.
- 108:30 a.m. to 8:59 a.m.
- 159:00 a.m. to 9:59 a.m.
- 110:00 a.m. to 10:59 a.m.
- 512:00 p.m. to 3:59 p.m.
- 94:00 p.m. to 11:59 p.m.

Occupations of males:
- Percentage of males in management occupations (except farmers):
Here: 33.9% city: 9.1%
- Percentage of males in business and financial operations occupations:
Here: 21.0% city: 6.0%
- Percentage of males in computer and mathematical occupations:
Here: 3.1% city: 4.6%
- Percentage of males in architecture and engineering occupations:
Here: 4.5% city: 2.4%
- Percentage of males in community and social services occupations:
Here: 3.0% city: 1.9%
- Percentage of males in arts, design, entertainment, sports, and media occupations:
Here: 12.3% city: 2.5%
- Percentage of males in healthcare practitioners and technical occupations:
Here: 15.6% city: 4.3%
- Percentage of males in service occupations:
Here: 2.7% city: 19.3%
- Percentage of males in sales and office occupations:
Here: 3.9% city: 14.1%
- Percentage of males in construction, extraction, and maintenance occupations:
Here: 2.2% city: 6.4%
- Percentage of males in transportation occupations:
Here: 2.4% city: 6.9%
Occupations of females:
- Percentage of females in management occupations (except farmers):
Here: 16.6% city: 9.1%
- Percentage of females in business and financial operations occupations:
Here: 5.3% city: 6.6%
- Percentage of females in computer and mathematical occupations:
Here: 2.8% city: 1.7%
- Percentage of females in architecture and engineering occupations:
Here: 5.3% city: 0.7%
- Percentage of females in community and social services occupations:
Here: 2.8% city: 3.6%
- Percentage of females in legal occupations:
Here: 3.9% city: 1.9%
- Percentage of females in education, training, and library occupations:
Here: 1.2% city: 8.5%
- Percentage of females in arts, design, entertainment, sports, and media occupations:
Here: 6.1% city: 2.4%
- Percentage of females in healthcare practitioners and technical occupations:
Here: 31.0% city: 10.3%
- Percentage of females in service occupations:
Here: 5.5% city: 24.4%
- Percentage of females in sales and office occupations:
Here: 28.5% city: 23.4%
- Percentage of females in production occupations:
Here: 2.3% city: 2.4%
- Percentage of females in transportation occupations:
Here: 1.6% city: 1.1%
Percentage of people 16-64 in Armed Forces:
| City Hall: | 0.6% |
| Philadelphia: | 0.1% |
Education in this neighborhood (subdivision or community):
- Percentage of people 3 years and older in K-12 schools:
City Hall: 4.9% Philadelphia: 15.6%
- Percentage of people 3 years and older in undergraduate colleges:
City Hall: 8.4% Philadelphia: 6.0%
- Percentage of people 3 years and older in grad. or professional schools:
City Hall: 13.6% Philadelphia: 2.8%
- Percentage of students K-12 enrolled in private schools:
City Hall: 42.9% Philadelphia: 25.0%
Percentage of population below poverty level:
| City Hall: | 21.8% |
| Philadelphia: | 21.7% |
Percentage of married-couple families with both working:
| City Hall: | 100.0% |
| Philadelphia: | 71.4% |
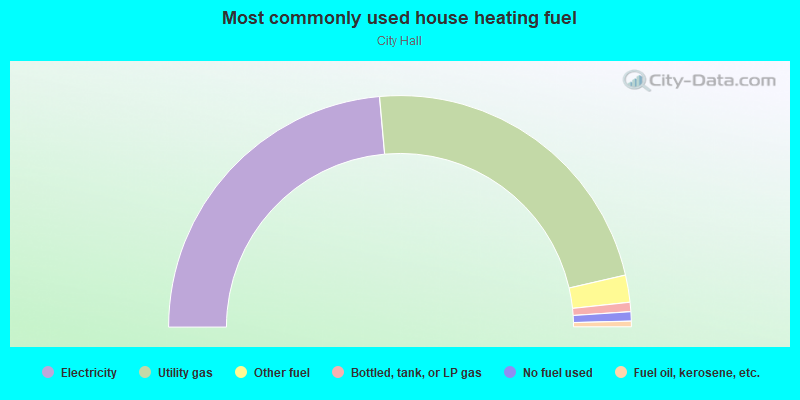
- 47.3%Electricity
- 45.7%Utility gas
- 3.8%Other fuel
- 1.3%Bottled, tank, or LP gas
- 1.3%No fuel used
- 0.8%Fuel oil, kerosene, etc.
Highways in this neighborhood:
State Rte 611 (State Rte 3, E Penn Sq)
Length: 0.12 miles
Directions: N-S, SW-NE
Address range: 1 to 34
Directions: N-S, SW-NE
Address range: 1 to 34
John F Kennedy Blvd (State Rte 3, State Rte 611)
Length: 0.11 miles
Direction: E-W
Address range: 1319 to 1432
Direction: E-W
Address range: 1319 to 1432
State Rte 3 (State Rte 611, S Penn Sq)
Length: 0.09 miles
Direction: E-W
Address range: 1325 to 1367
Direction: E-W
Address range: 1325 to 1367