Cascade Park Apartments neighborhood in Mesquite, Texas (TX), 75149 detailed profile
Settings
X


Business Search - 14 Million verified businesses
Area: 0.022 square miles
Population: 440
Population density:
| Cascade Park Apartments: | 19,785 people per square mile |
| Mesquite: | 3,403 people per square mile |

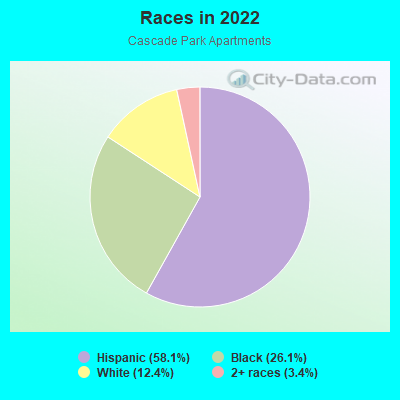
- 25458.1%Hispanic or Latino
- 11426.1%Black
- 5412.4%White
- 153.4%Two or more races
Median household income in 2022:
| Cascade Park Apartments: | $64,491 |
| Mesquite: | $68,134 |
Distribution of median household income
![Distribution of median household income]()
- 2Less than $10,000
- 24$10,000 to $19,999
- 4$20,000 to $29,999
- 14$30,000 to $39,999
- 14$40,000 to $49,999
- 8$50,000 to $59,999
- 29$60,000 to $74,999
- 24$75,000 to $99,999
- 14$100,000 to $124,999
- 5$125,000 to $149,999
- 1$150,000 to $199,999
- 2$200,000 or more

Distribution of owner-occupied house/condo value
![Distribution of owner-occupied house/condo value]()
- 1Less than $50,000
- 7$50,000 to $99,999
- 10$100,000 to $149,999
- 33$150,000 to $199,999
- 27$200,000 to $249,999
- 2$250,000 to $299,999

Distribution of rent paid by renters
![Distribution of rent paid by renters]()
- 5$700 to $799
- 19$800 to $899
- 16$900 to $999
- 15$1,000 to $1,249
- 5$1,250 to $1,499

Median rent in 2022:
| Cascade Park Apartments: | $939 |
| Mesquite: | $1,156 |
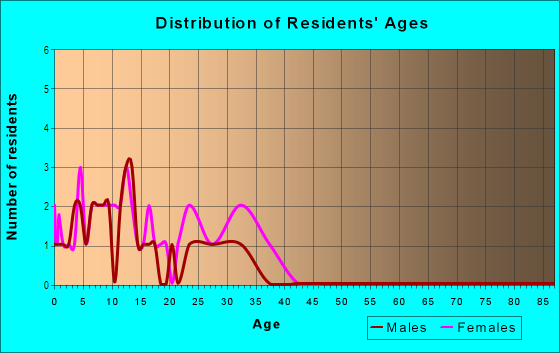
| Males: | 191 |
| Females: | 248 |
Males:
| This neighborhood: | 13.5 years |
| Whole city: | 30.8 years |
| This neighborhood: | 28.1 years |
| Whole city: | 33.8 years |
Average household size:
| Cascade Park Apartments: | 3.4 people |
| Mesquite: | 2.9 people |
Percentage of family households:
| Cascade Park Apartments: | 64.4% |
| Mesquite: | 55.6% |
| Here: | 40.0% |
| Mesquite: | 43.4% |
Percentage of married-couple families with children (among all households):
| Cascade Park Apartments: | 10.9% |
| Mesquite: | 20.2% |
Percentage of single-mother households (among all households):
| Cascade Park Apartments: | 18.6% |
| Mesquite: | 12.3% |
Percentage of never married males 15 years old and over:
Percentage of never married females 15 years old and over:
| Cascade Park Apartments: | 4.8% |
| Mesquite: | 20.1% |
Percentage of never married females 15 years old and over:
| Cascade Park Apartments: | 34.8% |
| city: | 18.2% |
Percentage of people that speak English not well or not at all:
| Cascade Park Apartments: | 15.9% |
| Mesquite: | 8.1% |
Percentage of people born in this state:
Percentage of people born in another U.S. state:
Percentage of native residents but born outside the U.S.:
Percentage of foreign born residents:
| Here: | 55.3% |
| Mesquite: | 62.9% |
Percentage of people born in another U.S. state:
| Cascade Park Apartments: | 21.6% |
| Mesquite: | 17.6% |
Percentage of native residents but born outside the U.S.:
| Here: | 2.5% |
| city: | 1.3% |
Percentage of foreign born residents:
| Here: | 20.6% |
| Mesquite: | 18.2% |
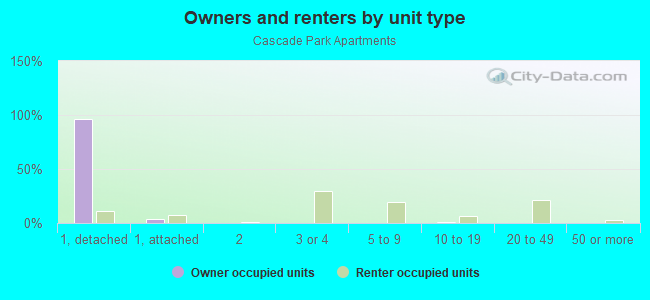
Owner-occupied
Renter-occupied

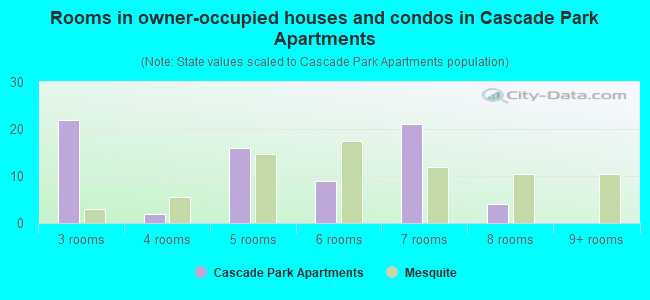
- Rooms in owner-occupied houses and condos in Cascade Park Apartments
- 01 room
- 02 rooms
- 223 rooms
- 24 rooms
- 165 rooms
- 96 rooms
- 217 rooms
- 48 rooms
- 09+ rooms
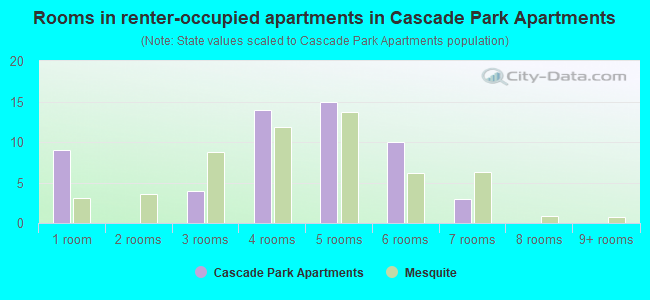
- Rooms in renter-occupied apartments in Cascade Park Apartments
- 91 room
- 02 rooms
- 43 rooms
- 144 rooms
- 155 rooms
- 106 rooms
- 37 rooms
- 08 rooms
- 09+ rooms
Owner-occupied
Renter-occupied
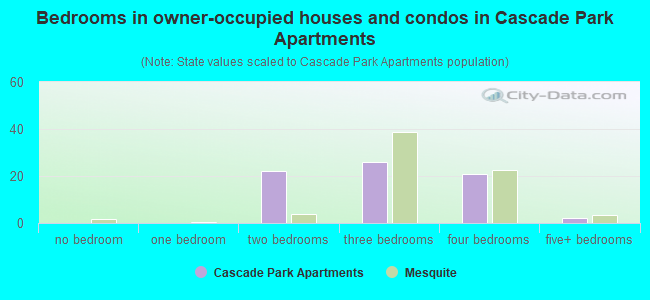
- Bedrooms in owner-occupied houses and condos in Cascade Park Apartments
- 0no bedroom
- 01 bedroom
- 222 bedrooms
- 263 bedrooms
- 214 bedrooms
- 25+ bedrooms
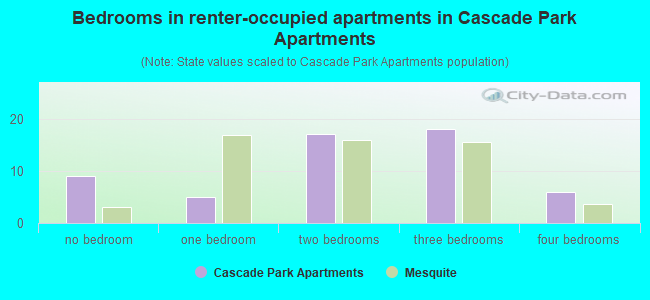
- Bedrooms in renter-occupied apartments in Cascade Park Apartments
- 9no bedroom
- 51 bedroom
- 172 bedrooms
- 183 bedrooms
- 64 bedrooms
- 05+ bedrooms
Average number of cars or other vehicles available in houses/condos:
Average number of cars or other vehicles available in apartments:
| This neighborhood: | 1.7 |
| Mesquite: | 2.2 |
Average number of cars or other vehicles available in apartments:
| Here: | 1.7 |
| city: | 1.6 |
Percentage of units with a mortgage:
| Cascade Park Apartments: | 40.9% |
| Mesquite: | 62.3% |
Average estimated value of detached houses in 2022 (62.1% of all units):
| Cascade Park Apartments: | $178,727 |
| Texas: | $369,058 |
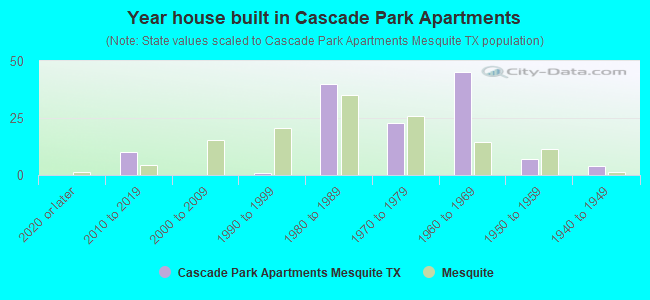
- Year house built in Cascade Park Apartments
- 02020 or later
- 102010 to 2019
- 02000 to 2009
- 11990 to 1999
- 401980 to 1989
- 231970 to 1979
- 451960 to 1969
- 71950 to 1959
- 41940 to 1949
- 01939 or earlier
City-data.com crime index for city in 2020 (higher means more crime):
| City: | 322.7 |
| U.S. average: | 219.5 |
Travel time to work (commute)
![Travel time to work (commute)]()
- 1Less than 5 minutes
- 35 to 9 minutes
- 310 to 14 minutes
- 515 to 19 minutes
- 720 to 24 minutes
- 425 to 29 minutes
- 1530 to 34 minutes
- 240 to 44 minutes
- 1945 to 59 minutes
- 660 to 89 minutes
- 690 or more minutes

Means of transportation to work
![Means of transportation to work]()
- 78.7%154Drove a car alone
- 15.8%31Carpooled
- 4.6%9Walked
- 0.5%1Worked at home

Time leaving home to go to work
![Time leaving home to go to work]()
- 212:00 a.m. to 4:59 a.m.
- 65:00 a.m. to 5:29 a.m.
- 15:30 a.m. to 5:59 a.m.
- 86:00 a.m. to 6:29 a.m.
- 56:30 a.m. to 6:59 a.m.
- 87:00 a.m. to 7:29 a.m.
- 17:30 a.m. to 7:59 a.m.
- 118:00 a.m. to 8:29 a.m.
- 68:30 a.m. to 8:59 a.m.
- 19:00 a.m. to 9:59 a.m.
- 111:00 a.m. to 11:59 a.m.
- 512:00 p.m. to 3:59 p.m.
- 44:00 p.m. to 11:59 p.m.

Occupations of males:
- Percentage of males in management occupations (except farmers):
Here: 7.3% city: 7.0%
- Percentage of males in education, training, and library occupations:
Here: 1.3% city: 2.4%
- Percentage of males in arts, design, entertainment, sports, and media occupations:
Here: 1.7% city: 0.8%
- Percentage of males in service occupations:
Here: 3.5% city: 13.7%
- Percentage of males in sales and office occupations:
Here: 9.1% city: 16.2%
- Percentage of males in construction, extraction, and maintenance occupations:
Here: 71.3% city: 19.2%
- Percentage of males in production occupations:
Here: 4.3% city: 5.8%
- Percentage of males in transportation occupations:
Here: 1.7% city: 9.4%
- Percentage of males in material moving occupations:
Here: 2.5% city: 8.6%
Occupations of females:
- Percentage of females in management occupations (except farmers):
Here: 12.0% city: 7.4%
- Percentage of females in education, training, and library occupations:
Here: 9.1% city: 7.9%
- Percentage of females in healthcare practitioners and technical occupations:
Here: 3.4% city: 6.0%
- Percentage of females in service occupations:
Here: 58.2% city: 24.6%
- Percentage of females in sales and office occupations:
Here: 5.6% city: 34.0%
- Percentage of females in material moving occupations:
Here: 11.8% city: 3.9%
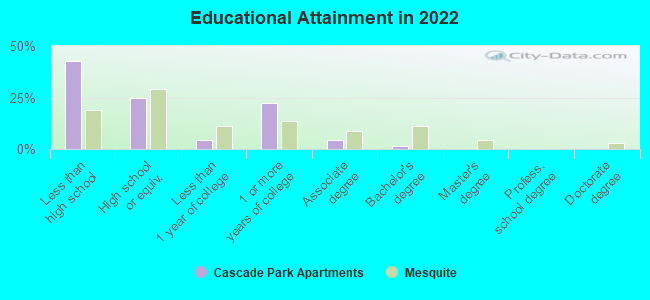
Education in this neighborhood (subdivision or community):
- Percentage of people 3 years and older in K-12 schools:
Cascade Park Apartments: 29.6% Mesquite: 23.2%
- Percentage of people 3 years and older in undergraduate colleges:
Cascade Park Apartments: 9.9% Mesquite: 4.1%
- Percentage of people 3 years and older in grad. or professional schools:
Cascade Park Apartments: 0.0% Mesquite: 0.7%
- Percentage of students K-12 enrolled in private schools:
Cascade Park Apartments: 0.0% Mesquite: 7.3%
Percentage of population below poverty level:
| Cascade Park Apartments: | 12.4% |
| Mesquite: | 11.8% |
Median year owner moved in (as recorded in 2022):
Median year renter moved in (as recorded in 2022):
| Cascade Park Apartments: | 2003 |
| Mesquite: | 2010 |
Median year renter moved in (as recorded in 2022):
| Cascade Park Apartments: | 2015 |
| Mesquite: | 2020 |
Percentage of married-couple families with both working:
| Cascade Park Apartments: | 7.8% |
| Mesquite: | 64.1% |
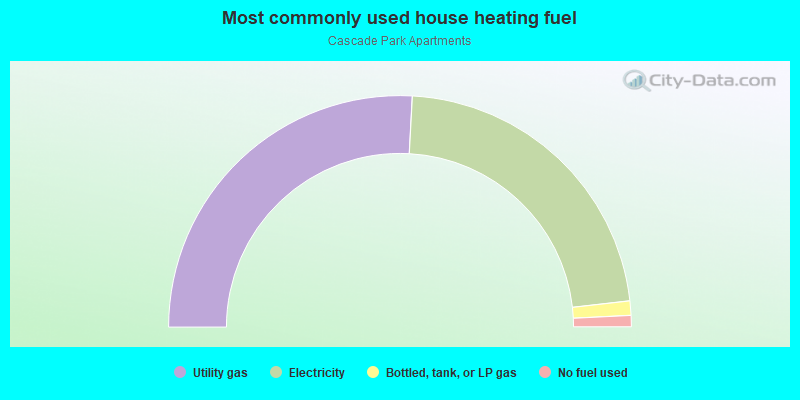
- 51.7%Utility gas
- 44.7%Electricity
- 2.0%Bottled, tank, or LP gas
- 1.6%No fuel used
Roads and streets:
Embassy Dr
Length: 0.12 miles
Directions: E-W, N-S
Address range: 942 to 999
Directions: E-W, N-S
Address range: 942 to 999
Embassy St
Length: 0.02 miles
Direction: E-W
Address range: 996 to 999
Direction: E-W
Address range: 996 to 999