Bon Ton neighborhood in Bozeman, Montana (MT), 59715 detailed profile
Settings
X

Business Search - 14 Million verified businesses
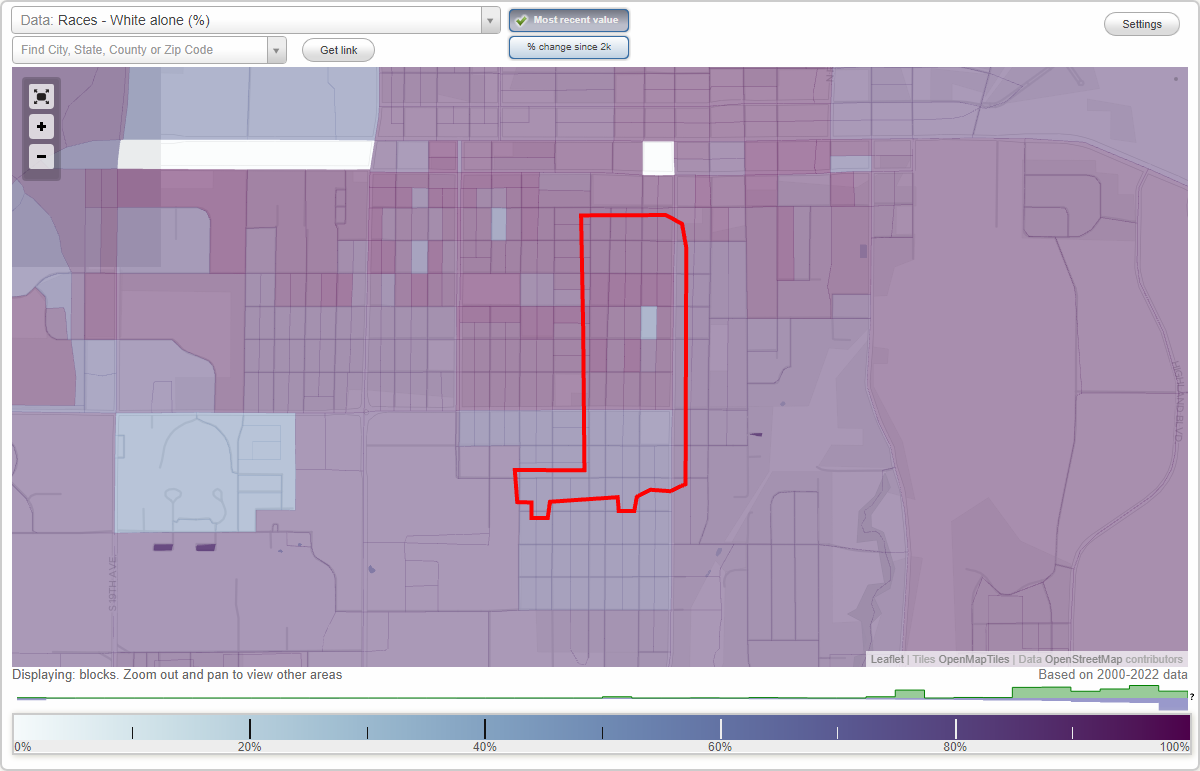
Area: 0.134 square miles
Population: 738
Population density:
| Bon Ton: | 5,513 people per square mile |
| Bozeman: | 4,247 people per square mile |

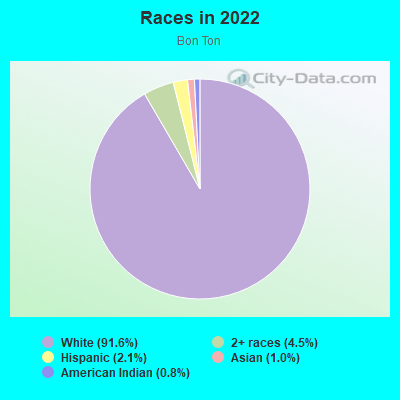
- 69891.6%White
- 344.5%Two or more races
- 162.1%Hispanic or Latino
- 81.0%Asian
- 60.8%American Indian
Median household income in 2022:
| Bon Ton: | $72,859 |
| Bozeman: | $74,113 |
Distribution of median household income
![Distribution of median household income]()
- 21Less than $10,000
- 39$10,000 to $19,999
- 44$20,000 to $29,999
- 78$30,000 to $39,999
- 38$40,000 to $49,999
- 31$50,000 to $59,999
- 29$60,000 to $74,999
- 56$75,000 to $99,999
- 22$100,000 to $124,999
- 24$125,000 to $149,999
- 34$150,000 to $199,999
- 87$200,000 or more

Distribution of owner-occupied house/condo value
![Distribution of owner-occupied house/condo value]()
- 6$50,000 to $99,999
- 4$100,000 to $149,999
- 6$200,000 to $249,999
- 12$300,000 to $399,999
- 29$400,000 to $499,999
- 58$500,000 to $749,999
- 69$750,000 to $999,999
- 90$1,000,000 or more

Distribution of rent paid by renters
![Distribution of rent paid by renters]()
- 21$100 to $199
- 9$200 to $299
- 8$400 to $499
- 18$500 to $599
- 38$600 to $699
- 44$700 to $799
- 18$800 to $899
- 30$900 to $999
- 39$1,000 to $1,249
- 22$1,250 to $1,499
- 17$1,500 to $1,999
- 52$2,000 or more

Median rent in 2022:
| Bon Ton: | $1,047 |
| Bozeman: | $1,343 |
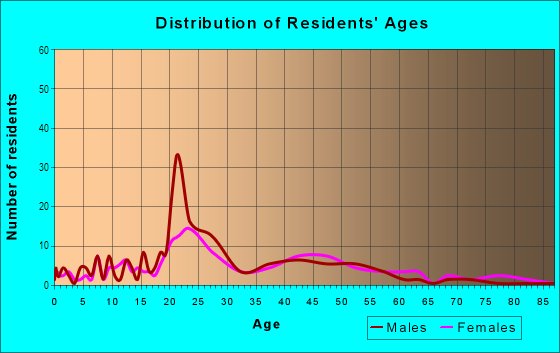
| Males: | 370 |
| Females: | 368 |
Males:
| This neighborhood: | 40.6 years |
| Whole city: | 27.8 years |
| This neighborhood: | 30.7 years |
| Whole city: | 28.9 years |
Average household size:
| Bon Ton: | 1.8 people |
| Bozeman: | 2.2 people |
Percentage of family households:
| Bon Ton: | 21.0% |
| Bozeman: | 36.1% |
| Here: | 28.6% |
| Bozeman: | 36.1% |
Percentage of married-couple families with children (among all households):
| Bon Ton: | 43.7% |
| Bozeman: | 31.7% |
Percentage of single-mother households (among all households):
| Bon Ton: | 58.9% |
| Bozeman: | 7.0% |
Percentage of never married males 15 years old and over:
Percentage of never married females 15 years old and over:
| Bon Ton: | 25.3% |
| Bozeman: | 30.7% |
Percentage of never married females 15 years old and over:
| Bon Ton: | 29.0% |
| city: | 22.0% |
Percentage of people that speak English not well or not at all:
| Bon Ton: | 0.2% |
| Bozeman: | 0.1% |
Percentage of people born in this state:
Percentage of people born in another U.S. state:
Percentage of native residents but born outside the U.S.:
Percentage of foreign born residents:
| Here: | 21.7% |
| Bozeman: | 29.8% |
Percentage of people born in another U.S. state:
| Bon Ton: | 72.5% |
| Bozeman: | 64.7% |
Percentage of native residents but born outside the U.S.:
| Here: | 0.5% |
| city: | 0.8% |
Percentage of foreign born residents:
| Here: | 5.2% |
| Bozeman: | 4.6% |
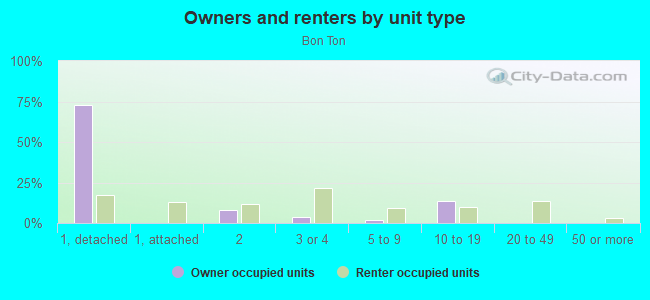
Owner-occupied
Renter-occupied

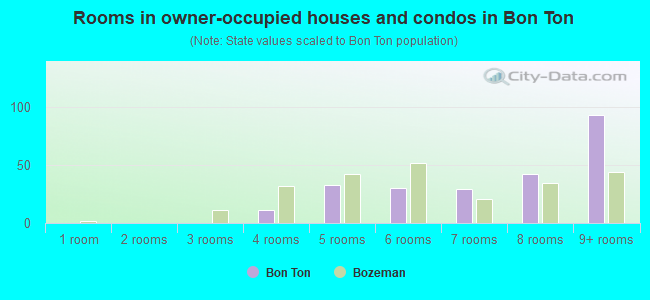
- Rooms in owner-occupied houses and condos in Bon Ton
- 01 room
- 02 rooms
- 03 rooms
- 114 rooms
- 335 rooms
- 306 rooms
- 297 rooms
- 428 rooms
- 939+ rooms
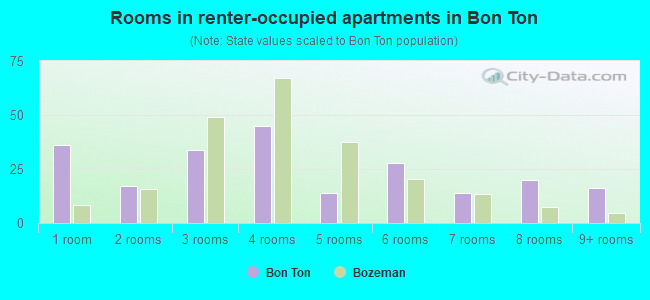
- Rooms in renter-occupied apartments in Bon Ton
- 361 room
- 172 rooms
- 343 rooms
- 454 rooms
- 145 rooms
- 286 rooms
- 147 rooms
- 208 rooms
- 169+ rooms
Owner-occupied
Renter-occupied
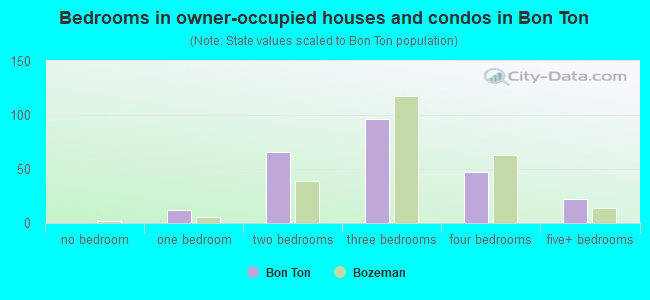
- Bedrooms in owner-occupied houses and condos in Bon Ton
- 0no bedroom
- 121 bedroom
- 662 bedrooms
- 963 bedrooms
- 474 bedrooms
- 225+ bedrooms
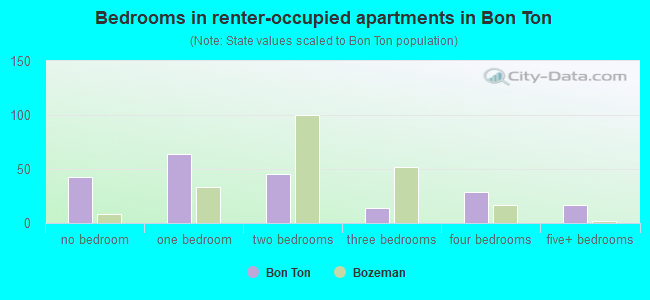
- Bedrooms in renter-occupied apartments in Bon Ton
- 43no bedroom
- 641 bedroom
- 452 bedrooms
- 143 bedrooms
- 294 bedrooms
- 175+ bedrooms
Average number of cars or other vehicles available in houses/condos:
Average number of cars or other vehicles available in apartments:
| This neighborhood: | 2.0 |
| Bozeman: | 2.0 |
Average number of cars or other vehicles available in apartments:
| Here: | 1.5 |
| city: | 1.8 |
Percentage of units with a mortgage:
| Bon Ton: | 36.5% |
| Bozeman: | 64.5% |
Average estimated value of detached houses in 2022 (64.4% of all units):
| Bon Ton: | $963,741 |
| Bozeman: | $664,180 |
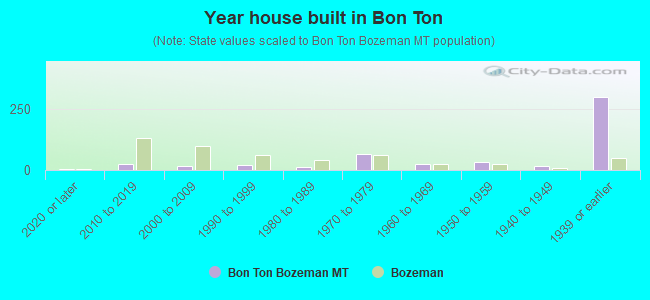
- Year house built in Bon Ton
- 52020 or later
- 232010 to 2019
- 152000 to 2009
- 201990 to 1999
- 111980 to 1989
- 641970 to 1979
- 241960 to 1969
- 311950 to 1959
- 151940 to 1949
- 2971939 or earlier
City-data.com crime index for city in 2020 (higher means more crime):
| City: | 160.5 |
| U.S. average: | 219.5 |
Travel time to work (commute)
![Travel time to work (commute)]()
- 35Less than 5 minutes
- 1905 to 9 minutes
- 9610 to 14 minutes
- 10915 to 19 minutes
- 5420 to 24 minutes
- 825 to 29 minutes
- 830 to 34 minutes
- 1745 to 59 minutes
- 2160 to 89 minutes
- 2590 or more minutes

Means of transportation to work
![Means of transportation to work]()
- 34.1%160Drove a car alone
- 16.0%75Carpooled
- 1.1%5Bus
- 9.2%43Bicycle
- 17.1%80Walked
- 13.9%65Other means
- 19.4%91Worked at home

Time leaving home to go to work
![Time leaving home to go to work]()
- 105:00 a.m. to 5:29 a.m.
- 45:30 a.m. to 5:59 a.m.
- 46:00 a.m. to 6:29 a.m.
- 556:30 a.m. to 6:59 a.m.
- 317:00 a.m. to 7:29 a.m.
- 1027:30 a.m. to 7:59 a.m.
- 848:00 a.m. to 8:29 a.m.
- 798:30 a.m. to 8:59 a.m.
- 729:00 a.m. to 9:59 a.m.
- 1610:00 a.m. to 10:59 a.m.
- 1611:00 a.m. to 11:59 a.m.
- 6812:00 p.m. to 3:59 p.m.
- 214:00 p.m. to 11:59 p.m.

Occupations of males:
- Percentage of males in management occupations (except farmers):
Here: 11.6% city: 14.6%
- Percentage of males in business and financial operations occupations:
Here: 3.1% city: 4.5%
- Percentage of males in computer and mathematical occupations:
Here: 2.8% city: 4.5%
- Percentage of males in architecture and engineering occupations:
Here: 10.0% city: 3.6%
- Percentage of males in life, physical, and social science occupations:
Here: 4.0% city: 3.2%
- Percentage of males in community and social services occupations:
Here: 11.6% city: 1.1%
- Percentage of males in education, training, and library occupations:
Here: 14.0% city: 6.7%
- Percentage of males in arts, design, entertainment, sports, and media occupations:
Here: 8.0% city: 4.9%
- Percentage of males in healthcare practitioners and technical occupations:
Here: 11.8% city: 3.5%
- Percentage of males in service occupations:
Here: 13.8% city: 13.7%
- Percentage of males in sales and office occupations:
Here: 2.1% city: 13.3%
- Percentage of males in farming, fishing, and forestry occupations:
Here: 1.1% city: 1.3%
- Percentage of males in production occupations:
Here: 1.3% city: 5.8%
- Percentage of males in transportation occupations:
Here: 4.0% city: 2.1%
Occupations of females:
- Percentage of females in management occupations (except farmers):
Here: 11.5% city: 11.1%
- Percentage of females in business and financial operations occupations:
Here: 6.5% city: 4.5%
- Percentage of females in computer and mathematical occupations:
Here: 2.9% city: 2.6%
- Percentage of females in life, physical, and social science occupations:
Here: 5.2% city: 3.6%
- Percentage of females in community and social services occupations:
Here: 6.7% city: 1.9%
- Percentage of females in education, training, and library occupations:
Here: 16.3% city: 9.7%
- Percentage of females in arts, design, entertainment, sports, and media occupations:
Here: 2.9% city: 3.9%
- Percentage of females in healthcare practitioners and technical occupations:
Here: 4.0% city: 7.3%
- Percentage of females in service occupations:
Here: 20.5% city: 24.4%
- Percentage of females in sales and office occupations:
Here: 17.5% city: 22.1%
- Percentage of females in production occupations:
Here: 1.1% city: 2.9%
- Percentage of females in transportation occupations:
Here: 4.5% city: 0.6%
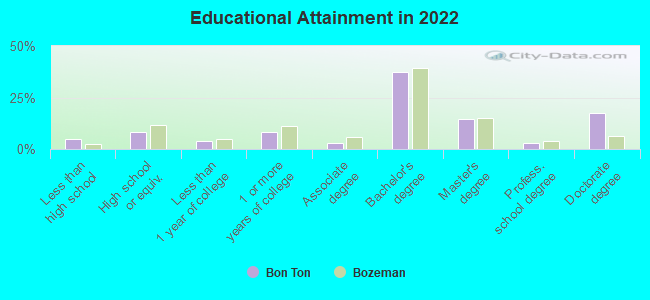
Education in this neighborhood (subdivision or community):
- Percentage of people 3 years and older in K-12 schools:
Bon Ton: 8.2% Bozeman: 9.9%
- Percentage of people 3 years and older in undergraduate colleges:
Bon Ton: 10.9% Bozeman: 20.9%
- Percentage of people 3 years and older in grad. or professional schools:
Bon Ton: 2.7% Bozeman: 4.4%
- Percentage of students K-12 enrolled in private schools:
Bon Ton: 0.0% Bozeman: 16.6%
Percentage of population below poverty level:
| Bon Ton: | 17.7% |
| Bozeman: | 14.7% |
Median year owner moved in (as recorded in 2022):
Median year renter moved in (as recorded in 2022):
| Bon Ton: | 2005 |
| Bozeman: | 2013 |
Median year renter moved in (as recorded in 2022):
| Bon Ton: | 2018 |
| Bozeman: | 2019 |
Percentage of married-couple families with both working:
| Bon Ton: | 53.2% |
| Bozeman: | 73.5% |
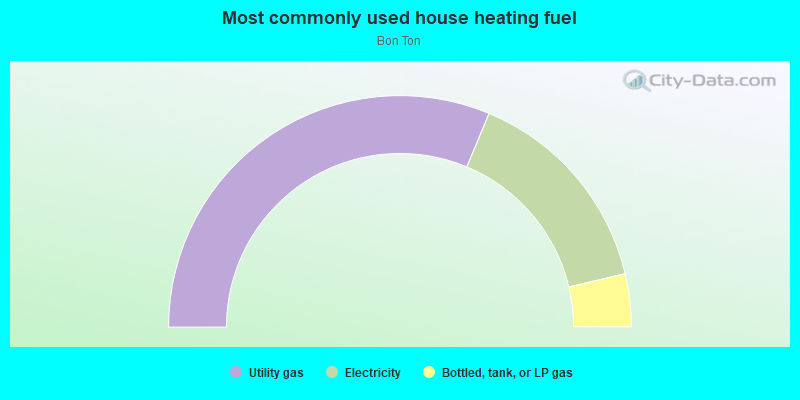
- 62.6%Utility gas
- 30.0%Electricity
- 7.4%Bottled, tank, or LP gas
Roads and streets:
S 4th Ave
Length: 0.52 miles
Direction: N-S
Address range: 252 to 999
Direction: N-S
Address range: 252 to 999
S 3rd Ave
Length: 0.49 miles
Direction: N-S
Address range: 300 to 999
Direction: N-S
Address range: 300 to 999
S Grand Ave
Length: 0.49 miles
Direction: N-S
Address range: 300 to 999
Direction: N-S
Address range: 300 to 999
S Willson Ave
Length: 0.49 miles
Direction: N-S
Address range: 300 to 999
Direction: N-S
Address range: 300 to 999
W Cleveland St
Length: 0.45 miles
Direction: E-W
Address range: 100 to 599
Direction: E-W
Address range: 100 to 599
W Curtiss St
Length: 0.25 miles
Direction: E-W
Address range: 100 to 399
Direction: E-W
Address range: 100 to 399
W Story St
Length: 0.25 miles
Direction: E-W
Address range: 100 to 399
Direction: E-W
Address range: 100 to 399
W Koch St
Length: 0.25 miles
Direction: E-W
Address range: 100 to 399
Direction: E-W
Address range: 100 to 399
W Dickerson St
Length: 0.25 miles
Direction: E-W
Address range: 100 to 399
Direction: E-W
Address range: 100 to 399
W College St
Length: 0.25 miles
Direction: E-W
Address range: 100 to 399
Direction: E-W
Address range: 100 to 399
W Alderson St
Length: 0.25 miles
Direction: E-W
Address range: 100 to 399
Direction: E-W
Address range: 100 to 399
W Harrison St
Length: 0.24 miles
Direction: E-W
Address range: 100 to 399
Direction: E-W
Address range: 100 to 399