Beaver Dam neighborhood in Pennsville, New Jersey (NJ), 08070 detailed profile
Settings
X


Business Search - 14 Million verified businesses
Area: 1.651 square miles
Population: 945
Population density:
| Beaver Dam: | 572 people per square mile |
| Pennsville: | 1,170 people per square mile |

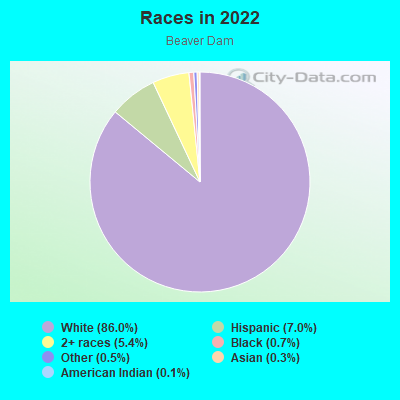
- 81486.0%White
- 667.0%Hispanic or Latino
- 515.4%Two or more races
- 70.7%Black
- 50.5%Some other race
- 30.3%Asian
- 10.1%American Indian
Median household income in 2022:
| Beaver Dam: | $76,112 |
| Pennsville: | $76,009 |
Distribution of median household income
![Distribution of median household income]()
- 4Less than $10,000
- 47$10,000 to $19,999
- 45$20,000 to $29,999
- 16$30,000 to $39,999
- 33$40,000 to $49,999
- 9$50,000 to $59,999
- 59$60,000 to $74,999
- 65$75,000 to $99,999
- 26$100,000 to $124,999
- 48$125,000 to $149,999
- 32$150,000 to $199,999
- 48$200,000 or more

Distribution of owner-occupied house/condo value
![Distribution of owner-occupied house/condo value]()
- 39Less than $50,000
- 83$50,000 to $99,999
- 16$100,000 to $149,999
- 84$150,000 to $199,999
- 65$200,000 to $249,999
- 15$250,000 to $299,999
- 41$300,000 to $399,999
- 8$400,000 to $499,999
- 1$500,000 to $749,999
- 2$750,000 to $999,999
- 10$1,000,000 or more

Distribution of rent paid by renters
![Distribution of rent paid by renters]()
- 8$200 to $299
- 3$300 to $399
- 1$500 to $599
- 11$600 to $699
- 56$700 to $799
- 23$800 to $899
- 21$900 to $999
- 7$1,000 to $1,249
- 10$1,250 to $1,499
- 2$1,500 to $1,999
- 2$2,000 or more

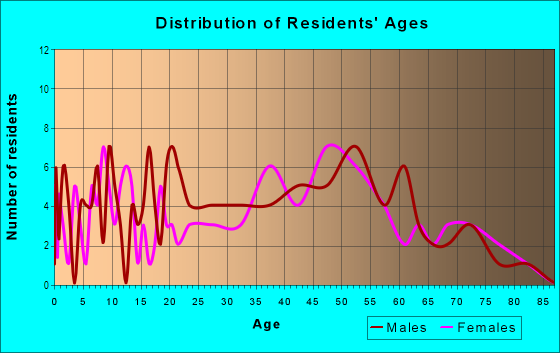
| Males: | 496 |
| Females: | 449 |
Males:
| This neighborhood: | 42.6 years |
| Whole city: | 37.0 years |
| This neighborhood: | 52.2 years |
| Whole city: | 44.8 years |
Average household size:
| Beaver Dam: | 2.4 people |
| Pennsville: | 2.5 people |
Percentage of family households:
| Beaver Dam: | 34.8% |
| Pennsville: | 42.5% |
| Here: | 41.3% |
| Pennsville: | 38.8% |
Percentage of married-couple families with children (among all households):
| Beaver Dam: | 37.3% |
| Pennsville: | 23.5% |
Percentage of single-mother households (among all households):
| Beaver Dam: | 12.4% |
| Pennsville: | 11.9% |
Percentage of never married males 15 years old and over:
Percentage of never married females 15 years old and over:
| Beaver Dam: | 20.5% |
| Pennsville: | 19.7% |
Percentage of never married females 15 years old and over:
| Beaver Dam: | 13.7% |
| place: | 15.8% |
Percentage of people that speak English not well or not at all:
| Beaver Dam: | 0.0% |
| Pennsville: | 0.6% |
Percentage of people born in this state:
Percentage of people born in another U.S. state:
Percentage of native residents but born outside the U.S.:
Percentage of foreign born residents:
| Here: | 57.7% |
| Pennsville: | 57.4% |
Percentage of people born in another U.S. state:
| Beaver Dam: | 39.6% |
| Pennsville: | 39.1% |
Percentage of native residents but born outside the U.S.:
| Here: | 0.6% |
| place: | 0.9% |
Percentage of foreign born residents:
| Here: | 2.1% |
| Pennsville: | 2.5% |
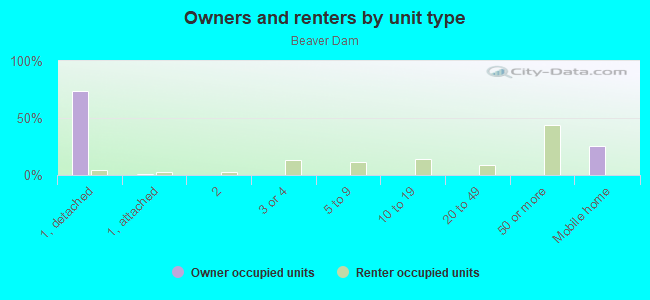
Owner-occupied
Renter-occupied

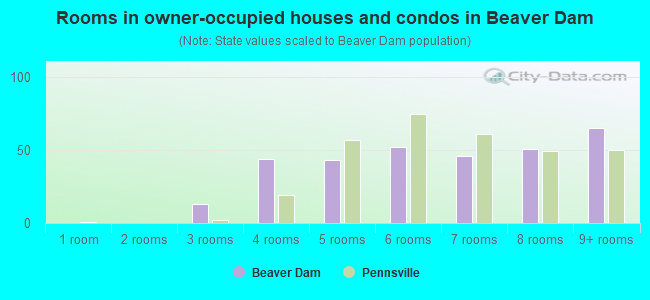
- Rooms in owner-occupied houses and condos in Beaver Dam
- 01 room
- 02 rooms
- 133 rooms
- 444 rooms
- 435 rooms
- 526 rooms
- 467 rooms
- 518 rooms
- 659+ rooms
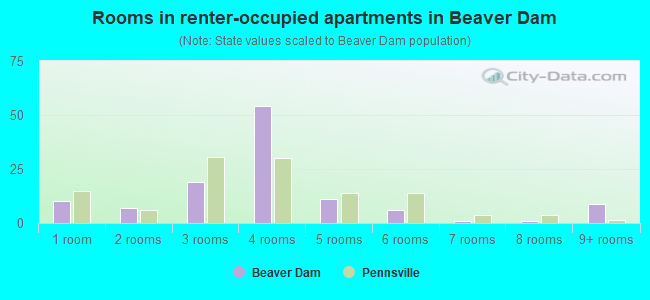
- Rooms in renter-occupied apartments in Beaver Dam
- 101 room
- 72 rooms
- 193 rooms
- 544 rooms
- 115 rooms
- 66 rooms
- 17 rooms
- 18 rooms
- 99+ rooms
Owner-occupied
Renter-occupied
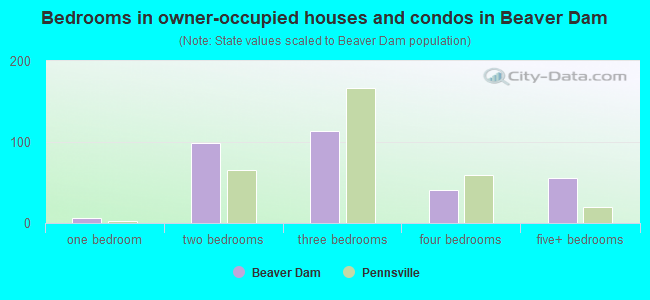
- Bedrooms in owner-occupied houses and condos in Beaver Dam
- 0no bedroom
- 61 bedroom
- 992 bedrooms
- 1133 bedrooms
- 414 bedrooms
- 555+ bedrooms
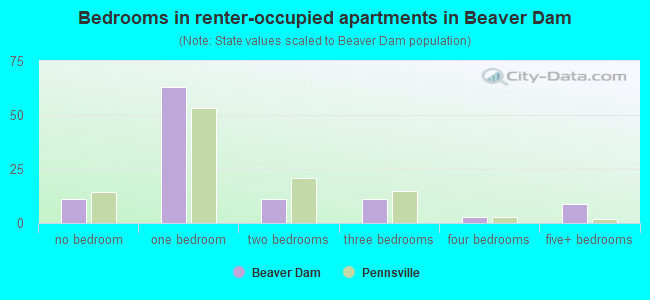
- Bedrooms in renter-occupied apartments in Beaver Dam
- 11no bedroom
- 631 bedroom
- 112 bedrooms
- 113 bedrooms
- 34 bedrooms
- 95+ bedrooms
Average number of cars or other vehicles available in houses/condos:
Average number of cars or other vehicles available in apartments:
| This neighborhood: | 2.1 |
| Pennsville: | 2.1 |
Average number of cars or other vehicles available in apartments:
| Here: | 1.0 |
| place: | 1.2 |
Percentage of units with a mortgage:
| Beaver Dam: | 45.2% |
| Pennsville: | 63.2% |
Housing prices:
- Average estimated value of detached houses in 2022 (52.7% of all units):
Beaver Dam: $225,729 New Jersey: $537,591
- Average estimated value of mobile home in 2022 (25.7% of all units):
Beaver Dam: $54,019 New Jersey: $119,788
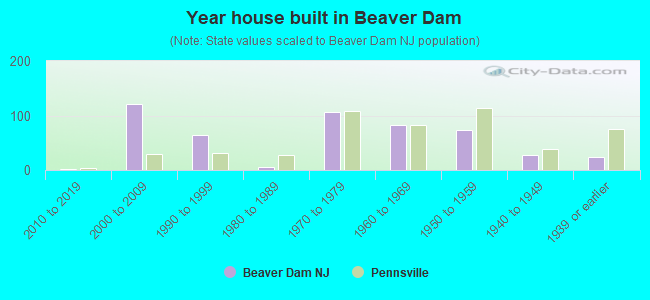
- Year house built in Beaver Dam
- 02020 or later
- 22010 to 2019
- 1212000 to 2009
- 641990 to 1999
- 51980 to 1989
- 1061970 to 1979
- 831960 to 1969
- 731950 to 1959
- 281940 to 1949
- 231939 or earlier
City-data.com crime index for place in 2020 (higher means more crime):
| City: | 144.1 |
| U.S. average: | 219.5 |
Travel time to work (commute)
![Travel time to work (commute)]()
- 3Less than 5 minutes
- 295 to 9 minutes
- 6110 to 14 minutes
- 2115 to 19 minutes
- 5220 to 24 minutes
- 1625 to 29 minutes
- 5430 to 34 minutes
- 1035 to 39 minutes
- 740 to 44 minutes
- 1445 to 59 minutes
- 760 to 89 minutes
- 1290 or more minutes

Means of transportation to work
![Means of transportation to work]()
- 79.0%387Drove a car alone
- 10.4%51Carpooled
- 7.4%36Walked
- 2.9%14Worked at home

Time leaving home to go to work
![Time leaving home to go to work]()
- 2112:00 a.m. to 4:59 a.m.
- 65:00 a.m. to 5:29 a.m.
- 165:30 a.m. to 5:59 a.m.
- 276:00 a.m. to 6:29 a.m.
- 456:30 a.m. to 6:59 a.m.
- 167:00 a.m. to 7:29 a.m.
- 57:30 a.m. to 7:59 a.m.
- 448:00 a.m. to 8:29 a.m.
- 128:30 a.m. to 8:59 a.m.
- 19:00 a.m. to 9:59 a.m.
- 2410:00 a.m. to 10:59 a.m.
- 711:00 a.m. to 11:59 a.m.
- 2312:00 p.m. to 3:59 p.m.
- 324:00 p.m. to 11:59 p.m.

Occupations of males:
- Percentage of males in management occupations (except farmers):
Here: 5.8% place: 10.6%
- Percentage of males in computer and mathematical occupations:
Here: 4.0% place: 2.5%
- Percentage of males in healthcare practitioners and technical occupations:
Here: 15.6% place: 3.2%
- Percentage of males in service occupations:
Here: 14.3% place: 9.2%
- Percentage of males in sales and office occupations:
Here: 10.6% place: 17.4%
- Percentage of males in farming, fishing, and forestry occupations:
Here: 4.9% place: 0.7%
- Percentage of males in construction, extraction, and maintenance occupations:
Here: 4.9% place: 12.7%
- Percentage of males in production occupations:
Here: 10.7% place: 11.6%
- Percentage of males in transportation occupations:
Here: 23.3% place: 10.5%
- Percentage of males in material moving occupations:
Here: 2.4% place: 7.5%
Occupations of females:
- Percentage of females in management occupations (except farmers):
Here: 7.7% place: 7.8%
- Percentage of females in architecture and engineering occupations:
Here: 4.0% place: 0.6%
- Percentage of females in life, physical, and social science occupations:
Here: 4.5% place: 1.6%
- Percentage of females in education, training, and library occupations:
Here: 9.3% place: 10.1%
- Percentage of females in healthcare practitioners and technical occupations:
Here: 13.0% place: 7.8%
- Percentage of females in service occupations:
Here: 26.1% place: 18.9%
- Percentage of females in sales and office occupations:
Here: 20.2% place: 35.9%
- Percentage of females in production occupations:
Here: 4.8% place: 2.1%
- Percentage of females in transportation occupations:
Here: 8.5% place: 3.3%
- Percentage of females in material moving occupations:
Here: 1.8% place: 1.1%
Percentage of people 16-64 in Armed Forces:
| Beaver Dam: | 0.0% |
| Pennsville: | 0.1% |
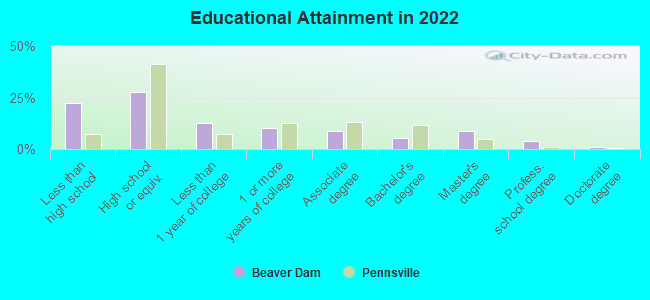
Education in this neighborhood (subdivision or community):
- Percentage of people 3 years and older in K-12 schools:
Beaver Dam: 10.9% Pennsville: 16.0%
- Percentage of people 3 years and older in undergraduate colleges:
Beaver Dam: 3.0% Pennsville: 4.9%
- Percentage of people 3 years and older in grad. or professional schools:
Beaver Dam: 0.5% Pennsville: 0.6%
- Percentage of students K-12 enrolled in private schools:
Beaver Dam: 14.7% Pennsville: 5.9%
Percentage of population below poverty level:
| Beaver Dam: | 13.0% |
| Pennsville: | 13.7% |
Median year owner moved in (as recorded in 2022):
| Beaver Dam: | 2002 |
| Pennsville: | 2006 |
Percentage of married-couple families with both working:
| Beaver Dam: | 99.7% |
| Pennsville: | 66.6% |
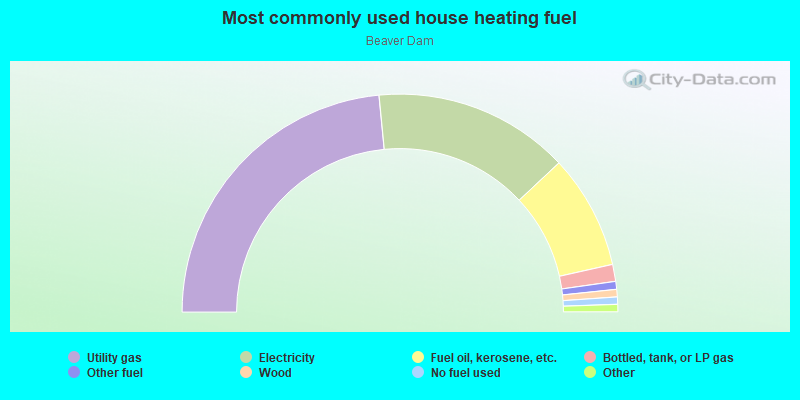
- 47.0%Utility gas
- 29.1%Electricity
- 17.0%Fuel oil, kerosene, etc.
- 2.5%Bottled, tank, or LP gas
- 1.2%Other fuel
- 1.1%Wood
- 1.1%No fuel used
- 0.5%Coal or coke
- 0.5%Solar energy
Roads and streets:
E Pittsfield St
Length: 2.08 miles
Directions: E-W, N-S, SE-NW, SW-NE
Address range: 200 to 450
Directions: E-W, N-S, SE-NW, SW-NE
Address range: 200 to 450
Rte 551 (N Hook Rd)
Length: 0.87 miles
Directions: N-S, SW-NE
Address range: 1 to 163
Directions: N-S, SW-NE
Address range: 1 to 163
Wingate Dr
Length: 0.49 miles
Directions: E-W, SW-NE
Directions: E-W, SW-NE
Smigelski Ln
Length: 0.41 miles
Directions: E-W, SW-NE
Address range: 1 to 8
Directions: E-W, SW-NE
Address range: 1 to 8
Beaver Ave
Length: 0.38 miles
Directions: E-W, SW-NE
Address range: 1 to 99
Directions: E-W, SW-NE
Address range: 1 to 99
Lee Ave
Length: 0.31 miles
Direction: E-W
Address range: 151 to 199
Direction: E-W
Address range: 151 to 199
Linden Ln
Length: 0.31 miles
Directions: N-S, SW-NE
Address range: 25 to 46
Directions: N-S, SW-NE
Address range: 25 to 46
Erie Ave
Length: 0.31 miles
Directions: E-W, SE-NW
Address range: 1 to 199
Directions: E-W, SE-NW
Address range: 1 to 199
Mellen Ave
Length: 0.29 miles
Direction: E-W
Address range: 173 to 209
Direction: E-W
Address range: 173 to 209
Oakdale Ln
Length: 0.29 miles
Direction: SW-NE
Address range: 21 to 120
Direction: SW-NE
Address range: 21 to 120
Davis Ln
Length: 0.14 miles
Directions: E-W, N-S, SE-NW, SW-NE
Directions: E-W, N-S, SE-NW, SW-NE
White St
Length: 0.11 miles
Direction: E-W
Address range: 1 to 9
Direction: E-W
Address range: 1 to 9
Reed St
Length: 0.10 miles
Directions: N-S, SW-NE
Address range: 3 to 99
Directions: N-S, SW-NE
Address range: 3 to 99
George Dr
Length: 0.07 miles
Direction: SW-NE
Direction: SW-NE
South Dr
Length: 0.07 miles
Directions: N-S, SW-NE
Address range: 2 to 14
Directions: N-S, SW-NE
Address range: 2 to 14
Jenkins Ter
Length: 0.05 miles
Direction: N-S
Direction: N-S