Beach neighborhood in Huntington Beach, California (CA), 92646, 92648, 92649 detailed profile
Settings
X


Business Search - 14 Million verified businesses
Area: 1.033 square miles
Population: 666
Population density:
| Beach: | 644 people per square mile |
| Huntington Beach: | 7,362 people per square mile |

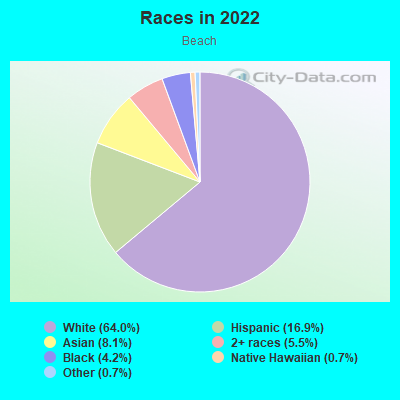
- 44464.0%White
- 11716.9%Hispanic or Latino
- 568.1%Asian
- 385.5%Two or more races
- 294.2%Black
- 50.7%Native Hawaiian and Other
Pacific Islander - 50.7%Some other race
Median household income in 2022:
| Beach: | $155,148 |
| Huntington Beach: | $111,122 |
Distribution of median household income
![Distribution of median household income]()
- 11Less than $10,000
- 20$10,000 to $19,999
- 15$20,000 to $29,999
- 18$30,000 to $39,999
- 45$40,000 to $49,999
- 12$50,000 to $59,999
- 17$60,000 to $74,999
- 30$75,000 to $99,999
- 61$100,000 to $124,999
- 28$125,000 to $149,999
- 45$150,000 to $199,999
- 78$200,000 or more

Distribution of owner-occupied house/condo value
![Distribution of owner-occupied house/condo value]()
- 19Less than $50,000
- 27$50,000 to $99,999
- 4$100,000 to $149,999
- 2$150,000 to $199,999
- 4$200,000 to $249,999
- 6$250,000 to $299,999
- 3$300,000 to $399,999
- 20$400,000 to $499,999
- 17$500,000 to $749,999
- 22$750,000 to $999,999
- 113$1,000,000 or more

Distribution of rent paid by renters
![Distribution of rent paid by renters]()
- 14$600 to $699
- 4$700 to $799
- 71$800 to $899
- 5$900 to $999
- 14$1,000 to $1,249
- 1$1,250 to $1,499
- 48$1,500 to $1,999
- 198$2,000 or more

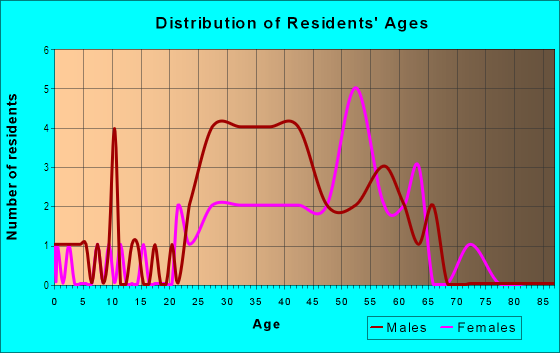
| Males: | 373 |
| Females: | 293 |
Males:
| This neighborhood: | 42.6 years |
| Whole city: | 43.6 years |
| This neighborhood: | 48.4 years |
| Whole city: | 44.2 years |
Average household size:
| Beach: | 2.4 people |
| Huntington Beach: | 2.5 people |
Percentage of family households:
| Beach: | 35.2% |
| Huntington Beach: | 42.1% |
| Here: | 38.6% |
| Huntington Beach: | 47.5% |
Percentage of married-couple families with children (among all households):
| Beach: | 28.2% |
| Huntington Beach: | 31.5% |
Percentage of single-mother households (among all households):
| Beach: | 19.3% |
| Huntington Beach: | 5.7% |
Percentage of never married males 15 years old and over:
Percentage of never married females 15 years old and over:
| Beach: | 22.7% |
| Huntington Beach: | 18.9% |
Percentage of never married females 15 years old and over:
| Beach: | 10.7% |
| city: | 16.3% |
Percentage of people that speak English not well or not at all:
| Beach: | 0.0% |
| Huntington Beach: | 4.1% |
Percentage of people born in this state:
Percentage of people born in another U.S. state:
Percentage of native residents but born outside the U.S.:
Percentage of foreign born residents:
| Here: | 58.3% |
| Huntington Beach: | 57.7% |
Percentage of people born in another U.S. state:
| Beach: | 28.1% |
| Huntington Beach: | 22.8% |
Percentage of native residents but born outside the U.S.:
| Here: | 1.5% |
| city: | 1.5% |
Percentage of foreign born residents:
| Here: | 12.2% |
| Huntington Beach: | 18.0% |

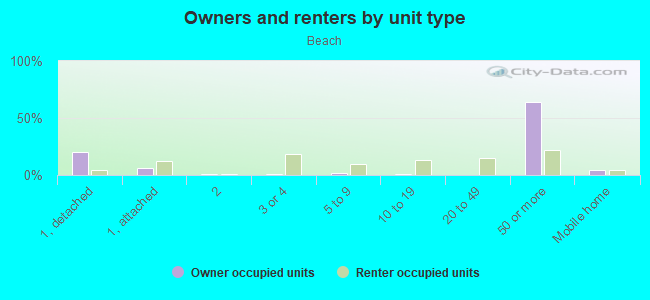
Owner-occupied
Renter-occupied

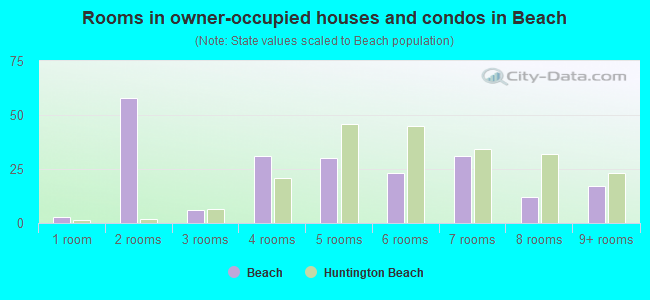
- Rooms in owner-occupied houses and condos in Beach
- 31 room
- 582 rooms
- 63 rooms
- 314 rooms
- 305 rooms
- 236 rooms
- 317 rooms
- 128 rooms
- 179+ rooms
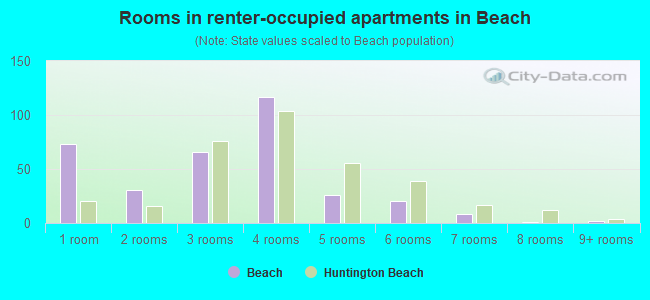
- Rooms in renter-occupied apartments in Beach
- 731 room
- 312 rooms
- 663 rooms
- 1174 rooms
- 265 rooms
- 206 rooms
- 87 rooms
- 18 rooms
- 29+ rooms
Owner-occupied
Renter-occupied
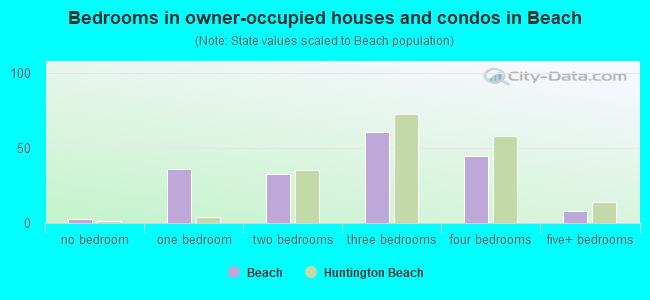
- Bedrooms in owner-occupied houses and condos in Beach
- 3no bedroom
- 361 bedroom
- 332 bedrooms
- 613 bedrooms
- 454 bedrooms
- 85+ bedrooms
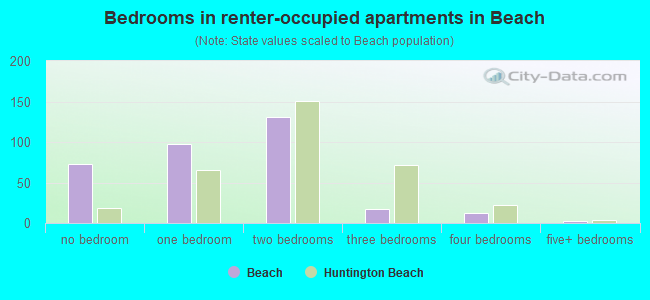
- Bedrooms in renter-occupied apartments in Beach
- 73no bedroom
- 981 bedroom
- 1312 bedrooms
- 173 bedrooms
- 124 bedrooms
- 25+ bedrooms
Average number of cars or other vehicles available in houses/condos:
Average number of cars or other vehicles available in apartments:
| This neighborhood: | 2.7 |
| Huntington Beach: | 2.1 |
Average number of cars or other vehicles available in apartments:
| Here: | 2.0 |
| city: | 1.8 |
Percentage of units with a mortgage:
| Beach: | 63.9% |
| Huntington Beach: | 63.1% |
Average estimated value of detached houses in 2022 (39.7% of all units):
| Beach: | $1,588,101 |
| Huntington Beach: | $1,395,007 |
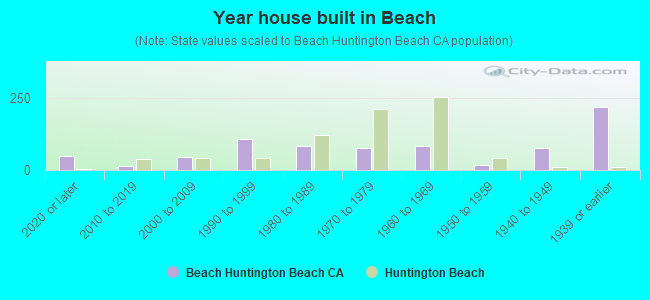
- Year house built in Beach
- 482020 or later
- 152010 to 2019
- 452000 to 2009
- 1101990 to 1999
- 851980 to 1989
- 771970 to 1979
- 851960 to 1969
- 161950 to 1959
- 761940 to 1949
- 2191939 or earlier
City-data.com crime index for city in 2020 (higher means more crime):
| City: | 172.8 |
| U.S. average: | 219.5 |
Travel time to work (commute)
![Travel time to work (commute)]()
- 12Less than 5 minutes
- 105 to 9 minutes
- 2210 to 14 minutes
- 3715 to 19 minutes
- 3420 to 24 minutes
- 1525 to 29 minutes
- 5130 to 34 minutes
- 1335 to 39 minutes
- 1440 to 44 minutes
- 2345 to 59 minutes
- 1960 to 89 minutes
- 1490 or more minutes

Means of transportation to work
![Means of transportation to work]()
- 72.0%244Drove a car alone
- 1.8%6Carpooled
- 0.3%1Bus
- 0.9%3Bicycle
- 1.2%4Walked
- 3.8%13Other means
- 24.2%82Worked at home

Time leaving home to go to work
![Time leaving home to go to work]()
- 1012:00 a.m. to 4:59 a.m.
- 155:00 a.m. to 5:29 a.m.
- 145:30 a.m. to 5:59 a.m.
- 266:00 a.m. to 6:29 a.m.
- 306:30 a.m. to 6:59 a.m.
- 387:00 a.m. to 7:29 a.m.
- 327:30 a.m. to 7:59 a.m.
- 318:00 a.m. to 8:29 a.m.
- 238:30 a.m. to 8:59 a.m.
- 179:00 a.m. to 9:59 a.m.
- 1110:00 a.m. to 10:59 a.m.
- 511:00 a.m. to 11:59 a.m.
- 1312:00 p.m. to 3:59 p.m.
- 54:00 p.m. to 11:59 p.m.

Occupations of males:
- Percentage of males in management occupations (except farmers):
Here: 17.9% city: 17.0%
- Percentage of males in business and financial operations occupations:
Here: 9.7% city: 8.0%
- Percentage of males in computer and mathematical occupations:
Here: 3.4% city: 4.1%
- Percentage of males in architecture and engineering occupations:
Here: 3.8% city: 5.2%
- Percentage of males in education, training, and library occupations:
Here: 4.9% city: 4.0%
- Percentage of males in arts, design, entertainment, sports, and media occupations:
Here: 3.3% city: 3.2%
- Percentage of males in healthcare practitioners and technical occupations:
Here: 5.1% city: 4.2%
- Percentage of males in service occupations:
Here: 8.3% city: 13.4%
- Percentage of males in sales and office occupations:
Here: 23.2% city: 17.7%
- Percentage of males in construction, extraction, and maintenance occupations:
Here: 4.3% city: 5.8%
- Percentage of males in production occupations:
Here: 7.3% city: 5.1%
- Percentage of males in transportation occupations:
Here: 5.3% city: 2.8%
- Percentage of males in material moving occupations:
Here: 1.9% city: 2.5%
Occupations of females:
- Percentage of females in management occupations (except farmers):
Here: 9.5% city: 12.6%
- Percentage of females in business and financial operations occupations:
Here: 6.9% city: 8.8%
- Percentage of females in computer and mathematical occupations:
Here: 2.9% city: 1.5%
- Percentage of females in architecture and engineering occupations:
Here: 2.6% city: 1.4%
- Percentage of females in life, physical, and social science occupations:
Here: 4.8% city: 1.1%
- Percentage of females in education, training, and library occupations:
Here: 8.9% city: 8.8%
- Percentage of females in arts, design, entertainment, sports, and media occupations:
Here: 2.4% city: 2.6%
- Percentage of females in healthcare practitioners and technical occupations:
Here: 8.0% city: 10.1%
- Percentage of females in service occupations:
Here: 9.4% city: 16.4%
- Percentage of females in sales and office occupations:
Here: 42.9% city: 25.5%
- Percentage of females in production occupations:
Here: 2.2% city: 2.3%
- Percentage of females in material moving occupations:
Here: 1.3% city: 2.3%
Percentage of people 16-64 in Armed Forces:
| Beach: | 0.1% |
| Huntington Beach: | 0.2% |
Education in this neighborhood (subdivision or community):
- Percentage of people 3 years and older in K-12 schools:
Beach: 20.5% Huntington Beach: 13.1%
- Percentage of people 3 years and older in undergraduate colleges:
Beach: 5.7% Huntington Beach: 5.8%
- Percentage of people 3 years and older in grad. or professional schools:
Beach: 4.1% Huntington Beach: 1.2%
- Percentage of students K-12 enrolled in private schools:
Beach: 104.5% Huntington Beach: 18.8%
Percentage of population below poverty level:
| Beach: | 5.0% |
| Huntington Beach: | 7.0% |
Median year owner moved in (as recorded in 2022):
| Beach: | 2062 |
| Huntington Beach: | 2006 |
Percentage of married-couple families with both working:
| Beach: | 63.4% |
| Huntington Beach: | 65.3% |
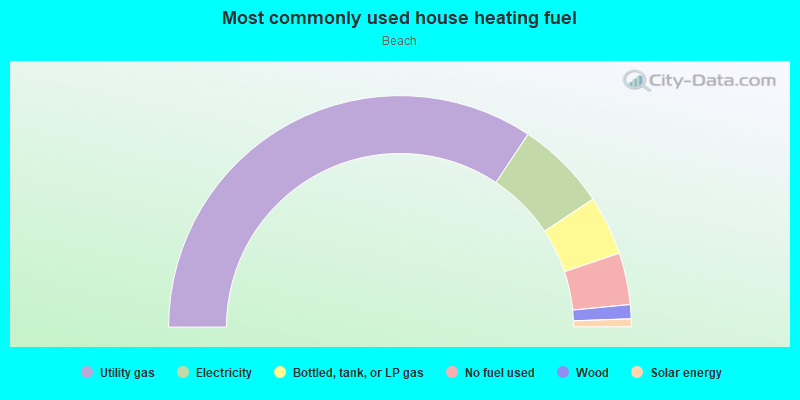
- 68.6%Utility gas
- 12.7%Electricity
- 8.3%Bottled, tank, or LP gas
- 7.2%No fuel used
- 2.0%Wood
- 1.1%Solar energy
Highways in this neighborhood:
Pacific Coast Hwy (State Hwy 1)
Length: 1.66 miles
Direction: SE-NW
Address range: 17932 to 21825
Direction: SE-NW
Address range: 17932 to 21825
Roads and streets:
Magnolia St
Length: 0.13 miles
Direction: N-S
Direction: N-S
Main St
Length: 0.11 miles
Direction: SW-NE
Direction: SW-NE
Warner Ave
Length: 0.08 miles
Direction: E-W
Address range: 3500 to 3517
Direction: E-W
Address range: 3500 to 3517
Extension
Length: 0.07 miles
Direction: SW-NE
Direction: SW-NE
Railroad features:
Union Pacific RR
Length: 0.81 miles
Directions: E-W, SE-NW
Directions: E-W, SE-NW
Other features:
Flood Control Chnnl
Length: 0.07 miles
Directions: E-W, SW-NE
Directions: E-W, SW-NE