Baynard Boulevard Historic District neighborhood in Wilmington, Delaware (DE), 19802 detailed profile
Settings
X

Business Search - 14 Million verified businesses
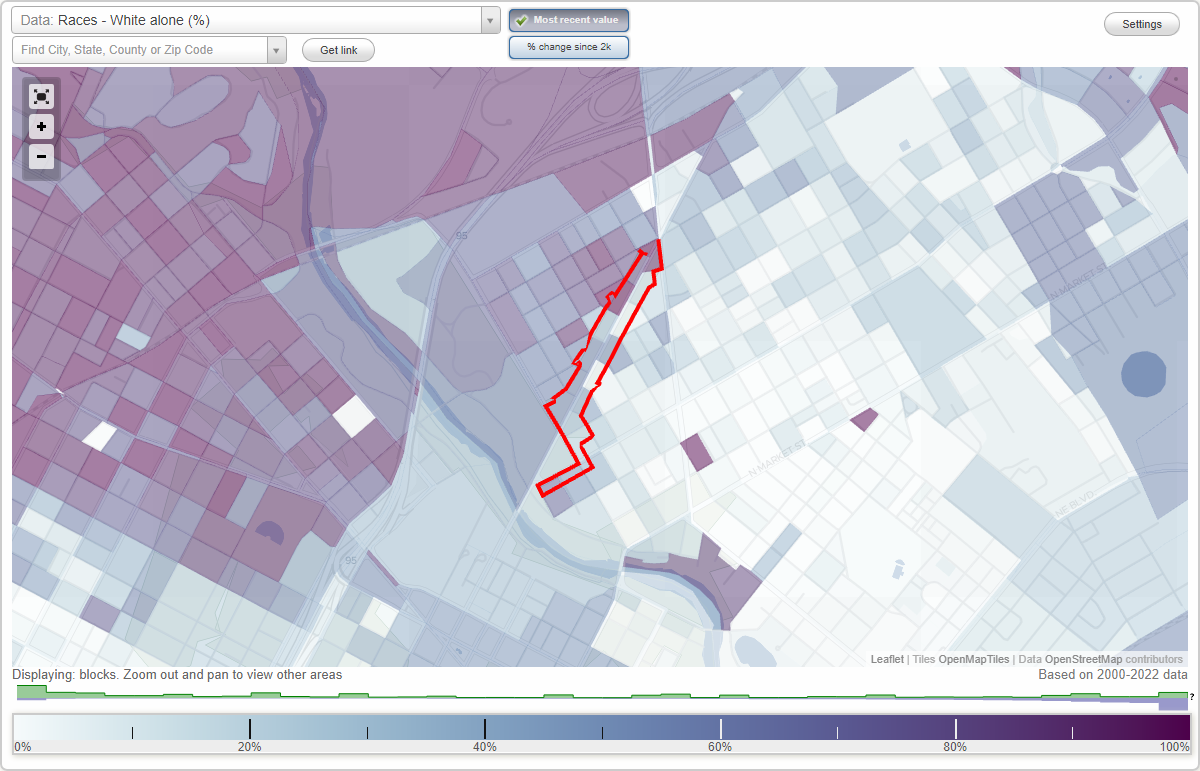
Area: 0.035 square miles
Population: 310
Population density:
| Baynard Boulevard Historic District: | 8,867 people per square mile |
| Wilmington: | 6,597 people per square mile |

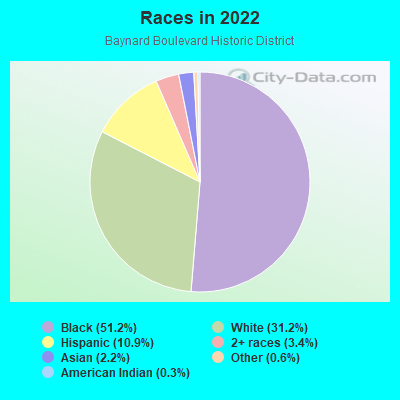
- 16451.2%Black
- 10031.2%White
- 3510.9%Hispanic or Latino
- 113.4%Two or more races
- 72.2%Asian
- 20.6%Some other race
- 10.3%American Indian
Median household income in 2022:
| Baynard Boulevard Historic District: | $44,515 |
| Wilmington: | $52,768 |
Distribution of median household income
![Distribution of median household income]()
- 42Less than $10,000
- 27$10,000 to $19,999
- 22$20,000 to $29,999
- 28$30,000 to $39,999
- 26$40,000 to $49,999
- 16$50,000 to $59,999
- 6$60,000 to $74,999
- 24$75,000 to $99,999
- 5$100,000 to $124,999
- 11$125,000 to $149,999
- 13$150,000 to $199,999
- 13$200,000 or more

Distribution of owner-occupied house/condo value
![Distribution of owner-occupied house/condo value]()
- 16Less than $50,000
- 32$50,000 to $99,999
- 25$100,000 to $149,999
- 32$150,000 to $199,999
- 13$200,000 to $249,999
- 22$250,000 to $299,999
- 16$300,000 to $399,999
- 14$400,000 to $499,999
- 10$500,000 to $749,999

Distribution of rent paid by renters
![Distribution of rent paid by renters]()
- 25Less than $100
- 15$100 to $199
- 14$200 to $299
- 6$300 to $399
- 36$400 to $499
- 2$500 to $599
- 6$600 to $699
- 32$700 to $799
- 33$800 to $899
- 24$900 to $999
- 16$1,000 to $1,249
- 25$1,250 to $1,499
- 10$1,500 to $1,999
- 3$2,000 or more

Median rent in 2022:
| Baynard Boulevard Historic District: | $802 |
| Wilmington: | $941 |
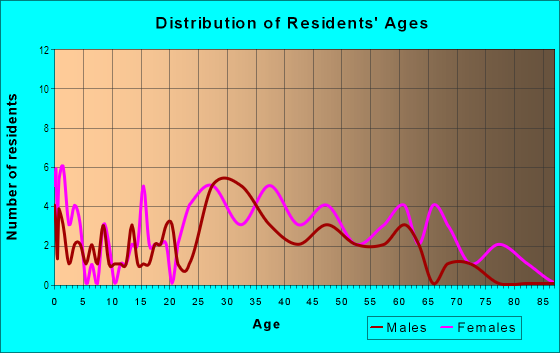
| Males: | 149 |
| Females: | 161 |
Males:
| This neighborhood: | 45.7 years |
| Whole city: | 37.1 years |
| This neighborhood: | 42.6 years |
| Whole city: | 41.1 years |
Average household size:
| Baynard Boulevard Historic District: | 1.9 people |
| Wilmington: | 2.1 people |
Percentage of family households:
| Baynard Boulevard Historic District: | 23.7% |
| Wilmington: | 32.8% |
| Here: | 17.4% |
| Wilmington: | 20.9% |
Percentage of married-couple families with children (among all households):
| Baynard Boulevard Historic District: | 77.4% |
| Wilmington: | 13.2% |
Percentage of single-mother households (among all households):
| Baynard Boulevard Historic District: | 43.3% |
| Wilmington: | 24.1% |
Percentage of never married males 15 years old and over:
Percentage of never married females 15 years old and over:
| Baynard Boulevard Historic District: | 18.4% |
| Wilmington: | 22.2% |
Percentage of never married females 15 years old and over:
| Baynard Boulevard Historic District: | 20.2% |
| city: | 28.6% |
Percentage of people that speak English not well or not at all:
| Baynard Boulevard Historic District: | 0.0% |
| Wilmington: | 2.4% |
Percentage of people born in this state:
Percentage of people born in another U.S. state:
Percentage of native residents but born outside the U.S.:
Percentage of foreign born residents:
| Here: | 41.0% |
| Wilmington: | 45.5% |
Percentage of people born in another U.S. state:
| Baynard Boulevard Historic District: | 45.0% |
| Wilmington: | 43.0% |
Percentage of native residents but born outside the U.S.:
| Here: | 1.4% |
| city: | 3.5% |
Percentage of foreign born residents:
| Here: | 12.6% |
| Wilmington: | 8.0% |
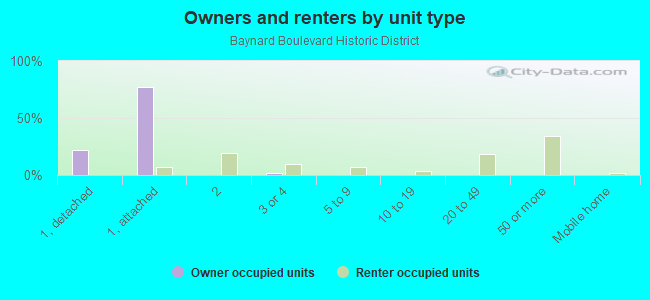
Owner-occupied
Renter-occupied

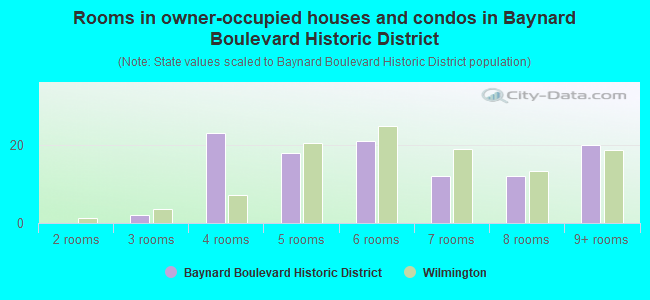
- Rooms in owner-occupied houses and condos in Baynard Boulevard Historic District
- 01 room
- 02 rooms
- 23 rooms
- 234 rooms
- 185 rooms
- 216 rooms
- 127 rooms
- 128 rooms
- 209+ rooms
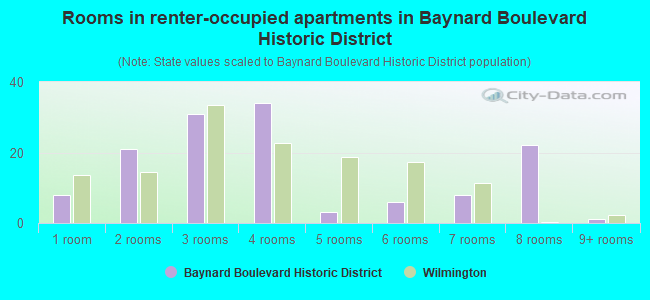
- Rooms in renter-occupied apartments in Baynard Boulevard Historic District
- 81 room
- 212 rooms
- 313 rooms
- 344 rooms
- 35 rooms
- 66 rooms
- 87 rooms
- 228 rooms
- 19+ rooms
Owner-occupied
Renter-occupied
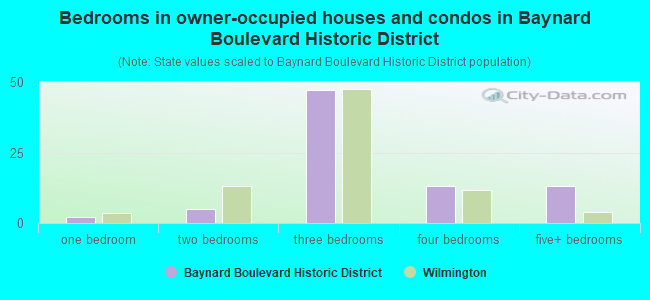
- Bedrooms in owner-occupied houses and condos in Baynard Boulevard Historic District
- 0no bedroom
- 21 bedroom
- 52 bedrooms
- 473 bedrooms
- 134 bedrooms
- 135+ bedrooms
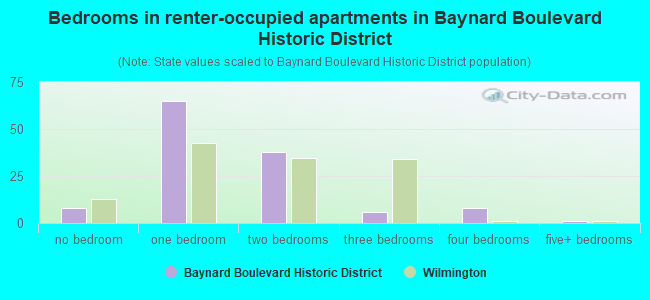
- Bedrooms in renter-occupied apartments in Baynard Boulevard Historic District
- 8no bedroom
- 651 bedroom
- 382 bedrooms
- 63 bedrooms
- 84 bedrooms
- 15+ bedrooms
Average number of cars or other vehicles available in houses/condos:
Average number of cars or other vehicles available in apartments:
| This neighborhood: | 1.6 |
| Wilmington: | 1.6 |
Average number of cars or other vehicles available in apartments:
| Here: | 0.7 |
| city: | 0.9 |
Percentage of units with a mortgage:
| Baynard Boulevard Historic District: | 71.8% |
| Wilmington: | 67.1% |
Housing prices:
- Average estimated value of detached houses in 2022 (11.1% of all units):
Baynard Boulevard Historic District: $423,736 Delaware: $419,599
- Average estimated value of townhouses or other attached units in 2022 (41.5% of all units):
This neighborhood: $219,264 Delaware: $291,415
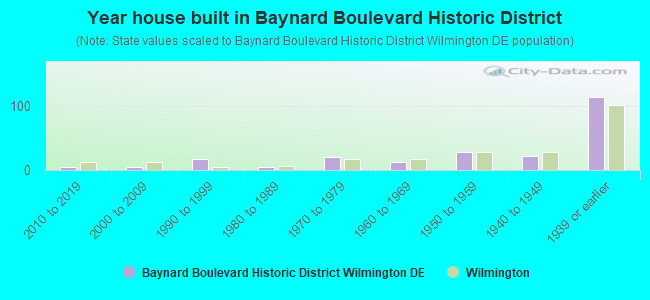
- Year house built in Baynard Boulevard Historic District
- 12020 or later
- 42010 to 2019
- 52000 to 2009
- 181990 to 1999
- 51980 to 1989
- 211970 to 1979
- 121960 to 1969
- 291950 to 1959
- 221940 to 1949
- 1141939 or earlier
City-data.com crime index for city in 2020 (higher means more crime):
| City: | 649.2 |
| U.S. average: | 219.5 |
Travel time to work (commute)
![Travel time to work (commute)]()
- 145 to 9 minutes
- 3810 to 14 minutes
- 4315 to 19 minutes
- 1420 to 24 minutes
- 1325 to 29 minutes
- 1830 to 34 minutes
- 435 to 39 minutes
- 1540 to 44 minutes
- 145 to 59 minutes
- 860 to 89 minutes
- 390 or more minutes

Means of transportation to work
![Means of transportation to work]()
- 59.8%98Drove a car alone
- 3.7%6Carpooled
- 17.1%28Bus
- 2.4%4Subway or elevated rail
- 1.2%2Long-distance train or commuter rail
- 9.8%16Taxi
- 4.9%8Bicycle
- 1.8%3Walked
- 4.9%8Other means
- 15.2%25Worked at home

Time leaving home to go to work
![Time leaving home to go to work]()
- 4812:00 a.m. to 4:59 a.m.
- 25:00 a.m. to 5:29 a.m.
- 95:30 a.m. to 5:59 a.m.
- 156:00 a.m. to 6:29 a.m.
- 126:30 a.m. to 6:59 a.m.
- 217:00 a.m. to 7:29 a.m.
- 277:30 a.m. to 7:59 a.m.
- 168:00 a.m. to 8:29 a.m.
- 98:30 a.m. to 8:59 a.m.
- 79:00 a.m. to 9:59 a.m.
- 610:00 a.m. to 10:59 a.m.
- 211:00 a.m. to 11:59 a.m.
- 1612:00 p.m. to 3:59 p.m.
- 254:00 p.m. to 11:59 p.m.

Occupations of males:
- Percentage of males in management occupations (except farmers):
Here: 16.5% city: 8.8%
- Percentage of males in business and financial operations occupations:
Here: 10.9% city: 5.8%
- Percentage of males in computer and mathematical occupations:
Here: 4.4% city: 3.9%
- Percentage of males in architecture and engineering occupations:
Here: 2.5% city: 3.0%
- Percentage of males in life, physical, and social science occupations:
Here: 3.8% city: 1.7%
- Percentage of males in community and social services occupations:
Here: 15.2% city: 3.6%
- Percentage of males in legal occupations:
Here: 3.7% city: 3.3%
- Percentage of males in arts, design, entertainment, sports, and media occupations:
Here: 3.1% city: 1.7%
- Percentage of males in healthcare practitioners and technical occupations:
Here: 7.7% city: 3.8%
- Percentage of males in service occupations:
Here: 18.6% city: 18.7%
- Percentage of males in sales and office occupations:
Here: 4.8% city: 11.8%
- Percentage of males in construction, extraction, and maintenance occupations:
Here: 1.0% city: 6.3%
- Percentage of males in production occupations:
Here: 1.8% city: 5.6%
- Percentage of males in transportation occupations:
Here: 8.6% city: 7.6%
- Percentage of males in material moving occupations:
Here: 5.0% city: 5.8%
Occupations of females:
- Percentage of females in management occupations (except farmers):
Here: 4.2% city: 10.8%
- Percentage of females in business and financial operations occupations:
Here: 4.2% city: 10.0%
- Percentage of females in life, physical, and social science occupations:
Here: 1.9% city: 1.4%
- Percentage of females in community and social services occupations:
Here: 8.0% city: 4.0%
- Percentage of females in legal occupations:
Here: 1.4% city: 2.6%
- Percentage of females in education, training, and library occupations:
Here: 10.1% city: 9.1%
- Percentage of females in arts, design, entertainment, sports, and media occupations:
Here: 5.1% city: 1.4%
- Percentage of females in healthcare practitioners and technical occupations:
Here: 6.2% city: 8.1%
- Percentage of females in service occupations:
Here: 18.0% city: 21.3%
- Percentage of females in sales and office occupations:
Here: 38.0% city: 21.1%
- Percentage of females in material moving occupations:
Here: 2.5% city: 2.5%
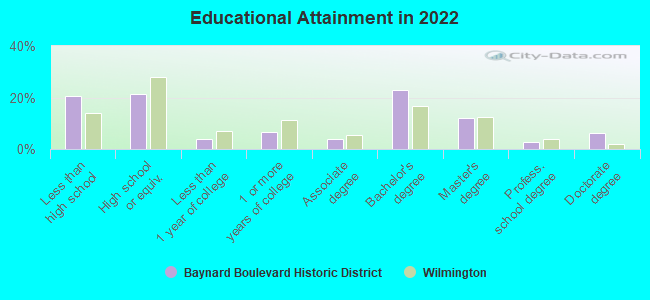
Education in this neighborhood (subdivision or community):
- Percentage of people 3 years and older in K-12 schools:
Baynard Boulevard Historic District: 21.1% Wilmington: 16.0%
- Percentage of people 3 years and older in undergraduate colleges:
Baynard Boulevard Historic District: 6.2% Wilmington: 3.1%
- Percentage of people 3 years and older in grad. or professional schools:
Baynard Boulevard Historic District: 8.6% Wilmington: 2.8%
- Percentage of students K-12 enrolled in private schools:
Baynard Boulevard Historic District: 40.6% Wilmington: 8.2%
Percentage of population below poverty level:
| Baynard Boulevard Historic District: | 22.0% |
| Wilmington: | 22.2% |
Median year owner moved in (as recorded in 2022):
Median year renter moved in (as recorded in 2022):
| Baynard Boulevard Historic District: | 2010 |
| Wilmington: | 2010 |
Median year renter moved in (as recorded in 2022):
| Baynard Boulevard Historic District: | 2014 |
| Wilmington: | 2020 |
Percentage of married-couple families with both working:
| Baynard Boulevard Historic District: | 106.8% |
| Wilmington: | 84.9% |
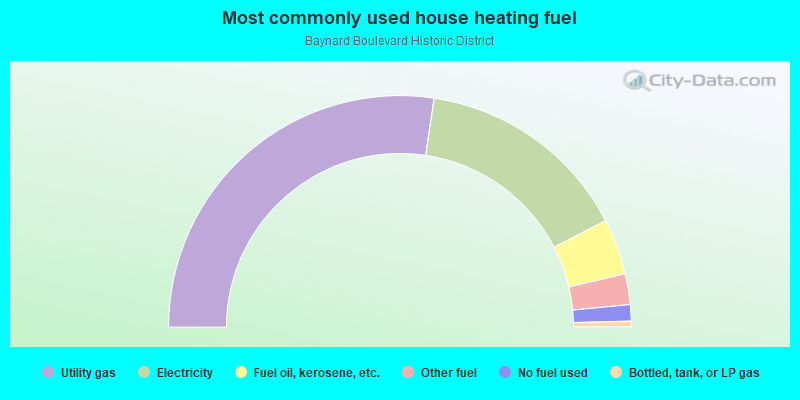
- 54.8%Utility gas
- 30.1%Electricity
- 7.8%Fuel oil, kerosene, etc.
- 4.3%Other fuel
- 2.3%No fuel used
- 0.8%Bottled, tank, or LP gas
Roads and streets:
Baynard Blvd
Length: 0.42 miles
Direction: SW-NE
Address range: 1865 to 2442
Direction: SW-NE
Address range: 1865 to 2442
N Van Buren St
Length: 0.06 miles
Direction: E-W
Address range: 2300 to 2399
Direction: E-W
Address range: 2300 to 2399
W 19th St
Length: 0.06 miles
Directions: E-W, SE-NW
Address range: 400 to 499
Directions: E-W, SE-NW
Address range: 400 to 499
W 22nd St
Length: 0.03 miles
Direction: E-W
Address range: 508 to 599
Direction: E-W
Address range: 508 to 599