Baseline-Hardy neighborhood in Tempe, Arizona (AZ), 85282 detailed profile
Settings
X


Business Search - 14 Million verified businesses
Area: 0.109 square miles
Population: 2,274
Population density:
| Baseline-Hardy: | 20,854 people per square mile |
| Tempe: | 4,641 people per square mile |

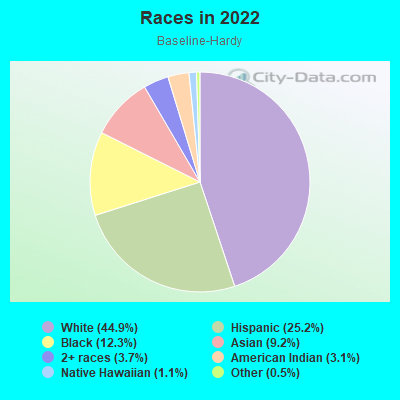
- 1,02044.9%White
- 57225.2%Hispanic or Latino
- 27912.3%Black
- 2109.2%Asian
- 833.7%Two or more races
- 703.1%American Indian
- 251.1%Native Hawaiian and Other
Pacific Islander - 120.5%Some other race
Median household income in 2022:
| Baseline-Hardy: | $66,528 |
| Tempe: | $76,007 |
Distribution of median household income
![Distribution of median household income]()
- 68Less than $10,000
- 58$10,000 to $19,999
- 70$20,000 to $29,999
- 52$30,000 to $39,999
- 51$40,000 to $49,999
- 69$50,000 to $59,999
- 315$60,000 to $74,999
- 148$75,000 to $99,999
- 140$100,000 to $124,999
- 75$125,000 to $149,999
- 40$150,000 to $199,999
- 36$200,000 or more

Distribution of owner-occupied house/condo value
![Distribution of owner-occupied house/condo value]()
- 17$100,000 to $149,999
- 39$150,000 to $199,999
- 39$200,000 to $249,999
- 66$250,000 to $299,999
- 107$300,000 to $399,999
- 40$400,000 to $499,999

Distribution of rent paid by renters
![Distribution of rent paid by renters]()
- 32$500 to $599
- 9$600 to $699
- 66$900 to $999
- 217$1,000 to $1,249
- 217$1,250 to $1,499
- 257$1,500 to $1,999
- 16$2,000 or more

Median rent in 2022:
| Baseline-Hardy: | $1,346 |
| Tempe: | $1,566 |
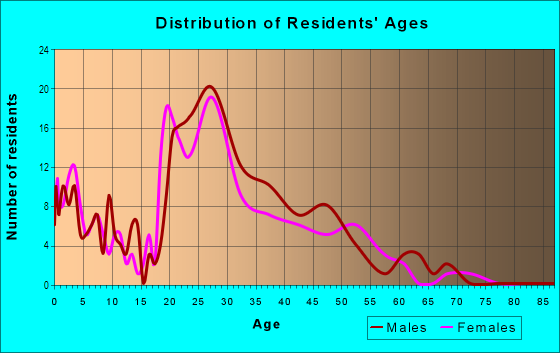
| Males: | 1,107 |
| Females: | 1,167 |
Males:
| This neighborhood: | 32.2 years |
| Whole city: | 28.9 years |
| This neighborhood: | 34.0 years |
| Whole city: | 30.5 years |
Average household size:
| Baseline-Hardy: | 24.0 people |
| Tempe: | 2.3 people |
Percentage of family households:
| Baseline-Hardy: | 35.7% |
| Tempe: | 36.3% |
| Here: | 18.6% |
| Tempe: | 32.6% |
Percentage of married-couple families with children (among all households):
| Baseline-Hardy: | 17.9% |
| Tempe: | 26.9% |
Percentage of single-mother households (among all households):
| Baseline-Hardy: | 22.7% |
| Tempe: | 8.3% |
Percentage of never married males 15 years old and over:
Percentage of never married females 15 years old and over:
| Baseline-Hardy: | 30.5% |
| Tempe: | 32.9% |
Percentage of never married females 15 years old and over:
| Baseline-Hardy: | 28.4% |
| city: | 21.7% |
Percentage of people that speak English not well or not at all:
| Baseline-Hardy: | 0.0% |
| Tempe: | 2.0% |
Percentage of people born in this state:
Percentage of people born in another U.S. state:
Percentage of native residents but born outside the U.S.:
Percentage of foreign born residents:
| Here: | 37.6% |
| Tempe: | 39.3% |
Percentage of people born in another U.S. state:
| Baseline-Hardy: | 46.0% |
| Tempe: | 46.0% |
Percentage of native residents but born outside the U.S.:
| Here: | 2.1% |
| city: | 1.8% |
Percentage of foreign born residents:
| Here: | 14.4% |
| Tempe: | 12.9% |
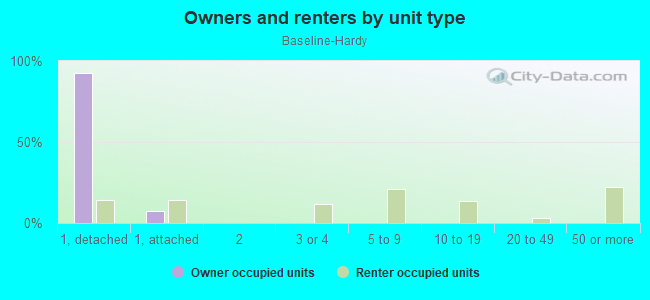
Owner-occupied
Renter-occupied

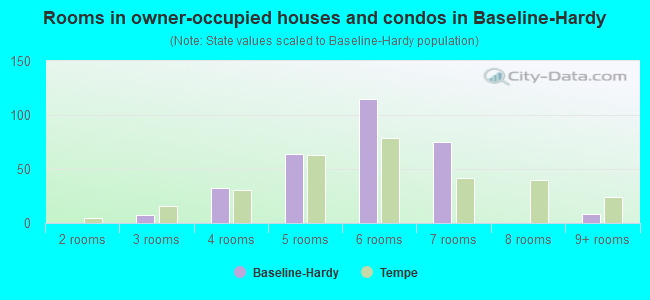
- Rooms in owner-occupied houses and condos in Baseline-Hardy
- 01 room
- 02 rooms
- 73 rooms
- 324 rooms
- 645 rooms
- 1156 rooms
- 757 rooms
- 08 rooms
- 89+ rooms
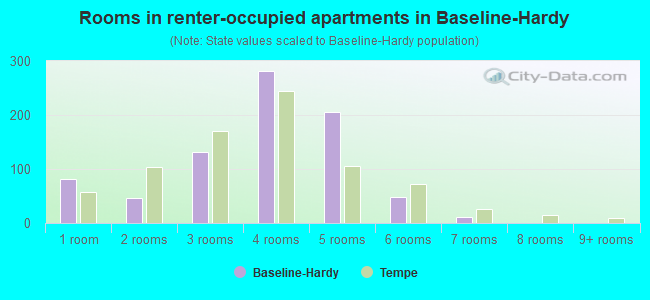
- Rooms in renter-occupied apartments in Baseline-Hardy
- 821 room
- 472 rooms
- 1313 rooms
- 2824 rooms
- 2055 rooms
- 486 rooms
- 127 rooms
- 08 rooms
- 09+ rooms
Owner-occupied
Renter-occupied
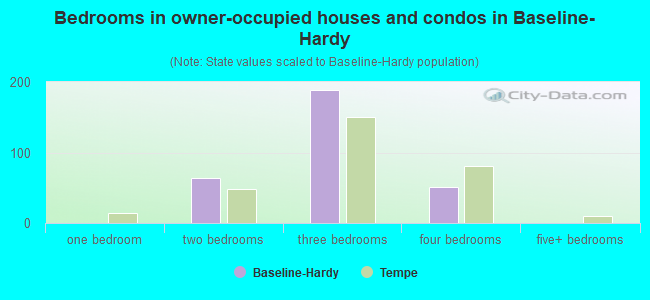
- Bedrooms in owner-occupied houses and condos in Baseline-Hardy
- 0no bedroom
- 01 bedroom
- 642 bedrooms
- 1893 bedrooms
- 514 bedrooms
- 05+ bedrooms
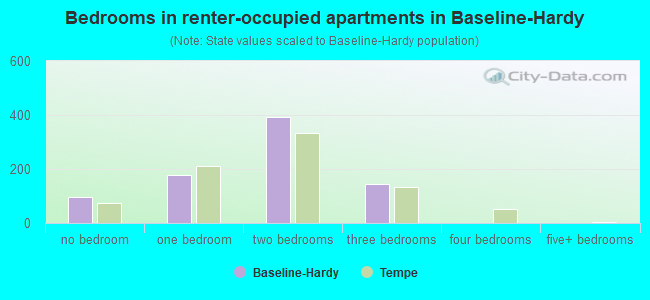
- Bedrooms in renter-occupied apartments in Baseline-Hardy
- 95no bedroom
- 1761 bedroom
- 3922 bedrooms
- 1463 bedrooms
- 04 bedrooms
- 05+ bedrooms
Average number of cars or other vehicles available in houses/condos:
Average number of cars or other vehicles available in apartments:
| This neighborhood: | 1.9 |
| Tempe: | 2.0 |
Average number of cars or other vehicles available in apartments:
| Here: | 1.3 |
| city: | 1.6 |
Percentage of units with a mortgage:
| Baseline-Hardy: | 81.7% |
| Tempe: | 69.2% |
Housing prices:
- Average estimated value of detached houses in 2022 (34.2% of all units):
Baseline-Hardy: $286,935 Tempe: $535,475
- Average estimated value of townhouses or other attached units in 2022 (13.2% of all units):
This neighborhood: $279,190 city: $325,212
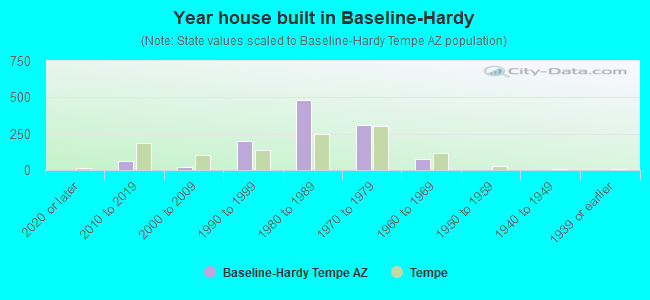
- Year house built in Baseline-Hardy
- 02020 or later
- 642010 to 2019
- 232000 to 2009
- 1981990 to 1999
- 4821980 to 1989
- 3121970 to 1979
- 761960 to 1969
- 01950 to 1959
- 01940 to 1949
- 01939 or earlier
City-data.com crime index for city in 2020 (higher means more crime):
| City: | 347.1 |
| U.S. average: | 219.5 |
Travel time to work (commute)
![Travel time to work (commute)]()
- 13Less than 5 minutes
- 1265 to 9 minutes
- 22110 to 14 minutes
- 32615 to 19 minutes
- 21920 to 24 minutes
- 16125 to 29 minutes
- 19030 to 34 minutes
- 5235 to 39 minutes
- 3940 to 44 minutes
- 2745 to 59 minutes
- 2060 to 89 minutes

Means of transportation to work
![Means of transportation to work]()
- 62.7%987Drove a car alone
- 13.8%218Carpooled
- 5.3%84Bus
- 4.5%71Taxi
- 0.5%8Bicycle
- 1.8%28Other means
- 11.1%174Worked at home

Time leaving home to go to work
![Time leaving home to go to work]()
- 2912:00 a.m. to 4:59 a.m.
- 215:00 a.m. to 5:29 a.m.
- 365:30 a.m. to 5:59 a.m.
- 666:00 a.m. to 6:29 a.m.
- 686:30 a.m. to 6:59 a.m.
- 1337:00 a.m. to 7:29 a.m.
- 1737:30 a.m. to 7:59 a.m.
- 2218:00 a.m. to 8:29 a.m.
- 1668:30 a.m. to 8:59 a.m.
- 1399:00 a.m. to 9:59 a.m.
- 3910:00 a.m. to 10:59 a.m.
- 611:00 a.m. to 11:59 a.m.
- 12512:00 p.m. to 3:59 p.m.
- 1734:00 p.m. to 11:59 p.m.

Occupations of males:
- Percentage of males in management occupations (except farmers):
Here: 6.1% city: 10.2%
- Percentage of males in business and financial operations occupations:
Here: 4.5% city: 6.5%
- Percentage of males in computer and mathematical occupations:
Here: 11.3% city: 8.4%
- Percentage of males in architecture and engineering occupations:
Here: 1.5% city: 5.0%
- Percentage of males in community and social services occupations:
Here: 1.8% city: 1.1%
- Percentage of males in education, training, and library occupations:
Here: 2.5% city: 6.1%
- Percentage of males in healthcare practitioners and technical occupations:
Here: 3.6% city: 2.8%
- Percentage of males in service occupations:
Here: 16.1% city: 14.4%
- Percentage of males in sales and office occupations:
Here: 12.9% city: 19.0%
- Percentage of males in construction, extraction, and maintenance occupations:
Here: 8.8% city: 5.1%
- Percentage of males in production occupations:
Here: 8.5% city: 4.4%
- Percentage of males in transportation occupations:
Here: 13.3% city: 3.9%
- Percentage of males in material moving occupations:
Here: 4.5% city: 3.5%
Occupations of females:
- Percentage of females in management occupations (except farmers):
Here: 6.8% city: 7.5%
- Percentage of females in business and financial operations occupations:
Here: 8.7% city: 9.3%
- Percentage of females in computer and mathematical occupations:
Here: 2.1% city: 3.3%
- Percentage of females in life, physical, and social science occupations:
Here: 4.2% city: 1.5%
- Percentage of females in community and social services occupations:
Here: 1.3% city: 3.4%
- Percentage of females in education, training, and library occupations:
Here: 10.6% city: 12.0%
- Percentage of females in arts, design, entertainment, sports, and media occupations:
Here: 11.6% city: 3.1%
- Percentage of females in healthcare practitioners and technical occupations:
Here: 12.3% city: 7.4%
- Percentage of females in service occupations:
Here: 14.7% city: 18.9%
- Percentage of females in sales and office occupations:
Here: 27.1% city: 26.9%
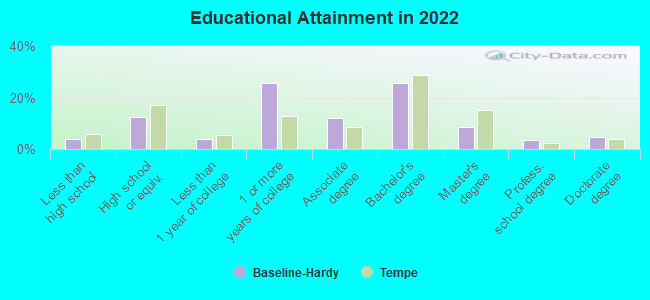
Education in this neighborhood (subdivision or community):
- Percentage of people 3 years and older in K-12 schools:
Baseline-Hardy: 10.5% Tempe: 12.5%
- Percentage of people 3 years and older in undergraduate colleges:
Baseline-Hardy: 4.8% Tempe: 15.4%
- Percentage of people 3 years and older in grad. or professional schools:
Baseline-Hardy: 1.6% Tempe: 6.3%
- Percentage of students K-12 enrolled in private schools:
Baseline-Hardy: 0.0% Tempe: 9.2%
Percentage of population below poverty level:
| Baseline-Hardy: | 16.5% |
| Tempe: | 15.0% |
Median year owner moved in (as recorded in 2022):
| Baseline-Hardy: | 2006 |
| Tempe: | 2013 |
Percentage of married-couple families with both working:
| Baseline-Hardy: | 33.9% |
| Tempe: | 77.6% |
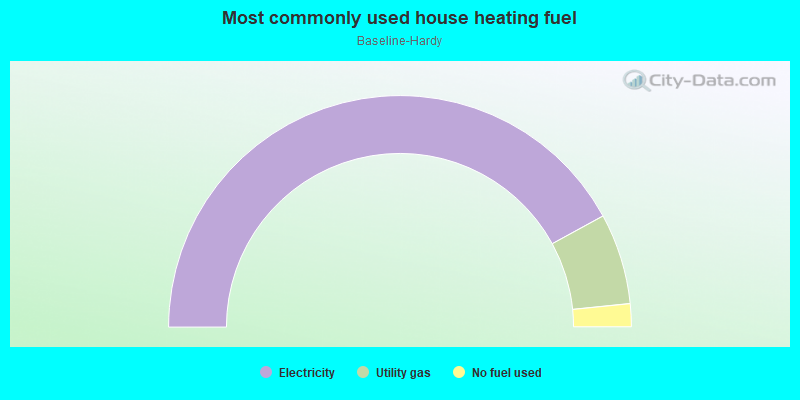
- 84.1%Electricity
- 12.7%Utility gas
- 3.2%No fuel used
Roads and streets:
S Hardy Dr (Hardy Dr)
Length: 0.30 miles
Direction: N-S
Address range: 4584 to 5125
Direction: N-S
Address range: 4584 to 5125
S Beck Ave
Length: 0.27 miles
Directions: E-W, N-S, SE-NW, SW-NE
Address range: 4500 to 5199
Directions: E-W, N-S, SE-NW, SW-NE
Address range: 4500 to 5199
W Greenway Dr
Length: 0.27 miles
Directions: E-W, SE-NW
Address range: 1000 to 1199
Directions: E-W, SE-NW
Address range: 1000 to 1199
Western Canal
Length: 0.25 miles
Direction: E-W
Direction: E-W
W Fremont Dr
Length: 0.25 miles
Direction: E-W
Address range: 1000 to 1199
Direction: E-W
Address range: 1000 to 1199
S Terry Ln
Length: 0.24 miles
Directions: E-W, N-S, SW-NE
Address range: 4800 to 5199
Directions: E-W, N-S, SW-NE
Address range: 4800 to 5199
S Parkside Dr
Length: 0.19 miles
Directions: N-S, SW-NE
Address range: 4600 to 4899
Directions: N-S, SW-NE
Address range: 4600 to 4899
W Minton Dr
Length: 0.11 miles
Direction: E-W
Address range: 1000 to 1099
Direction: E-W
Address range: 1000 to 1099
W Carter Dr
Length: 0.10 miles
Direction: E-W
Address range: 1000 to 1099
Direction: E-W
Address range: 1000 to 1099
W Baseline Rd
Length: 0.10 miles
Direction: E-W
Address range: 1184 to 1243
Direction: E-W
Address range: 1184 to 1243
S Roberts Rd
Length: 0.10 miles
Directions: N-S, SW-NE
Address range: 4600 to 4899
Directions: N-S, SW-NE
Address range: 4600 to 4899
W Ellis Dr
Length: 0.09 miles
Direction: E-W
Address range: 1114 to 1148
Direction: E-W
Address range: 1114 to 1148
W Dunbar Dr
Length: 0.08 miles
Directions: E-W, SW-NE
Address range: 1100 to 1149
Directions: E-W, SW-NE
Address range: 1100 to 1149
W Donner Dr
Length: 0.07 miles
Directions: E-W, SE-NW
Address range: 1100 to 1199
Directions: E-W, SE-NW
Address range: 1100 to 1199
W Carson Dr
Length: 0.07 miles
Directions: E-W, SE-NW, SW-NE
Address range: 1100 to 2801
Directions: E-W, SE-NW, SW-NE
Address range: 1100 to 2801