Arts District neighborhood in Worcester, Massachusetts (MA), 01608, 01609, 01610 detailed profile
Settings
X

Business Search - 14 Million verified businesses
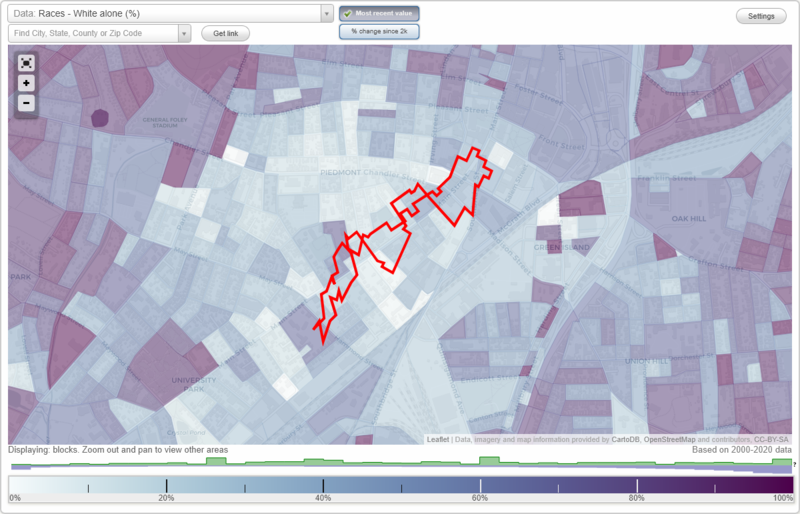
Area: 0.086 square miles
Population: 1,901
Population density:
| Arts District: | 22,131 people per square mile |
| Worcester: | 5,466 people per square mile |

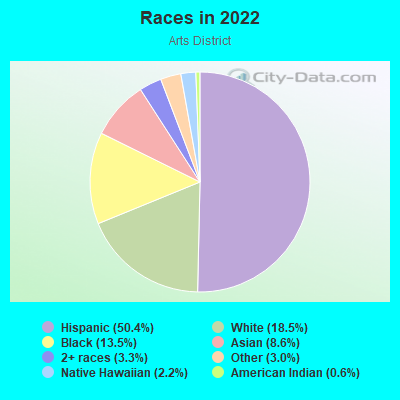
- 1,00650.4%Hispanic or Latino
- 37018.5%White
- 26913.5%Black
- 1728.6%Asian
- 653.3%Two or more races
- 593.0%Some other race
- 432.2%Native Hawaiian and Other
Pacific Islander - 120.6%American Indian
Distribution of median household income
![Distribution of median household income]()
- 205Less than $10,000
- 169$10,000 to $19,999
- 146$20,000 to $29,999
- 108$30,000 to $39,999
- 77$40,000 to $49,999
- 84$50,000 to $59,999
- 35$60,000 to $74,999
- 63$75,000 to $99,999
- 35$100,000 to $124,999
- 67$125,000 to $149,999
- 46$150,000 to $199,999
- 29$200,000 or more

Distribution of owner-occupied house/condo value
![Distribution of owner-occupied house/condo value]()
- 41Less than $50,000
- 54$50,000 to $99,999
- 14$100,000 to $149,999
- 50$150,000 to $199,999
- 28$200,000 to $249,999
- 16$250,000 to $299,999
- 25$300,000 to $399,999
- 6$400,000 to $499,999
- 20$500,000 to $749,999

Distribution of rent paid by renters
![Distribution of rent paid by renters]()
- 14Less than $100
- 62$100 to $199
- 387$200 to $299
- 120$300 to $399
- 37$400 to $499
- 114$500 to $599
- 121$600 to $699
- 89$700 to $799
- 81$800 to $899
- 93$900 to $999
- 114$1,000 to $1,249
- 144$1,250 to $1,499
- 156$1,500 to $1,999
- 92$2,000 or more

Median rent in 2022:
| Arts District: | $1,119 |
| Worcester: | $1,146 |
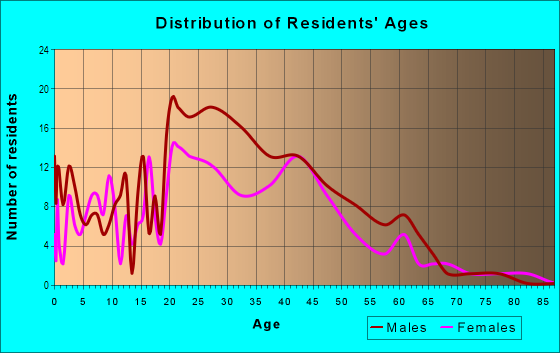
| Males: | 877 |
| Females: | 1,023 |
Males:
| This neighborhood: | 30.9 years |
| Whole city: | 31.5 years |
| This neighborhood: | 31.9 years |
| Whole city: | 35.1 years |
Average household size:
| Arts District: | 2.2 people |
| Worcester: | 2.4 people |
Percentage of family households:
| Arts District: | 32.7% |
| Worcester: | 41.9% |
| Here: | 14.9% |
| Worcester: | 31.4% |
Percentage of married-couple families with children (among all households):
| Arts District: | 12.0% |
| Worcester: | 20.2% |
Percentage of single-mother households (among all households):
| Arts District: | 40.1% |
| Worcester: | 14.5% |
Percentage of never married males 15 years old and over:
Percentage of never married females 15 years old and over:
| Arts District: | 28.0% |
| Worcester: | 25.6% |
Percentage of never married females 15 years old and over:
| Arts District: | 31.8% |
| city: | 24.1% |
Percentage of people that speak English not well or not at all:
| Arts District: | 16.5% |
| Worcester: | 9.8% |
Percentage of people born in this state:
Percentage of people born in another U.S. state:
Percentage of native residents but born outside the U.S.:
Percentage of foreign born residents:
| Here: | 41.9% |
| Worcester: | 51.0% |
Percentage of people born in another U.S. state:
| Arts District: | 11.5% |
| Worcester: | 17.1% |
Percentage of native residents but born outside the U.S.:
| Here: | 11.5% |
| city: | 7.1% |
Percentage of foreign born residents:
| Here: | 35.1% |
| Worcester: | 24.8% |
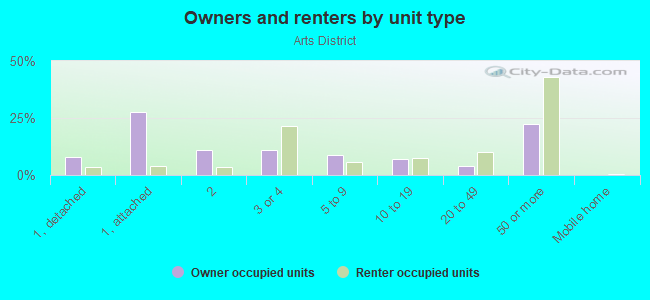
Owner-occupied
Renter-occupied

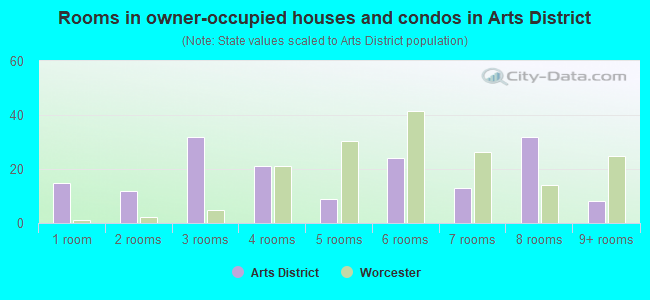
- Rooms in owner-occupied houses and condos in Arts District
- 151 room
- 122 rooms
- 323 rooms
- 214 rooms
- 95 rooms
- 246 rooms
- 137 rooms
- 328 rooms
- 89+ rooms
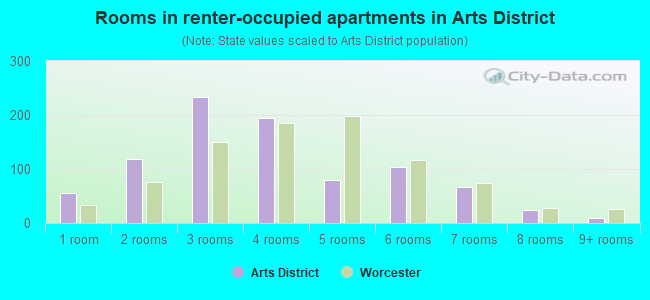
- Rooms in renter-occupied apartments in Arts District
- 551 room
- 1192 rooms
- 2343 rooms
- 1954 rooms
- 805 rooms
- 1036 rooms
- 677 rooms
- 258 rooms
- 99+ rooms
Owner-occupied
Renter-occupied
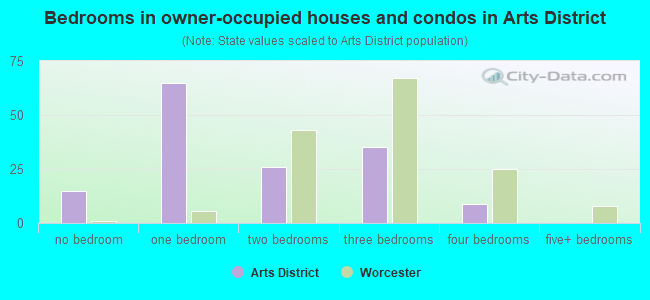
- Bedrooms in owner-occupied houses and condos in Arts District
- 15no bedroom
- 651 bedroom
- 262 bedrooms
- 353 bedrooms
- 94 bedrooms
- 05+ bedrooms
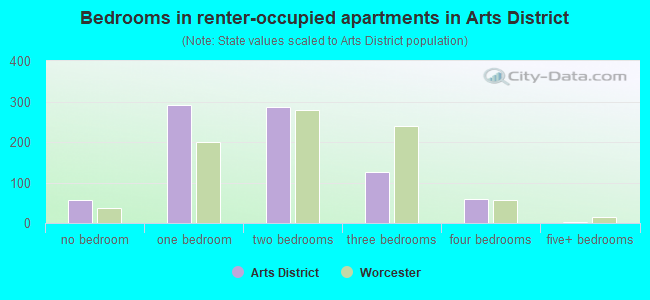
- Bedrooms in renter-occupied apartments in Arts District
- 58no bedroom
- 2911 bedroom
- 2872 bedrooms
- 1273 bedrooms
- 604 bedrooms
- 35+ bedrooms
Average number of cars or other vehicles available in houses/condos:
Average number of cars or other vehicles available in apartments:
| This neighborhood: | |
| Worcester: |
Average number of cars or other vehicles available in apartments:
| Here: | 0.9 |
| city: | 1.1 |
Percentage of units with a mortgage:
| Arts District: | 80.9% |
| Worcester: | 64.2% |
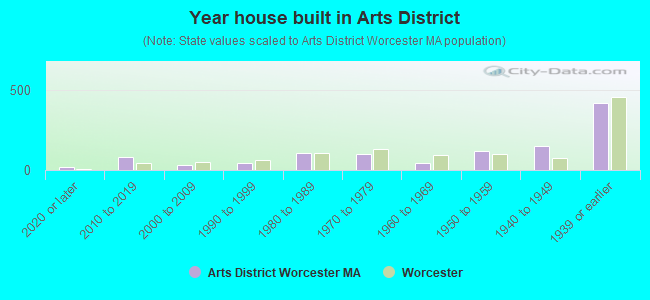
- Year house built in Arts District
- 172020 or later
- 832010 to 2019
- 342000 to 2009
- 451990 to 1999
- 1061980 to 1989
- 981970 to 1979
- 451960 to 1969
- 1161950 to 1959
- 1521940 to 1949
- 4171939 or earlier
City-data.com crime index for city in 2020 (higher means more crime):
| City: | 261.0 |
| U.S. average: | 219.5 |
Travel time to work (commute)
![Travel time to work (commute)]()
- 70Less than 5 minutes
- 785 to 9 minutes
- 14010 to 14 minutes
- 7515 to 19 minutes
- 9120 to 24 minutes
- 7525 to 29 minutes
- 9430 to 34 minutes
- 1835 to 39 minutes
- 1440 to 44 minutes
- 6445 to 59 minutes
- 3460 to 89 minutes
- 1990 or more minutes

Means of transportation to work
![Means of transportation to work]()
- 54.2%397Drove a car alone
- 14.1%103Carpooled
- 8.3%61Bus
- 3.0%22Long-distance train or commuter rail
- 6.6%48Taxi
- 13.9%102Walked
- 1.1%8Other means
- 9.7%71Worked at home

Time leaving home to go to work
![Time leaving home to go to work]()
- 4112:00 a.m. to 4:59 a.m.
- 195:00 a.m. to 5:29 a.m.
- 355:30 a.m. to 5:59 a.m.
- 756:00 a.m. to 6:29 a.m.
- 326:30 a.m. to 6:59 a.m.
- 887:00 a.m. to 7:29 a.m.
- 857:30 a.m. to 7:59 a.m.
- 848:00 a.m. to 8:29 a.m.
- 308:30 a.m. to 8:59 a.m.
- 359:00 a.m. to 9:59 a.m.
- 3010:00 a.m. to 10:59 a.m.
- 511:00 a.m. to 11:59 a.m.
- 14112:00 p.m. to 3:59 p.m.
- 514:00 p.m. to 11:59 p.m.

Occupations of males:
- Percentage of males in management occupations (except farmers):
Here: 10.6% city: 8.4%
- Percentage of males in business and financial operations occupations:
Here: 4.0% city: 4.5%
- Percentage of males in computer and mathematical occupations:
Here: 3.5% city: 4.6%
- Percentage of males in architecture and engineering occupations:
Here: 3.0% city: 3.3%
- Percentage of males in life, physical, and social science occupations:
Here: 3.4% city: 3.0%
- Percentage of males in community and social services occupations:
Here: 3.2% city: 1.8%
- Percentage of males in education, training, and library occupations:
Here: 4.4% city: 5.2%
- Percentage of males in arts, design, entertainment, sports, and media occupations:
Here: 2.8% city: 1.7%
- Percentage of males in healthcare practitioners and technical occupations:
Here: 4.0% city: 3.7%
- Percentage of males in service occupations:
Here: 21.6% city: 16.5%
- Percentage of males in sales and office occupations:
Here: 9.3% city: 14.9%
- Percentage of males in construction, extraction, and maintenance occupations:
Here: 9.2% city: 7.7%
- Percentage of males in production occupations:
Here: 9.2% city: 6.9%
- Percentage of males in transportation occupations:
Here: 7.1% city: 6.2%
- Percentage of males in material moving occupations:
Here: 3.7% city: 5.9%
Occupations of females:
- Percentage of females in management occupations (except farmers):
Here: 4.0% city: 9.1%
- Percentage of females in business and financial operations occupations:
Here: 2.9% city: 4.0%
- Percentage of females in computer and mathematical occupations:
Here: 2.2% city: 1.7%
- Percentage of females in life, physical, and social science occupations:
Here: 1.3% city: 1.8%
- Percentage of females in community and social services occupations:
Here: 3.0% city: 3.1%
- Percentage of females in education, training, and library occupations:
Here: 18.9% city: 10.2%
- Percentage of females in arts, design, entertainment, sports, and media occupations:
Here: 1.2% city: 1.6%
- Percentage of females in healthcare practitioners and technical occupations:
Here: 4.6% city: 10.7%
- Percentage of females in service occupations:
Here: 30.1% city: 24.7%
- Percentage of females in sales and office occupations:
Here: 17.2% city: 22.5%
- Percentage of females in production occupations:
Here: 4.1% city: 3.9%
- Percentage of females in transportation occupations:
Here: 5.8% city: 1.1%
- Percentage of females in material moving occupations:
Here: 4.7% city: 3.3%
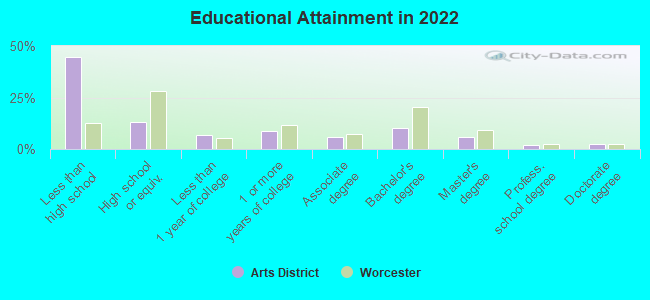
Education in this neighborhood (subdivision or community):
- Percentage of people 3 years and older in K-12 schools:
Arts District: 20.0% Worcester: 14.0%
- Percentage of people 3 years and older in undergraduate colleges:
Arts District: 10.5% Worcester: 13.1%
- Percentage of people 3 years and older in grad. or professional schools:
Arts District: 8.5% Worcester: 2.4%
- Percentage of students K-12 enrolled in private schools:
Arts District: 21.9% Worcester: 12.6%
Percentage of population below poverty level:
| Arts District: | 35.9% |
| Worcester: | 19.9% |
Median year renter moved in (as recorded in 2022):
| Arts District: | 2016 |
| Worcester: | 2019 |
Percentage of married-couple families with both working:
| Arts District: | 121.4% |
| Worcester: | 76.4% |
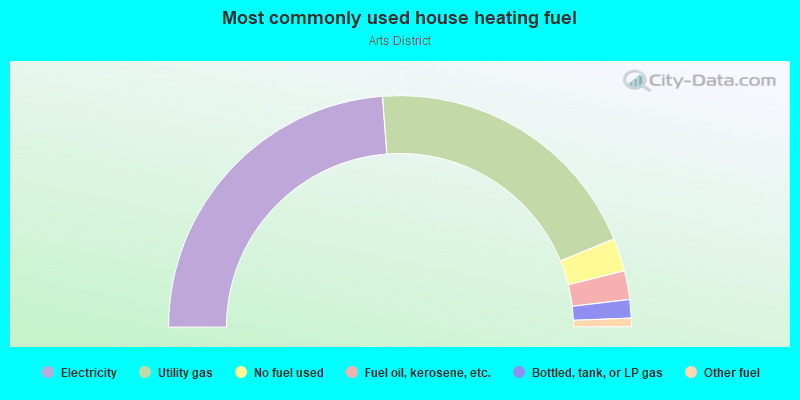
- 47.6%Electricity
- 40.0%Utility gas
- 4.6%No fuel used
- 4.0%Fuel oil, kerosene, etc.
- 2.6%Bottled, tank, or LP gas
- 1.2%Other fuel
Highways in this neighborhood:
State Hwy 122 (Madison St)
Length: 0.08 miles
Direction: SE-NW
Address range: 1 to 33
Direction: SE-NW
Address range: 1 to 33
Roads and streets:
Main St
Length: 0.80 miles
Direction: SW-NE
Address range: 583 to 771
Direction: SW-NE
Address range: 583 to 771
Jackson St
Length: 0.23 miles
Direction: SE-NW
Address range: 1 to 62
Direction: SE-NW
Address range: 1 to 62
Beacon St
Length: 0.18 miles
Direction: SW-NE
Address range: 1 to 90
Direction: SW-NE
Address range: 1 to 90
Hermon St
Length: 0.13 miles
Direction: SE-NW
Address range: 1 to 50
Direction: SE-NW
Address range: 1 to 50
Burnside Ct
Length: 0.06 miles
Direction: E-W
Address range: 1 to 12
Direction: E-W
Address range: 1 to 12
Myrtle St
Length: 0.06 miles
Direction: SE-NW
Address range: 1 to 44
Direction: SE-NW
Address range: 1 to 44
Harris Ct
Length: 0.06 miles
Direction: SW-NE
Address range: 1 to 19
Direction: SW-NE
Address range: 1 to 19
Castle St
Length: 0.06 miles
Direction: SE-NW
Address range: 1 to 13
Direction: SE-NW
Address range: 1 to 13
Southbridge St
Length: 0.05 miles
Direction: N-S
Address range: 9 to 99
Direction: N-S
Address range: 9 to 99