Kannapolis, North Carolina Neighborhood Map - Income, House Prices, Occupations, Boundaries
Settings
X

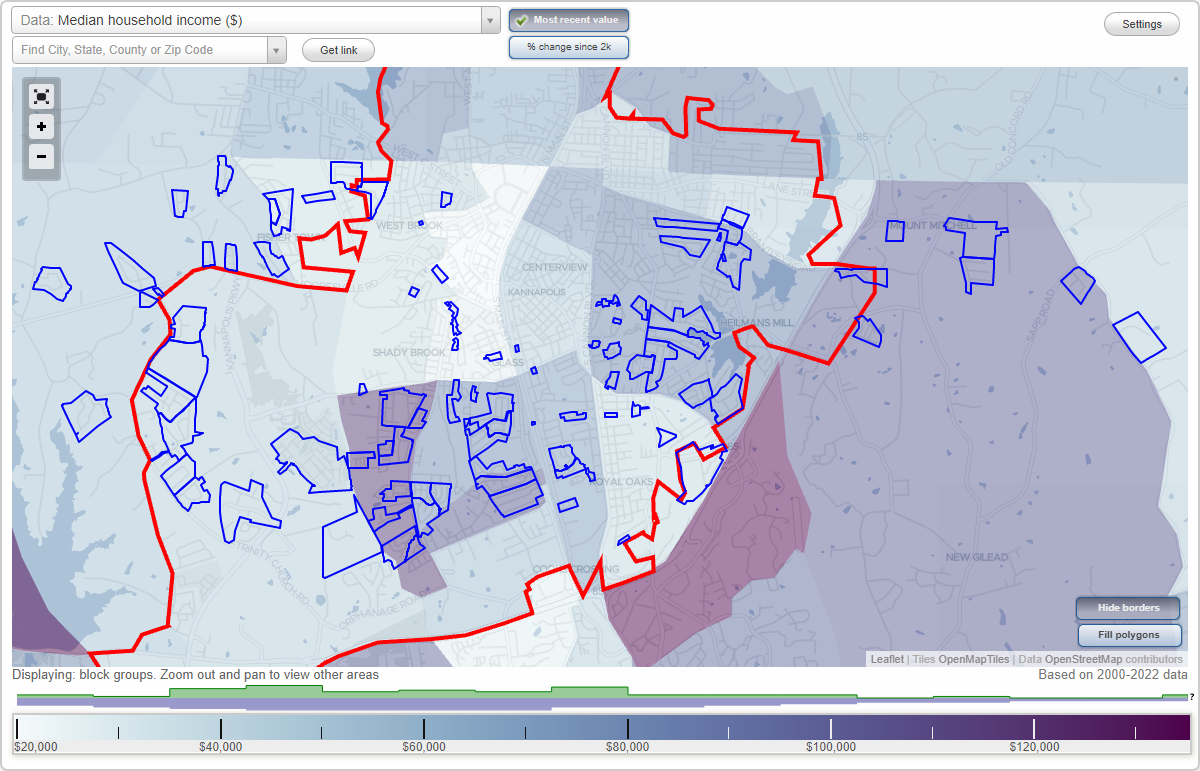
- City boundary
- Neighborhood boundaries
Business Search - 14 Million verified businesses
Neighborhoods:
Allytin Heights, Beaumont Park, Beaver Pond, Bethwood, Brantley Creek, Brantley Woods, Brentwood, Briarcliff, Cabarrus NW Wood, Cedar Croft, Cedar Heights, Central Park, Cloverlead Mobile Home Park, Cook's Trailer Park, Country Knoll, Cripple Creek, Dakota Woods, Dancy's Mobile Home Park, Devonshire, Dove Field, Eastway Village, Elwood Estates, Evergreen Heights, Forest Brook, Forest Glen, Forest Ridge, Fox Hunt, Freedom Park, Furr's Mobile Home Park, Kellswater Bridge, Kentwood, Lansdowne, Lantern Green, Leisure Mobile Home Park, Manchester Place, Mcclain Heights, Meadowbrook Condos, Medlin Crossing, Millbrooke, Mission Hills, Mitchell Glen, Moss Acres, Mountain Vine, Murry Hills, Newman Manor, Northcrest Business Park, Oak Crest, Oakbrook, Olde Colony, Palace Chase, Pickwick, Pine Creek, Pleasant Avenue Trailer Park, Princeton, Private Acres, Queen's Gate, Quiet Corners Minor, Ravendale Mobile Home Park, Realticorp, Reynolds Mobile Home Park, Salem Creek, Scottish Square Mobile Home Park, Sears Street, Serenity Estates, Settlers Ridge, Shady Oaks Mobile Home Park, Shadybrook Mobile Home Park, Sherwood Forest, Sidneys Grove, Sommerfield, South Ridge Estates, Southwood Park, Spud Valley, Stonewyck, The Colony, The States, Timberridge, Tranquility, Trinity Woods, Universal Mobile Home Park, Villa Mobile Home Park, Villamont Height, Wagstaff's Town Country Mobile Home Park, Walker Park, Waterside Landing, West Oaks, Westgate Park, Whispering Winds, Wildwood Estates, Windsor, Woodmore, Wren St Mobile Home ParkAllytin Heights neighborhood in Kannapolis statistics: (Find on map)
Area: 0.009 square miles
Roads and streets: Bernard Ave.
Allytin Heights neighborhood detailed profile
Area: 0.009 square miles
Roads and streets: Bernard Ave.
Allytin Heights neighborhood detailed profile
Beaumont Park neighborhood in Kannapolis statistics: (Find on map)
Area: 0.049 square miles
Roads and streets: Kingston Dr.
Beaumont Park neighborhood detailed profile
Area: 0.049 square miles
Roads and streets: Kingston Dr.
Beaumont Park neighborhood detailed profile
Beaver Pond neighborhood in Kannapolis statistics: (Find on map)
Area: 0.078 square miles
Roads and streets: Midlake Ave; Forest Pond Rd; Fisher Ridge Rd; Crosswinds Ct; Pondside Ct; Lower Pond Rd; Beaver Pond Rd.
Beaver Pond neighborhood detailed profile
Area: 0.078 square miles
Roads and streets: Midlake Ave; Forest Pond Rd; Fisher Ridge Rd; Crosswinds Ct; Pondside Ct; Lower Pond Rd; Beaver Pond Rd.
Beaver Pond neighborhood detailed profile
Bethwood neighborhood in Kannapolis statistics: (Find on map)
Area: 0.023 square miles
Bethwood neighborhood detailed profile
Area: 0.023 square miles
Bethwood neighborhood detailed profile
Brantley Creek neighborhood in Kannapolis statistics: (Find on map)
Area: 0.045 square miles
Roads and streets: Brantley Creek Dr; Samantha Dr; Barbara Ann Cir; Tammy Ct; Shepard St.
Brantley Creek neighborhood detailed profile
Area: 0.045 square miles
Roads and streets: Brantley Creek Dr; Samantha Dr; Barbara Ann Cir; Tammy Ct; Shepard St.
Brantley Creek neighborhood detailed profile
Brantley Woods neighborhood in Kannapolis statistics: (Find on map)
Area: 0.051 square miles
Population: 4
Population density:
Median household income in 2021:
Median rent in in 2021:
Male vs Females
Median age
Housing prices:
Average estimated value of detached houses in 2021 (50.0% of all units):
Most popular occupations of males: material moving occupations (21.3%); service occupations (18.6%); management occupations (except farmers) (12.1%); transportation occupations (12.1%); construction, extraction, and maintenance occupations (7.0%); business and financial operations occupations (5.9%); healthcare practitioners and technical occupations (5.5%)
Most popular occupations of females: business and financial operations occupations (31.3%); sales and office occupations (26.3%); material moving occupations (15.8%); management occupations (except farmers) (9.3%); service occupations (9.0%); education, training, and library occupations (6.9%); legal occupations (4.5%)
Roads and streets: Ireton Pl; Ireton Ct; Halverson Ct.
Brantley Woods neighborhood detailed profile
Area: 0.051 square miles
Population: 4
Population density:
| Brantley Woods: | 78 people per square mile |
| Kannapolis: | 1,748 people per square mile |
Median household income in 2021:
| Brantley Woods: | $96,484 |
| Kannapolis: | $58,084 |
Median rent in in 2021:
| Brantley Woods: | $1,046 |
| Kannapolis: | $733 |
Male vs Females
| Males: | 2 |
| Females: | 2 |
Median age
| Males: | 49.3 years |
| Females: | 49.6 years |
Housing prices:
Average estimated value of detached houses in 2021 (50.0% of all units):
| Brantley Woods: | $250,077 |
| North Carolina: | $316,354 |
Most popular occupations of males: material moving occupations (21.3%); service occupations (18.6%); management occupations (except farmers) (12.1%); transportation occupations (12.1%); construction, extraction, and maintenance occupations (7.0%); business and financial operations occupations (5.9%); healthcare practitioners and technical occupations (5.5%)
Most popular occupations of females: business and financial operations occupations (31.3%); sales and office occupations (26.3%); material moving occupations (15.8%); management occupations (except farmers) (9.3%); service occupations (9.0%); education, training, and library occupations (6.9%); legal occupations (4.5%)
Roads and streets: Ireton Pl; Ireton Ct; Halverson Ct.
Brantley Woods neighborhood detailed profile
Brentwood neighborhood in Kannapolis statistics: (Find on map)
Area: 0.033 square miles
Population: 37
Population density:
Median household income in 2021:
Median rent in in 2021:
Male vs Females
Median age
Average estimated value of detached houses in 2021 (94.7% of all units):
Most popular occupations of males: service occupations (25.6%); transportation occupations (18.9%); material moving occupations (16.6%); construction, extraction, and maintenance occupations (14.2%); life, physical, and social science occupations (6.0%); management occupations (except farmers) (3.8%); sales and office occupations (3.0%)
Most popular occupations of females: service occupations (23.9%); management occupations (except farmers) (19.2%); sales and office occupations (17.0%); education, training, and library occupations (13.0%); arts, design, entertainment, sports, and media occupations (10.9%); legal occupations (6.2%); production occupations (5.8%)
Roads and streets: Burning Lantern Ln; Lamp Post Ln; Candlewyck Ct; Light House Ln.
Brentwood neighborhood detailed profile
Area: 0.033 square miles
Population: 37
Population density:
| Brentwood: | 1,110 people per square mile |
| Kannapolis: | 1,748 people per square mile |
Median household income in 2021:
| Brentwood: | $45,905 |
| Kannapolis: | $58,084 |
Median rent in in 2021:
| Brentwood: | $819 |
| Kannapolis: | $733 |
Male vs Females
| Males: | 18 |
| Females: | 19 |
Median age
| Males: | 49.1 years |
| Females: | 40.1 years |
Average estimated value of detached houses in 2021 (94.7% of all units):
| Brentwood: | $162,769 |
| North Carolina: | $316,354 |
Most popular occupations of males: service occupations (25.6%); transportation occupations (18.9%); material moving occupations (16.6%); construction, extraction, and maintenance occupations (14.2%); life, physical, and social science occupations (6.0%); management occupations (except farmers) (3.8%); sales and office occupations (3.0%)
Most popular occupations of females: service occupations (23.9%); management occupations (except farmers) (19.2%); sales and office occupations (17.0%); education, training, and library occupations (13.0%); arts, design, entertainment, sports, and media occupations (10.9%); legal occupations (6.2%); production occupations (5.8%)
Roads and streets: Burning Lantern Ln; Lamp Post Ln; Candlewyck Ct; Light House Ln.
Brentwood neighborhood detailed profile
Briarcliff neighborhood in Kannapolis statistics: (Find on map)
Area: 0.061 square miles
Population: 90
Population density:
Median household income in 2021:
Median rent in in 2021:
Male vs Females
Median age
Average estimated value of detached houses in 2021 (88.9% of all units):
Most popular occupations of males: transportation occupations (20.6%); service occupations (17.6%); construction, extraction, and maintenance occupations (11.9%); material moving occupations (9.8%); management occupations (except farmers) (9.4%); production occupations (9.1%); life, physical, and social science occupations (3.6%)
Most popular occupations of females: education, training, and library occupations (18.9%); service occupations (17.2%); sales and office occupations (15.9%); healthcare practitioners and technical occupations (15.1%); management occupations (except farmers) (14.6%); community and social services occupations (6.0%); arts, design, entertainment, sports, and media occupations (6.0%)
Roads and streets: Briarcliff Dr; Meadowood Cir; Cliffside Dr.
Briarcliff neighborhood detailed profile
Area: 0.061 square miles
Population: 90
Population density:
| Briarcliff: | 1,484 people per square mile |
| Kannapolis: | 1,748 people per square mile |
Median household income in 2021:
| Briarcliff: | $72,014 |
| Kannapolis: | $58,084 |
Median rent in in 2021:
| Briarcliff: | $679 |
| Kannapolis: | $733 |
Male vs Females
| Males: | 47 |
| Females: | 43 |
Median age
| Males: | 44.2 years |
| Females: | 43.3 years |
Average estimated value of detached houses in 2021 (88.9% of all units):
| Briarcliff: | $182,871 |
| North Carolina: | $316,354 |
Most popular occupations of males: transportation occupations (20.6%); service occupations (17.6%); construction, extraction, and maintenance occupations (11.9%); material moving occupations (9.8%); management occupations (except farmers) (9.4%); production occupations (9.1%); life, physical, and social science occupations (3.6%)
Most popular occupations of females: education, training, and library occupations (18.9%); service occupations (17.2%); sales and office occupations (15.9%); healthcare practitioners and technical occupations (15.1%); management occupations (except farmers) (14.6%); community and social services occupations (6.0%); arts, design, entertainment, sports, and media occupations (6.0%)
Roads and streets: Briarcliff Dr; Meadowood Cir; Cliffside Dr.
Briarcliff neighborhood detailed profile
Cabarrus NW Wood neighborhood in Kannapolis statistics: (Find on map)
Area: 0.061 square miles
Roads and streets: Woodchuck Dr; Dogwood Blvd (State Rd 1838).
Cabarrus NW Wood neighborhood detailed profile
Area: 0.061 square miles
Roads and streets: Woodchuck Dr; Dogwood Blvd (State Rd 1838).
Cabarrus NW Wood neighborhood detailed profile
Cedar Croft neighborhood in Kannapolis statistics: (Find on map)
Area: 0.096 square miles
Roads and streets: Bealgray Rd; Crofton Ave.
Cedar Croft neighborhood detailed profile
Area: 0.096 square miles
Roads and streets: Bealgray Rd; Crofton Ave.
Cedar Croft neighborhood detailed profile
Cedar Heights neighborhood in Kannapolis statistics: (Find on map)
Area: 0.004 square miles
Cedar Heights neighborhood detailed profile
Area: 0.004 square miles
Cedar Heights neighborhood detailed profile
Central Park neighborhood in Kannapolis statistics: (Find on map)
Area: 0.046 square miles
Population: 4
Population density:
Median household income in 2021:
Median rent in in 2021:
Male vs Females
Median age
Housing prices:
Average estimated value of detached houses in 2021 (100.0% of all units):
Most popular occupations of males: material moving occupations (21.3%); service occupations (18.6%); management occupations (except farmers) (12.1%); transportation occupations (12.1%); construction, extraction, and maintenance occupations (7.0%); business and financial operations occupations (5.6%); healthcare practitioners and technical occupations (5.5%)
Most popular occupations of females: business and financial operations occupations (31.3%); sales and office occupations (26.3%); material moving occupations (15.8%); management occupations (except farmers) (9.3%); service occupations (9.0%); education, training, and library occupations (6.6%); legal occupations (4.5%)
Roads and streets: Lan Patrick Ave; Sammuel Richard St; Hawfield St; Penny Early Ln; Elliot Jacob Ave.
Central Park neighborhood detailed profile
Area: 0.046 square miles
Population: 4
Population density:
| Central Park: | 86 people per square mile |
| Kannapolis: | 1,748 people per square mile |
Median household income in 2021:
| Central Park: | $96,484 |
| Kannapolis: | $58,084 |
Median rent in in 2021:
| Central Park: | $1,046 |
| Kannapolis: | $733 |
Male vs Females
| Males: | 2 |
| Females: | 2 |
Median age
| Males: | 49.3 years |
| Females: | 49.6 years |
Housing prices:
Average estimated value of detached houses in 2021 (100.0% of all units):
| Central Park: | $250,077 |
| North Carolina: | $316,354 |
Most popular occupations of males: material moving occupations (21.3%); service occupations (18.6%); management occupations (except farmers) (12.1%); transportation occupations (12.1%); construction, extraction, and maintenance occupations (7.0%); business and financial operations occupations (5.6%); healthcare practitioners and technical occupations (5.5%)
Most popular occupations of females: business and financial operations occupations (31.3%); sales and office occupations (26.3%); material moving occupations (15.8%); management occupations (except farmers) (9.3%); service occupations (9.0%); education, training, and library occupations (6.6%); legal occupations (4.5%)
Roads and streets: Lan Patrick Ave; Sammuel Richard St; Hawfield St; Penny Early Ln; Elliot Jacob Ave.
Central Park neighborhood detailed profile
Cloverlead Mobile Home Park neighborhood in Kannapolis statistics: (Find on map)
Area: 0.003 square miles
Cloverlead Mobile Home Park neighborhood detailed profile
Area: 0.003 square miles
Cloverlead Mobile Home Park neighborhood detailed profile
Cook's Trailer Park neighborhood in Kannapolis statistics: (Find on map)
Population: 1
Population density:
Median household income in 2021:
Median rent in in 2021:
Most popular occupations of males: sales and office occupations (26.5%); service occupations (18.1%); material moving occupations (9.7%); management occupations (except farmers) (9.3%); construction, extraction, and maintenance occupations (7.3%); life, physical, and social science occupations (6.2%); business and financial operations occupations (4.9%)
Most popular occupations of females: sales and office occupations (25.2%); service occupations (16.9%); management occupations (except farmers) (15.0%); healthcare practitioners and technical occupations (8.2%); business and financial operations occupations (5.5%); construction, extraction, and maintenance occupations (4.7%); production occupations (4.7%)
Cook's Trailer Park neighborhood detailed profile
Population: 1
Population density:
| Cook's Trailer Park: | 1,316 people per square mile |
| Kannapolis: | 1,748 people per square mile |
Median household income in 2021:
| Cook's Trailer Park: | $57,813 |
| Kannapolis: | $58,084 |
Median rent in in 2021:
| Cook's Trailer Park: | $807 |
| Kannapolis: | $733 |
Most popular occupations of males: sales and office occupations (26.5%); service occupations (18.1%); material moving occupations (9.7%); management occupations (except farmers) (9.3%); construction, extraction, and maintenance occupations (7.3%); life, physical, and social science occupations (6.2%); business and financial operations occupations (4.9%)
Most popular occupations of females: sales and office occupations (25.2%); service occupations (16.9%); management occupations (except farmers) (15.0%); healthcare practitioners and technical occupations (8.2%); business and financial operations occupations (5.5%); construction, extraction, and maintenance occupations (4.7%); production occupations (4.7%)
Cook's Trailer Park neighborhood detailed profile
Country Knoll neighborhood in Kannapolis statistics: (Find on map)
Area: 0.061 square miles
Population: 5
Population density:
Median household income in 2021:
Median rent in in 2021:
Male vs Females
Median age
Housing prices:
Average estimated value of detached houses in 2021 (100.0% of all units):
Most popular occupations of males: material moving occupations (21.3%); service occupations (18.6%); management occupations (except farmers) (12.1%); transportation occupations (12.1%); construction, extraction, and maintenance occupations (7.0%); business and financial operations occupations (5.8%); healthcare practitioners and technical occupations (5.5%)
Most popular occupations of females: business and financial operations occupations (31.2%); sales and office occupations (26.2%); material moving occupations (15.8%); management occupations (except farmers) (9.3%); service occupations (9.0%); education, training, and library occupations (6.8%); legal occupations (4.5%)
Roads and streets: Teakwood Dr; Tan Bark Ln.
Country Knoll neighborhood detailed profile
Area: 0.061 square miles
Population: 5
Population density:
| Country Knoll: | 82 people per square mile |
| Kannapolis: | 1,748 people per square mile |
Median household income in 2021:
| Country Knoll: | $96,484 |
| Kannapolis: | $58,084 |
Median rent in in 2021:
| Country Knoll: | $1,046 |
| Kannapolis: | $733 |
Male vs Females
| Males: | 2 |
| Females: | 2 |
Median age
| Males: | 49.3 years |
| Females: | 49.6 years |
Housing prices:
Average estimated value of detached houses in 2021 (100.0% of all units):
| Country Knoll: | $250,077 |
| North Carolina: | $316,354 |
Most popular occupations of males: material moving occupations (21.3%); service occupations (18.6%); management occupations (except farmers) (12.1%); transportation occupations (12.1%); construction, extraction, and maintenance occupations (7.0%); business and financial operations occupations (5.8%); healthcare practitioners and technical occupations (5.5%)
Most popular occupations of females: business and financial operations occupations (31.2%); sales and office occupations (26.2%); material moving occupations (15.8%); management occupations (except farmers) (9.3%); service occupations (9.0%); education, training, and library occupations (6.8%); legal occupations (4.5%)
Roads and streets: Teakwood Dr; Tan Bark Ln.
Country Knoll neighborhood detailed profile
Cripple Creek neighborhood in Kannapolis statistics: (Find on map)
Area: 0.061 square miles
Population: 80
Population density:
Median household income in 2021:
Median rent in in 2021:
Male vs Females
Median age
Average estimated value of detached houses in 2021 (95.0% of all units):
Most popular occupations of males: production occupations (26.5%); transportation occupations (16.1%); service occupations (12.1%); construction, extraction, and maintenance occupations (10.4%); management occupations (except farmers) (8.9%); material moving occupations (8.6%); sales and office occupations (6.3%)
Most popular occupations of females: education, training, and library occupations (44.5%); sales and office occupations (43.7%); service occupations (6.2%); healthcare practitioners and technical occupations (6.1%); community and social services occupations (4.9%); legal occupations (4.0%); management occupations (except farmers) (3.9%)
Roads and streets: Daybreak Ridge Rd; Morningside Ct.
Cripple Creek neighborhood detailed profile
Area: 0.061 square miles
Population: 80
Population density:
| Cripple Creek: | 1,317 people per square mile |
| Kannapolis: | 1,748 people per square mile |
Median household income in 2021:
| Cripple Creek: | $88,919 |
| Kannapolis: | $58,084 |
Median rent in in 2021:
| Cripple Creek: | $615 |
| Kannapolis: | $733 |
Male vs Females
| Males: | 39 |
| Females: | 41 |
Median age
| Males: | 28.2 years |
| Females: | 28.8 years |
Average estimated value of detached houses in 2021 (95.0% of all units):
| Cripple Creek: | $192,375 |
| North Carolina: | $316,354 |
Most popular occupations of males: production occupations (26.5%); transportation occupations (16.1%); service occupations (12.1%); construction, extraction, and maintenance occupations (10.4%); management occupations (except farmers) (8.9%); material moving occupations (8.6%); sales and office occupations (6.3%)
Most popular occupations of females: education, training, and library occupations (44.5%); sales and office occupations (43.7%); service occupations (6.2%); healthcare practitioners and technical occupations (6.1%); community and social services occupations (4.9%); legal occupations (4.0%); management occupations (except farmers) (3.9%)
Roads and streets: Daybreak Ridge Rd; Morningside Ct.
Cripple Creek neighborhood detailed profile
Dakota Woods neighborhood in Kannapolis statistics: (Find on map)
Area: 0.044 square miles
Population: 71
Population density:
Median household income in 2021:
Median rent in in 2021:
Male vs Females
Median age
Most popular occupations of males: sales and office occupations (26.5%); service occupations (18.1%); material moving occupations (9.7%); management occupations (except farmers) (9.3%); construction, extraction, and maintenance occupations (7.3%); life, physical, and social science occupations (6.2%); business and financial operations occupations (4.9%)
Most popular occupations of females: sales and office occupations (25.2%); service occupations (16.9%); management occupations (except farmers) (15.0%); healthcare practitioners and technical occupations (8.2%); business and financial operations occupations (5.5%); construction, extraction, and maintenance occupations (4.7%); production occupations (4.7%)
Roads and streets: Peacehaven Rd; Carson Ct.
Dakota Woods neighborhood detailed profile
Area: 0.044 square miles
Population: 71
Population density:
| Dakota Woods: | 1,612 people per square mile |
| Kannapolis: | 1,748 people per square mile |
Median household income in 2021:
| Dakota Woods: | $57,813 |
| Kannapolis: | $58,084 |
Median rent in in 2021:
| Dakota Woods: | $807 |
| Kannapolis: | $733 |
Male vs Females
| Males: | 36 |
| Females: | 35 |
Median age
| Males: | 39.2 years |
| Females: | 42.9 years |
Most popular occupations of males: sales and office occupations (26.5%); service occupations (18.1%); material moving occupations (9.7%); management occupations (except farmers) (9.3%); construction, extraction, and maintenance occupations (7.3%); life, physical, and social science occupations (6.2%); business and financial operations occupations (4.9%)
Most popular occupations of females: sales and office occupations (25.2%); service occupations (16.9%); management occupations (except farmers) (15.0%); healthcare practitioners and technical occupations (8.2%); business and financial operations occupations (5.5%); construction, extraction, and maintenance occupations (4.7%); production occupations (4.7%)
Roads and streets: Peacehaven Rd; Carson Ct.
Dakota Woods neighborhood detailed profile
Dancy's Mobile Home Park neighborhood in Kannapolis statistics: (Find on map)
Area: 0.015 square miles
Roads and streets: Wilkerson St; Raven Dr; Bluejay Dr; Blackhawk Dr; Richard Ave.
Dancy's Mobile Home Park neighborhood detailed profile
Area: 0.015 square miles
Roads and streets: Wilkerson St; Raven Dr; Bluejay Dr; Blackhawk Dr; Richard Ave.
Dancy's Mobile Home Park neighborhood detailed profile
Devonshire neighborhood in Kannapolis statistics: (Find on map)
Area: 0.127 square miles
Roads and streets: Elsinor Ln; Maid Marian Ln; King Arthur Ct; Devonshire Dr.
Devonshire neighborhood detailed profile
Area: 0.127 square miles
Roads and streets: Elsinor Ln; Maid Marian Ln; King Arthur Ct; Devonshire Dr.
Devonshire neighborhood detailed profile
Dove Field neighborhood in Kannapolis statistics: (Find on map)
Area: 0.241 square miles
Population: 319
Population density:
Median household income in 2021:
Median rent in in 2021:
Male vs Females
Median age
Average estimated value of detached houses in 2021 (96.3% of all units):
Most popular occupations of males: production occupations (26.5%); service occupations (12.1%); construction, extraction, and maintenance occupations (10.4%); management occupations (except farmers) (8.9%); business and financial operations occupations (4.0%); arts, design, entertainment, sports, and media occupations (4.0%)
Most popular occupations of females: education, training, and library occupations (44.5%); sales and office occupations (43.7%); healthcare practitioners and technical occupations (6.1%); arts, design, entertainment, sports, and media occupations (3.4%); production occupations (2.2%)
Roads and streets: Dove Field Ln; Woodwind Ct.
Dove Field neighborhood detailed profile
Area: 0.241 square miles
Population: 319
Population density:
| Dove Field: | 1,321 people per square mile |
| Kannapolis: | 1,748 people per square mile |
Median household income in 2021:
| Dove Field: | $88,919 |
| Kannapolis: | $58,084 |
Median rent in in 2021:
| Dove Field: | $615 |
| Kannapolis: | $733 |
Male vs Females
| Males: | 156 |
| Females: | 163 |
Median age
| Males: | 28.2 years |
| Females: | 28.8 years |
Average estimated value of detached houses in 2021 (96.3% of all units):
| Dove Field: | $192,375 |
| North Carolina: | $316,354 |
Most popular occupations of males: production occupations (26.5%); service occupations (12.1%); construction, extraction, and maintenance occupations (10.4%); management occupations (except farmers) (8.9%); business and financial operations occupations (4.0%); arts, design, entertainment, sports, and media occupations (4.0%)
Most popular occupations of females: education, training, and library occupations (44.5%); sales and office occupations (43.7%); healthcare practitioners and technical occupations (6.1%); arts, design, entertainment, sports, and media occupations (3.4%); production occupations (2.2%)
Roads and streets: Dove Field Ln; Woodwind Ct.
Dove Field neighborhood detailed profile
Eastway Village neighborhood in Kannapolis statistics: (Find on map)
Area: 0.079 square miles
Roads and streets: Villa St; Valwood St; Eastway Ave; Valwood Ter; Valwood Ct.
Eastway Village neighborhood detailed profile
Area: 0.079 square miles
Roads and streets: Villa St; Valwood St; Eastway Ave; Valwood Ter; Valwood Ct.
Eastway Village neighborhood detailed profile
Elwood Estates neighborhood in Kannapolis statistics: (Find on map)
Area: 0.064 square miles
Population: 70
Population density:
Median household income in 2021:
Median rent in in 2021:
Male vs Females
Median age
Average estimated value of detached houses in 2021 (97.2% of all units):
Most popular occupations of males: service occupations (25.6%); transportation occupations (18.9%); material moving occupations (16.6%); construction, extraction, and maintenance occupations (14.2%); life, physical, and social science occupations (6.0%); management occupations (except farmers) (3.9%); sales and office occupations (3.0%)
Most popular occupations of females: service occupations (23.9%); management occupations (except farmers) (19.2%); sales and office occupations (17.0%); education, training, and library occupations (13.0%); arts, design, entertainment, sports, and media occupations (10.9%); legal occupations (6.2%); production occupations (5.8%)
Roads and streets: Elwood St; Westwood Dr; Cooper Ave.
Elwood Estates neighborhood detailed profile
Area: 0.064 square miles
Population: 70
Population density:
| Elwood Estates: | 1,102 people per square mile |
| Kannapolis: | 1,748 people per square mile |
Median household income in 2021:
| Elwood Estates: | $45,905 |
| Kannapolis: | $58,084 |
Median rent in in 2021:
| Elwood Estates: | $819 |
| Kannapolis: | $733 |
Male vs Females
| Males: | 34 |
| Females: | 36 |
Median age
| Males: | 49.1 years |
| Females: | 40.1 years |
Average estimated value of detached houses in 2021 (97.2% of all units):
| Elwood Estates: | $162,769 |
| North Carolina: | $316,354 |
Most popular occupations of males: service occupations (25.6%); transportation occupations (18.9%); material moving occupations (16.6%); construction, extraction, and maintenance occupations (14.2%); life, physical, and social science occupations (6.0%); management occupations (except farmers) (3.9%); sales and office occupations (3.0%)
Most popular occupations of females: service occupations (23.9%); management occupations (except farmers) (19.2%); sales and office occupations (17.0%); education, training, and library occupations (13.0%); arts, design, entertainment, sports, and media occupations (10.9%); legal occupations (6.2%); production occupations (5.8%)
Roads and streets: Elwood St; Westwood Dr; Cooper Ave.
Elwood Estates neighborhood detailed profile
Evergreen Heights neighborhood in Kannapolis statistics: (Find on map)
Area: 0.008 square miles
Roads and streets: Summerpine Pl.
Evergreen Heights neighborhood detailed profile
Area: 0.008 square miles
Roads and streets: Summerpine Pl.
Evergreen Heights neighborhood detailed profile
Forest Brook neighborhood in Kannapolis statistics: (Find on map)
Area: 0.087 square miles
Roads and streets: Winding Brook Dr; Redleaf Rd; Brushwood Cir.
Forest Brook neighborhood detailed profile
Area: 0.087 square miles
Roads and streets: Winding Brook Dr; Redleaf Rd; Brushwood Cir.
Forest Brook neighborhood detailed profile
Forest Glen neighborhood in Kannapolis statistics: (Find on map)
Area: 0.020 square miles
Population: 26
Population density:
Median household income in 2021:
Median rent in in 2021:
Male vs Females
Median age
Average estimated value of detached houses in 2021 (92.3% of all units):
Most popular occupations of males: production occupations (26.5%); transportation occupations (16.2%); service occupations (12.1%); construction, extraction, and maintenance occupations (10.4%); management occupations (except farmers) (8.9%); material moving occupations (8.7%); sales and office occupations (6.3%)
Most popular occupations of females: education, training, and library occupations (44.5%); sales and office occupations (43.7%); service occupations (6.2%); healthcare practitioners and technical occupations (6.1%); community and social services occupations (5.0%); legal occupations (4.1%); management occupations (except farmers) (3.9%)
Roads and streets: Forest Glen Ln; Evermore Cir.
Forest Glen neighborhood detailed profile
Area: 0.020 square miles
Population: 26
Population density:
| Forest Glen: | 1,298 people per square mile |
| Kannapolis: | 1,748 people per square mile |
Median household income in 2021:
| Forest Glen: | $88,919 |
| Kannapolis: | $58,084 |
Median rent in in 2021:
| Forest Glen: | $615 |
| Kannapolis: | $733 |
Male vs Females
| Males: | 13 |
| Females: | 13 |
Median age
| Males: | 28.2 years |
| Females: | 28.8 years |
Average estimated value of detached houses in 2021 (92.3% of all units):
| Forest Glen: | $192,375 |
| North Carolina: | $316,354 |
Most popular occupations of males: production occupations (26.5%); transportation occupations (16.2%); service occupations (12.1%); construction, extraction, and maintenance occupations (10.4%); management occupations (except farmers) (8.9%); material moving occupations (8.7%); sales and office occupations (6.3%)
Most popular occupations of females: education, training, and library occupations (44.5%); sales and office occupations (43.7%); service occupations (6.2%); healthcare practitioners and technical occupations (6.1%); community and social services occupations (5.0%); legal occupations (4.1%); management occupations (except farmers) (3.9%)
Roads and streets: Forest Glen Ln; Evermore Cir.
Forest Glen neighborhood detailed profile
Forest Ridge neighborhood in Kannapolis statistics: (Find on map)
Area: 0.052 square miles
Roads and streets: Saguaro Ln; Acadia Ct; Curecanti Ct; Galena Ln; Mead St.
Forest Ridge neighborhood detailed profile
Area: 0.052 square miles
Roads and streets: Saguaro Ln; Acadia Ct; Curecanti Ct; Galena Ln; Mead St.
Forest Ridge neighborhood detailed profile
Fox Hunt neighborhood in Kannapolis statistics: (Find on map)
Area: 0.041 square miles
Population: 51
Population density:
Median household income in 2021:
Median rent in in 2021:
Male vs Females
Median age
Average estimated value of detached houses in 2021 (92.3% of all units):
Most popular occupations of males: service occupations (22.0%); transportation occupations (19.7%); material moving occupations (13.5%); construction, extraction, and maintenance occupations (13.2%); production occupations (5.0%); life, physical, and social science occupations (4.9%); management occupations (except farmers) (4.2%)
Most popular occupations of females: service occupations (20.8%); management occupations (except farmers) (17.1%); sales and office occupations (16.5%); education, training, and library occupations (15.7%); healthcare practitioners and technical occupations (8.9%); arts, design, entertainment, sports, and media occupations (8.6%); community and social services occupations (5.4%)
Roads and streets: Heather Glen Rd; Lantern Way; Woodglen Ct.
Fox Hunt neighborhood detailed profile
Area: 0.041 square miles
Population: 51
Population density:
| Fox Hunt: | 1,241 people per square mile |
| Kannapolis: | 1,748 people per square mile |
Median household income in 2021:
| Fox Hunt: | $72,014 |
| Kannapolis: | $58,084 |
Median rent in in 2021:
| Fox Hunt: | $747 |
| Kannapolis: | $733 |
Male vs Females
| Males: | 26 |
| Females: | 25 |
Median age
| Males: | 44.2 years |
| Females: | 43.3 years |
Average estimated value of detached houses in 2021 (92.3% of all units):
| Fox Hunt: | $171,461 |
| North Carolina: | $316,354 |
Most popular occupations of males: service occupations (22.0%); transportation occupations (19.7%); material moving occupations (13.5%); construction, extraction, and maintenance occupations (13.2%); production occupations (5.0%); life, physical, and social science occupations (4.9%); management occupations (except farmers) (4.2%)
Most popular occupations of females: service occupations (20.8%); management occupations (except farmers) (17.1%); sales and office occupations (16.5%); education, training, and library occupations (15.7%); healthcare practitioners and technical occupations (8.9%); arts, design, entertainment, sports, and media occupations (8.6%); community and social services occupations (5.4%)
Roads and streets: Heather Glen Rd; Lantern Way; Woodglen Ct.
Fox Hunt neighborhood detailed profile
Freedom Park neighborhood in Kannapolis statistics: (Find on map)
Area: 0.042 square miles
Roads and streets: Hyde St; S Little Texas Rd; Lyndon St; Eastway Ave.
Freedom Park neighborhood detailed profile
Area: 0.042 square miles
Roads and streets: Hyde St; S Little Texas Rd; Lyndon St; Eastway Ave.
Freedom Park neighborhood detailed profile
Furr's Mobile Home Park neighborhood in Kannapolis statistics: (Find on map)
Area: 0.013 square miles
Furr's Mobile Home Park neighborhood detailed profile
Area: 0.013 square miles
Furr's Mobile Home Park neighborhood detailed profile
Kellswater Bridge neighborhood in Kannapolis statistics: (Find on map)
Area: 0.274 square miles
Roads and streets: Country Down Ave; Keady Mill Loop; Breden St.
Kellswater Bridge neighborhood detailed profile
Area: 0.274 square miles
Roads and streets: Country Down Ave; Keady Mill Loop; Breden St.
Kellswater Bridge neighborhood detailed profile
Kentwood neighborhood in Kannapolis statistics: (Find on map)
Area: 0.032 square miles
Roads and streets: Aldwick St.
Kentwood neighborhood detailed profile
Area: 0.032 square miles
Roads and streets: Aldwick St.
Kentwood neighborhood detailed profile
Lansdowne neighborhood in Kannapolis statistics: (Find on map)
Area: 0.026 square miles
Roads and streets: Poindexter Dr; Randolph Rd; Chilton Pl.
Lansdowne neighborhood detailed profile
Area: 0.026 square miles
Roads and streets: Poindexter Dr; Randolph Rd; Chilton Pl.
Lansdowne neighborhood detailed profile
Lantern Green neighborhood in Kannapolis statistics: (Find on map)
Area: 0.061 square miles
Population: 79
Population density:
Median household income in 2021:
Median rent in in 2021:
Male vs Females
Median age
Average estimated value of detached houses in 2021 (92.5% of all units):
Most popular occupations of males: service occupations (20.9%); transportation occupations (19.9%); construction, extraction, and maintenance occupations (12.9%); material moving occupations (12.6%); production occupations (6.0%); management occupations (except farmers) (5.5%); life, physical, and social science occupations (4.6%)
Most popular occupations of females: service occupations (19.9%); education, training, and library occupations (16.6%); management occupations (except farmers) (16.4%); sales and office occupations (16.4%); healthcare practitioners and technical occupations (10.5%); arts, design, entertainment, sports, and media occupations (8.0%); community and social services occupations (5.6%)
Roads and streets: Lamplighter Dr; Lantern Way; Coach House Ln; Ians Turn; Sheffller Ct.
Lantern Green neighborhood detailed profile
Area: 0.061 square miles
Population: 79
Population density:
| Lantern Green: | 1,306 people per square mile |
| Kannapolis: | 1,748 people per square mile |
Median household income in 2021:
| Lantern Green: | $72,014 |
| Kannapolis: | $58,084 |
Median rent in in 2021:
| Lantern Green: | $728 |
| Kannapolis: | $733 |
Male vs Females
| Males: | 40 |
| Females: | 39 |
Median age
| Males: | 44.2 years |
| Females: | 43.3 years |
Average estimated value of detached houses in 2021 (92.5% of all units):
| Lantern Green: | $174,270 |
| North Carolina: | $316,354 |
Most popular occupations of males: service occupations (20.9%); transportation occupations (19.9%); construction, extraction, and maintenance occupations (12.9%); material moving occupations (12.6%); production occupations (6.0%); management occupations (except farmers) (5.5%); life, physical, and social science occupations (4.6%)
Most popular occupations of females: service occupations (19.9%); education, training, and library occupations (16.6%); management occupations (except farmers) (16.4%); sales and office occupations (16.4%); healthcare practitioners and technical occupations (10.5%); arts, design, entertainment, sports, and media occupations (8.0%); community and social services occupations (5.6%)
Roads and streets: Lamplighter Dr; Lantern Way; Coach House Ln; Ians Turn; Sheffller Ct.
Lantern Green neighborhood detailed profile
Leisure Mobile Home Park neighborhood in Kannapolis statistics: (Find on map)
Area: 0.011 square miles
Leisure Mobile Home Park neighborhood detailed profile
Area: 0.011 square miles
Leisure Mobile Home Park neighborhood detailed profile
Manchester Place neighborhood in Kannapolis statistics: (Find on map)
Area: 0.077 square miles
Population: 210
Population density:
Median household income in 2021:
Median rent in in 2021:
Male vs Females
Median age
Average estimated value of detached houses in 2021 (73.3% of all units):
Most popular occupations of males: transportation occupations (23.0%); management occupations (except farmers) (22.8%); production occupations (19.5%); construction, extraction, and maintenance occupations (8.7%); service occupations (6.3%); sales and office occupations (4.3%); education, training, and library occupations (3.4%)
Most popular occupations of females: healthcare practitioners and technical occupations (29.1%); education, training, and library occupations (26.1%); sales and office occupations (14.5%); service occupations (9.0%); management occupations (except farmers) (8.9%); business and financial operations occupations (8.4%); community and social services occupations (7.4%)
Roads and streets: Ashmont Dr; Oakhurst Ct; Chantilly Ct.
Manchester Place neighborhood detailed profile
Area: 0.077 square miles
Population: 210
Population density:
| Manchester Place: | 2,720 people per square mile |
| Kannapolis: | 1,748 people per square mile |
Median household income in 2021:
| Manchester Place: | $72,014 |
| Kannapolis: | $58,084 |
Median rent in in 2021:
| Manchester Place: | $568 |
| Kannapolis: | $733 |
Male vs Females
| Males: | 120 |
| Females: | 90 |
Median age
| Males: | 44.2 years |
| Females: | 43.3 years |
Average estimated value of detached houses in 2021 (73.3% of all units):
| Manchester Place: | $216,026 |
| North Carolina: | $316,354 |
Most popular occupations of males: transportation occupations (23.0%); management occupations (except farmers) (22.8%); production occupations (19.5%); construction, extraction, and maintenance occupations (8.7%); service occupations (6.3%); sales and office occupations (4.3%); education, training, and library occupations (3.4%)
Most popular occupations of females: healthcare practitioners and technical occupations (29.1%); education, training, and library occupations (26.1%); sales and office occupations (14.5%); service occupations (9.0%); management occupations (except farmers) (8.9%); business and financial operations occupations (8.4%); community and social services occupations (7.4%)
Roads and streets: Ashmont Dr; Oakhurst Ct; Chantilly Ct.
Manchester Place neighborhood detailed profile
Mcclain Heights neighborhood in Kannapolis statistics: (Find on map)
Area: 0.003 square miles
Mcclain Heights neighborhood detailed profile
Area: 0.003 square miles
Mcclain Heights neighborhood detailed profile
Meadowbrook Condos neighborhood in Kannapolis statistics: (Find on map)
Area: 0.003 square miles
Population: 2
Population density:
Median household income in 2021:
Median rent in in 2021:
Male vs Females
Median age
Average estimated value of detached houses in 2021 (100.0% of all units):
Most popular occupations of males: service occupations (25.6%); transportation occupations (18.9%); material moving occupations (16.6%); construction, extraction, and maintenance occupations (14.2%); life, physical, and social science occupations (6.0%); management occupations (except farmers) (4.1%); sales and office occupations (3.0%)
Most popular occupations of females: service occupations (23.9%); management occupations (except farmers) (19.2%); sales and office occupations (17.0%); education, training, and library occupations (13.0%); arts, design, entertainment, sports, and media occupations (10.9%); legal occupations (6.2%); production occupations (5.8%)
Meadowbrook Condos neighborhood detailed profile
Area: 0.003 square miles
Population: 2
Population density:
| Meadowbrook Condos: | 794 people per square mile |
| Kannapolis: | 1,748 people per square mile |
Median household income in 2021:
| Meadowbrook Condos: | $45,905 |
| Kannapolis: | $58,084 |
Median rent in in 2021:
| Meadowbrook Condos: | $819 |
| Kannapolis: | $733 |
Male vs Females
| Males: | 1 |
| Females: | 1 |
Median age
| Males: | 49.1 years |
| Females: | 40.1 years |
Average estimated value of detached houses in 2021 (100.0% of all units):
| Meadowbrook Condos: | $162,769 |
| North Carolina: | $316,354 |
Most popular occupations of males: service occupations (25.6%); transportation occupations (18.9%); material moving occupations (16.6%); construction, extraction, and maintenance occupations (14.2%); life, physical, and social science occupations (6.0%); management occupations (except farmers) (4.1%); sales and office occupations (3.0%)
Most popular occupations of females: service occupations (23.9%); management occupations (except farmers) (19.2%); sales and office occupations (17.0%); education, training, and library occupations (13.0%); arts, design, entertainment, sports, and media occupations (10.9%); legal occupations (6.2%); production occupations (5.8%)
Meadowbrook Condos neighborhood detailed profile
Medlin Crossing neighborhood in Kannapolis statistics: (Find on map)
Area: 0.030 square miles
Roads and streets: Ellerbee Dr; Medlin Ct; Gessner Ct.
Medlin Crossing neighborhood detailed profile
Area: 0.030 square miles
Roads and streets: Ellerbee Dr; Medlin Ct; Gessner Ct.
Medlin Crossing neighborhood detailed profile
Millbrooke neighborhood in Kannapolis statistics: (Find on map)
Area: 0.202 square miles
Millbrooke neighborhood detailed profile
Area: 0.202 square miles
Millbrooke neighborhood detailed profile
Mission Hills neighborhood in Kannapolis statistics: (Find on map)
Area: 0.077 square miles
Roads and streets: Duke Adams St; Centergrove Rd; Athe Hills Pl; Taca Elizabeth Pl.
Mission Hills neighborhood detailed profile
Area: 0.077 square miles
Roads and streets: Duke Adams St; Centergrove Rd; Athe Hills Pl; Taca Elizabeth Pl.
Mission Hills neighborhood detailed profile
Mitchell Glen neighborhood in Kannapolis statistics: (Find on map)
Area: 0.020 square miles
Roads and streets: Mitchell Glen St; Fairmont Cir; Shalow Hills Ct; Millie Yale Pl.
Mitchell Glen neighborhood detailed profile
Area: 0.020 square miles
Roads and streets: Mitchell Glen St; Fairmont Cir; Shalow Hills Ct; Millie Yale Pl.
Mitchell Glen neighborhood detailed profile
Moss Acres neighborhood in Kannapolis statistics: (Find on map)
Area: 0.005 square miles
Roads and streets: Moss Acres Ct.
Moss Acres neighborhood detailed profile
Area: 0.005 square miles
Roads and streets: Moss Acres Ct.
Moss Acres neighborhood detailed profile
Mountain Vine neighborhood in Kannapolis statistics: (Find on map)
Area: 0.106 square miles
Roads and streets: Winter Jasmine Pl; Twining Vine Ct; Mountain Vine Ave; Blue Crown Ct; New Dawn Ct; Climbing Peace Ct.
Mountain Vine neighborhood detailed profile
Area: 0.106 square miles
Roads and streets: Winter Jasmine Pl; Twining Vine Ct; Mountain Vine Ave; Blue Crown Ct; New Dawn Ct; Climbing Peace Ct.
Mountain Vine neighborhood detailed profile
Murry Hills neighborhood in Kannapolis statistics: (Find on map)
Area: 0.078 square miles
Population: 7
Population density:
Median household income in 2021:
Median rent in in 2021:
Male vs Females
Median age
Housing prices:
Average estimated value of detached houses in 2021 (66.7% of all units):
Most popular occupations of males: material moving occupations (21.3%); service occupations (18.6%); management occupations (except farmers) (12.1%); transportation occupations (12.1%); construction, extraction, and maintenance occupations (7.0%); business and financial operations occupations (5.7%); healthcare practitioners and technical occupations (5.5%)
Most popular occupations of females: business and financial operations occupations (31.3%); sales and office occupations (26.2%); material moving occupations (15.8%); management occupations (except farmers) (9.3%); service occupations (9.0%); education, training, and library occupations (6.8%); legal occupations (4.5%)
Roads and streets: Whitings Ave (State Rd 2475); Osborne St; Simmons St (State Rd 2474); Blair St.
Murry Hills neighborhood detailed profile
Area: 0.078 square miles
Population: 7
Population density:
| Murry Hills: | 90 people per square mile |
| Kannapolis: | 1,748 people per square mile |
Median household income in 2021:
| Murry Hills: | $96,484 |
| Kannapolis: | $58,084 |
Median rent in in 2021:
| Murry Hills: | $1,046 |
| Kannapolis: | $733 |
Male vs Females
| Males: | 3 |
| Females: | 3 |
Median age
| Males: | 49.3 years |
| Females: | 49.6 years |
Housing prices:
Average estimated value of detached houses in 2021 (66.7% of all units):
| Murry Hills: | $250,077 |
| North Carolina: | $316,354 |
Most popular occupations of males: material moving occupations (21.3%); service occupations (18.6%); management occupations (except farmers) (12.1%); transportation occupations (12.1%); construction, extraction, and maintenance occupations (7.0%); business and financial operations occupations (5.7%); healthcare practitioners and technical occupations (5.5%)
Most popular occupations of females: business and financial operations occupations (31.3%); sales and office occupations (26.2%); material moving occupations (15.8%); management occupations (except farmers) (9.3%); service occupations (9.0%); education, training, and library occupations (6.8%); legal occupations (4.5%)
Roads and streets: Whitings Ave (State Rd 2475); Osborne St; Simmons St (State Rd 2474); Blair St.
Murry Hills neighborhood detailed profile
Newman Manor neighborhood in Kannapolis statistics: (Find on map)
Area: 0.035 square miles
Population: 46
Population density:
Median household income in 2021:
Median rent in in 2021:
Male vs Females
Median age
Average estimated value of detached houses in 2021 (95.7% of all units):
Most popular occupations of males: production occupations (26.5%); transportation occupations (16.0%); service occupations (12.1%); construction, extraction, and maintenance occupations (10.4%); management occupations (except farmers) (8.9%); material moving occupations (8.6%); sales and office occupations (6.3%)
Most popular occupations of females: education, training, and library occupations (44.5%); sales and office occupations (43.7%); service occupations (6.2%); healthcare practitioners and technical occupations (6.1%); community and social services occupations (4.9%); legal occupations (4.0%); management occupations (except farmers) (3.8%)
Newman Manor neighborhood detailed profile
Area: 0.035 square miles
Population: 46
Population density:
| Newman Manor: | 1,301 people per square mile |
| Kannapolis: | 1,748 people per square mile |
Median household income in 2021:
| Newman Manor: | $88,919 |
| Kannapolis: | $58,084 |
Median rent in in 2021:
| Newman Manor: | $615 |
| Kannapolis: | $733 |
Male vs Females
| Males: | 22 |
| Females: | 23 |
Median age
| Males: | 28.2 years |
| Females: | 28.8 years |
Average estimated value of detached houses in 2021 (95.7% of all units):
| Newman Manor: | $192,375 |
| North Carolina: | $316,354 |
Most popular occupations of males: production occupations (26.5%); transportation occupations (16.0%); service occupations (12.1%); construction, extraction, and maintenance occupations (10.4%); management occupations (except farmers) (8.9%); material moving occupations (8.6%); sales and office occupations (6.3%)
Most popular occupations of females: education, training, and library occupations (44.5%); sales and office occupations (43.7%); service occupations (6.2%); healthcare practitioners and technical occupations (6.1%); community and social services occupations (4.9%); legal occupations (4.0%); management occupations (except farmers) (3.8%)
Newman Manor neighborhood detailed profile
Northcrest Business Park neighborhood in Kannapolis statistics: (Find on map)
Area: 0.031 square miles
Population: 2
Population density:
Median household income in 2021:
Median rent in in 2021:
Male vs Females
Median age
Housing prices:
Average estimated value of detached houses in 2021 (100.0% of all units):
Most popular occupations of males: material moving occupations (21.3%); service occupations (18.6%); management occupations (except farmers) (12.1%); transportation occupations (12.1%); construction, extraction, and maintenance occupations (7.0%); business and financial operations occupations (6.0%); healthcare practitioners and technical occupations (5.5%)
Most popular occupations of females: business and financial operations occupations (31.3%); sales and office occupations (26.3%); material moving occupations (15.8%); management occupations (except farmers) (9.3%); service occupations (9.0%); education, training, and library occupations (7.0%); legal occupations (4.5%)
Roads and streets: Royce St.
Northcrest Business Park neighborhood detailed profile
Area: 0.031 square miles
Population: 2
Population density:
| Northcrest Business Park: | 64 people per square mile |
| Kannapolis: | 1,748 people per square mile |
Median household income in 2021:
| Northcrest Business Park: | $96,484 |
| Kannapolis: | $58,084 |
Median rent in in 2021:
| Northcrest Business Park: | $1,046 |
| Kannapolis: | $733 |
Male vs Females
| Males: | 1 |
| Females: | 1 |
Median age
| Males: | 49.3 years |
| Females: | 49.6 years |
Housing prices:
Average estimated value of detached houses in 2021 (100.0% of all units):
| Northcrest Business Park: | $250,077 |
| North Carolina: | $316,354 |
Most popular occupations of males: material moving occupations (21.3%); service occupations (18.6%); management occupations (except farmers) (12.1%); transportation occupations (12.1%); construction, extraction, and maintenance occupations (7.0%); business and financial operations occupations (6.0%); healthcare practitioners and technical occupations (5.5%)
Most popular occupations of females: business and financial operations occupations (31.3%); sales and office occupations (26.3%); material moving occupations (15.8%); management occupations (except farmers) (9.3%); service occupations (9.0%); education, training, and library occupations (7.0%); legal occupations (4.5%)
Roads and streets: Royce St.
Northcrest Business Park neighborhood detailed profile
Oak Crest neighborhood in Kannapolis statistics: (Find on map)
Area: 0.016 square miles
Roads and streets: Oakcrest Dr.
Oak Crest neighborhood detailed profile
Area: 0.016 square miles
Roads and streets: Oakcrest Dr.
Oak Crest neighborhood detailed profile
Oakbrook neighborhood in Kannapolis statistics: (Find on map)
Area: 0.011 square miles
Roads and streets: Carwen Ct; Hoke St; Fir Ave.
Oakbrook neighborhood detailed profile
Area: 0.011 square miles
Roads and streets: Carwen Ct; Hoke St; Fir Ave.
Oakbrook neighborhood detailed profile
Olde Colony neighborhood in Kannapolis statistics: (Find on map)
Area: 0.032 square miles
Population: 35
Population density:
Median household income in 2021:
Median rent in in 2021:
Male vs Females
Median age
Average estimated value of detached houses in 2021 (100.0% of all units):
Most popular occupations of males: service occupations (25.6%); transportation occupations (18.9%); material moving occupations (16.6%); construction, extraction, and maintenance occupations (14.2%); life, physical, and social science occupations (6.0%); management occupations (except farmers) (3.8%); sales and office occupations (3.0%)
Most popular occupations of females: service occupations (23.9%); management occupations (except farmers) (19.2%); sales and office occupations (17.0%); education, training, and library occupations (13.0%); arts, design, entertainment, sports, and media occupations (10.9%); legal occupations (6.2%); production occupations (5.8%)
Roads and streets: Windy Rush Rd; Colony Dr.
Olde Colony neighborhood detailed profile
Area: 0.032 square miles
Population: 35
Population density:
| Olde Colony: | 1,091 people per square mile |
| Kannapolis: | 1,748 people per square mile |
Median household income in 2021:
| Olde Colony: | $45,905 |
| Kannapolis: | $58,084 |
Median rent in in 2021:
| Olde Colony: | $819 |
| Kannapolis: | $733 |
Male vs Females
| Males: | 17 |
| Females: | 18 |
Median age
| Males: | 49.1 years |
| Females: | 40.1 years |
Average estimated value of detached houses in 2021 (100.0% of all units):
| Olde Colony: | $162,769 |
| North Carolina: | $316,354 |
Most popular occupations of males: service occupations (25.6%); transportation occupations (18.9%); material moving occupations (16.6%); construction, extraction, and maintenance occupations (14.2%); life, physical, and social science occupations (6.0%); management occupations (except farmers) (3.8%); sales and office occupations (3.0%)
Most popular occupations of females: service occupations (23.9%); management occupations (except farmers) (19.2%); sales and office occupations (17.0%); education, training, and library occupations (13.0%); arts, design, entertainment, sports, and media occupations (10.9%); legal occupations (6.2%); production occupations (5.8%)
Roads and streets: Windy Rush Rd; Colony Dr.
Olde Colony neighborhood detailed profile
Palace Chase neighborhood in Kannapolis statistics: (Find on map)
Area: 0.017 square miles
Roads and streets: State Rd 1616 (Stirewalt Rd); Sabre Dr.
Palace Chase neighborhood detailed profile
Area: 0.017 square miles
Roads and streets: State Rd 1616 (Stirewalt Rd); Sabre Dr.
Palace Chase neighborhood detailed profile
Pickwick neighborhood in Kannapolis statistics: (Find on map)
Area: 0.014 square miles
Population: 23
Population density:
Median household income in 2021:
Median rent in in 2021:
Male vs Females
Median age
Most popular occupations of males: sales and office occupations (26.5%); service occupations (18.1%); material moving occupations (9.7%); management occupations (except farmers) (9.3%); construction, extraction, and maintenance occupations (7.3%); life, physical, and social science occupations (6.2%); business and financial operations occupations (4.9%)
Most popular occupations of females: sales and office occupations (25.2%); service occupations (16.9%); management occupations (except farmers) (15.0%); healthcare practitioners and technical occupations (8.2%); business and financial operations occupations (5.5%); construction, extraction, and maintenance occupations (4.7%); production occupations (4.7%)
Roads and streets: Marigold Dr.
Pickwick neighborhood detailed profile
Area: 0.014 square miles
Population: 23
Population density:
| Pickwick: | 1,597 people per square mile |
| Kannapolis: | 1,748 people per square mile |
Median household income in 2021:
| Pickwick: | $57,813 |
| Kannapolis: | $58,084 |
Median rent in in 2021:
| Pickwick: | $807 |
| Kannapolis: | $733 |
Male vs Females
| Males: | 11 |
| Females: | 11 |
Median age
| Males: | 39.2 years |
| Females: | 42.9 years |
Most popular occupations of males: sales and office occupations (26.5%); service occupations (18.1%); material moving occupations (9.7%); management occupations (except farmers) (9.3%); construction, extraction, and maintenance occupations (7.3%); life, physical, and social science occupations (6.2%); business and financial operations occupations (4.9%)
Most popular occupations of females: sales and office occupations (25.2%); service occupations (16.9%); management occupations (except farmers) (15.0%); healthcare practitioners and technical occupations (8.2%); business and financial operations occupations (5.5%); construction, extraction, and maintenance occupations (4.7%); production occupations (4.7%)
Roads and streets: Marigold Dr.
Pickwick neighborhood detailed profile
Pine Creek neighborhood in Kannapolis statistics: (Find on map)
Area: 0.121 square miles
Roads and streets: Rolling Ridge Dr; Willowwood Rd.
Pine Creek neighborhood detailed profile
Area: 0.121 square miles
Roads and streets: Rolling Ridge Dr; Willowwood Rd.
Pine Creek neighborhood detailed profile
Pleasant Avenue Trailer Park neighborhood in Kannapolis statistics: (Find on map)
Area: 0.005 square miles
Roads and streets: Chris Dr; Robert Dr.
Pleasant Avenue Trailer Park neighborhood detailed profile
Area: 0.005 square miles
Roads and streets: Chris Dr; Robert Dr.
Pleasant Avenue Trailer Park neighborhood detailed profile
Princeton neighborhood in Kannapolis statistics: (Find on map)
Area: 0.066 square miles
Roads and streets: Bahama Dr (State Rd 1841); Avalon Dr; Princeton Ave (State Rd 1632); Harvard St.
Princeton neighborhood detailed profile
Area: 0.066 square miles
Roads and streets: Bahama Dr (State Rd 1841); Avalon Dr; Princeton Ave (State Rd 1632); Harvard St.
Princeton neighborhood detailed profile
Private Acres neighborhood in Kannapolis statistics: (Find on map)
Area: 0.067 square miles
Roads and streets: Normandy Rd; Camden Ave; Melrose Dr; Kenlough Dr.
Private Acres neighborhood detailed profile
Area: 0.067 square miles
Roads and streets: Normandy Rd; Camden Ave; Melrose Dr; Kenlough Dr.
Private Acres neighborhood detailed profile
Queen's Gate neighborhood in Kannapolis statistics: (Find on map)
Area: 0.030 square miles
Queen's Gate neighborhood detailed profile
Area: 0.030 square miles
Queen's Gate neighborhood detailed profile
Quiet Corners Minor neighborhood in Kannapolis statistics: (Find on map)
Area: 0.006 square miles
Population: 6
Population density:
Median household income in 2021:
Median rent in in 2021:
Male vs Females
Median age
Average estimated value of detached houses in 2021 (100.0% of all units):
Most popular occupations of males: service occupations (25.6%); transportation occupations (18.9%); material moving occupations (16.6%); construction, extraction, and maintenance occupations (14.2%); life, physical, and social science occupations (6.0%); management occupations (except farmers) (3.8%); sales and office occupations (3.0%)
Most popular occupations of females: service occupations (23.9%); management occupations (except farmers) (19.2%); sales and office occupations (17.0%); education, training, and library occupations (13.0%); arts, design, entertainment, sports, and media occupations (10.9%); legal occupations (6.2%); production occupations (5.8%)
Quiet Corners Minor neighborhood detailed profile
Area: 0.006 square miles
Population: 6
Population density:
| Quiet Corners Minor: | 1,007 people per square mile |
| Kannapolis: | 1,748 people per square mile |
Median household income in 2021:
| Quiet Corners Minor: | $45,905 |
| Kannapolis: | $58,084 |
Median rent in in 2021:
| Quiet Corners Minor: | $819 |
| Kannapolis: | $733 |
Male vs Females
| Males: | 3 |
| Females: | 3 |
Median age
| Males: | 49.1 years |
| Females: | 40.1 years |
Average estimated value of detached houses in 2021 (100.0% of all units):
| Quiet Corners Minor: | $162,769 |
| North Carolina: | $316,354 |
Most popular occupations of males: service occupations (25.6%); transportation occupations (18.9%); material moving occupations (16.6%); construction, extraction, and maintenance occupations (14.2%); life, physical, and social science occupations (6.0%); management occupations (except farmers) (3.8%); sales and office occupations (3.0%)
Most popular occupations of females: service occupations (23.9%); management occupations (except farmers) (19.2%); sales and office occupations (17.0%); education, training, and library occupations (13.0%); arts, design, entertainment, sports, and media occupations (10.9%); legal occupations (6.2%); production occupations (5.8%)
Quiet Corners Minor neighborhood detailed profile
Ravendale Mobile Home Park neighborhood in Kannapolis statistics: (Find on map)
Area: 0.002 square miles
Roads and streets: Parksdale Dr.
Ravendale Mobile Home Park neighborhood detailed profile
Area: 0.002 square miles
Roads and streets: Parksdale Dr.
Ravendale Mobile Home Park neighborhood detailed profile
Realticorp neighborhood in Kannapolis statistics: (Find on map)
Area: 0.168 square miles
Roads and streets: Roxie St.
Realticorp neighborhood detailed profile
Area: 0.168 square miles
Roads and streets: Roxie St.
Realticorp neighborhood detailed profile
Reynolds Mobile Home Park neighborhood in Kannapolis statistics: (Find on map)
Area: 0.032 square miles
Population: 42
Population density:
Median household income in 2021:
Median rent in in 2021:
Male vs Females
Median age
Average estimated value of detached houses in 2021 (95.2% of all units):
Most popular occupations of males: production occupations (26.5%); transportation occupations (15.9%); service occupations (12.1%); construction, extraction, and maintenance occupations (10.4%); management occupations (except farmers) (8.9%); material moving occupations (8.5%); sales and office occupations (6.2%)
Most popular occupations of females: education, training, and library occupations (44.5%); sales and office occupations (43.7%); healthcare practitioners and technical occupations (6.1%); service occupations (6.1%); community and social services occupations (4.9%); legal occupations (4.0%); management occupations (except farmers) (3.8%)
Roads and streets: Bertie Ave; Caswell Ave; Davie Ave.
Other features: Irish Buffalo Crk.
Reynolds Mobile Home Park neighborhood detailed profile
Area: 0.032 square miles
Population: 42
Population density:
| Reynolds Mobile Home Park: | 1,294 people per square mile |
| Kannapolis: | 1,748 people per square mile |
Median household income in 2021:
| Reynolds Mobile Home Park: | $88,919 |
| Kannapolis: | $58,084 |
Median rent in in 2021:
| Reynolds Mobile Home Park: | $615 |
| Kannapolis: | $733 |
Male vs Females
| Males: | 20 |
| Females: | 21 |
Median age
| Males: | 28.2 years |
| Females: | 28.8 years |
Average estimated value of detached houses in 2021 (95.2% of all units):
| Reynolds Mobile Home Park: | $192,375 |
| North Carolina: | $316,354 |
Most popular occupations of males: production occupations (26.5%); transportation occupations (15.9%); service occupations (12.1%); construction, extraction, and maintenance occupations (10.4%); management occupations (except farmers) (8.9%); material moving occupations (8.5%); sales and office occupations (6.2%)
Most popular occupations of females: education, training, and library occupations (44.5%); sales and office occupations (43.7%); healthcare practitioners and technical occupations (6.1%); service occupations (6.1%); community and social services occupations (4.9%); legal occupations (4.0%); management occupations (except farmers) (3.8%)
Roads and streets: Bertie Ave; Caswell Ave; Davie Ave.
Other features: Irish Buffalo Crk.
Reynolds Mobile Home Park neighborhood detailed profile
Salem Creek neighborhood in Kannapolis statistics: (Find on map)
Area: 0.024 square miles
Population: 38
Population density:
Median household income in 2021:
Median rent in in 2021:
Male vs Females
Median age
Most popular occupations of males: sales and office occupations (26.5%); service occupations (18.1%); material moving occupations (9.7%); management occupations (except farmers) (9.3%); construction, extraction, and maintenance occupations (7.3%); life, physical, and social science occupations (6.2%); business and financial operations occupations (4.9%)
Most popular occupations of females: sales and office occupations (25.2%); service occupations (16.9%); management occupations (except farmers) (15.0%); healthcare practitioners and technical occupations (8.2%); business and financial operations occupations (5.5%); construction, extraction, and maintenance occupations (4.7%); production occupations (4.7%)
Roads and streets: Congress Ct; Wednesbury Ct; Dillery Ct.
Salem Creek neighborhood detailed profile
Area: 0.024 square miles
Population: 38
Population density:
| Salem Creek: | 1,594 people per square mile |
| Kannapolis: | 1,748 people per square mile |
Median household income in 2021:
| Salem Creek: | $57,813 |
| Kannapolis: | $58,084 |
Median rent in in 2021:
| Salem Creek: | $807 |
| Kannapolis: | $733 |
Male vs Females
| Males: | 19 |
| Females: | 19 |
Median age
| Males: | 39.2 years |
| Females: | 42.9 years |
Most popular occupations of males: sales and office occupations (26.5%); service occupations (18.1%); material moving occupations (9.7%); management occupations (except farmers) (9.3%); construction, extraction, and maintenance occupations (7.3%); life, physical, and social science occupations (6.2%); business and financial operations occupations (4.9%)
Most popular occupations of females: sales and office occupations (25.2%); service occupations (16.9%); management occupations (except farmers) (15.0%); healthcare practitioners and technical occupations (8.2%); business and financial operations occupations (5.5%); construction, extraction, and maintenance occupations (4.7%); production occupations (4.7%)
Roads and streets: Congress Ct; Wednesbury Ct; Dillery Ct.
Salem Creek neighborhood detailed profile
Scottish Square Mobile Home Park neighborhood in Kannapolis statistics: (Find on map)
Area: 0.005 square miles
Roads and streets: Scottish Square Dr.
Scottish Square Mobile Home Park neighborhood detailed profile
Area: 0.005 square miles
Roads and streets: Scottish Square Dr.
Scottish Square Mobile Home Park neighborhood detailed profile
Sears Street neighborhood in Kannapolis statistics: (Find on map)
Area: 0.017 square miles
Roads and streets: Sears Cir.
Sears Street neighborhood detailed profile
Area: 0.017 square miles
Roads and streets: Sears Cir.
Sears Street neighborhood detailed profile
Serenity Estates neighborhood in Kannapolis statistics: (Find on map)
Area: 0.004 square miles
Serenity Estates neighborhood detailed profile
Area: 0.004 square miles
Serenity Estates neighborhood detailed profile
Settlers Ridge neighborhood in Kannapolis statistics: (Find on map)
Area: 0.068 square miles
Population: 76
Population density:
Median household income in 2021:
Median rent in in 2021:
Male vs Females
Median age
Average estimated value of detached houses in 2021 (97.4% of all units):
Most popular occupations of males: service occupations (25.6%); transportation occupations (18.9%); material moving occupations (16.6%); construction, extraction, and maintenance occupations (14.2%); life, physical, and social science occupations (6.0%); management occupations (except farmers) (3.8%); sales and office occupations (3.0%)
Most popular occupations of females: service occupations (23.9%); management occupations (except farmers) (19.2%); sales and office occupations (17.0%); education, training, and library occupations (13.0%); arts, design, entertainment, sports, and media occupations (10.9%); legal occupations (6.2%); production occupations (5.8%)
Roads and streets: Matthew Allen Cir; Settlers Ridge Dr; Tygress Dr; Colony Dr.
Settlers Ridge neighborhood detailed profile
Area: 0.068 square miles
Population: 76
Population density:
| Settlers Ridge: | 1,113 people per square mile |
| Kannapolis: | 1,748 people per square mile |
Median household income in 2021:
| Settlers Ridge: | $45,905 |
| Kannapolis: | $58,084 |
Median rent in in 2021:
| Settlers Ridge: | $819 |
| Kannapolis: | $733 |
Male vs Females
| Males: | 36 |
| Females: | 39 |
Median age
| Males: | 49.1 years |
| Females: | 40.1 years |
Average estimated value of detached houses in 2021 (97.4% of all units):
| Settlers Ridge: | $162,769 |
| North Carolina: | $316,354 |
Most popular occupations of males: service occupations (25.6%); transportation occupations (18.9%); material moving occupations (16.6%); construction, extraction, and maintenance occupations (14.2%); life, physical, and social science occupations (6.0%); management occupations (except farmers) (3.8%); sales and office occupations (3.0%)
Most popular occupations of females: service occupations (23.9%); management occupations (except farmers) (19.2%); sales and office occupations (17.0%); education, training, and library occupations (13.0%); arts, design, entertainment, sports, and media occupations (10.9%); legal occupations (6.2%); production occupations (5.8%)
Roads and streets: Matthew Allen Cir; Settlers Ridge Dr; Tygress Dr; Colony Dr.
Settlers Ridge neighborhood detailed profile
Shady Oaks Mobile Home Park neighborhood in Kannapolis statistics: (Find on map)
Area: 0.002 square miles
Population: 5
Population density:
Median household income in 2021:
Median rent in in 2021:
Male vs Females
Median age
Average estimated value of detached houses in 2021 (50.0% of all units):
Most popular occupations of males: sales and office occupations (36.9%); material moving occupations (11.7%); construction, extraction, and maintenance occupations (9.8%); management occupations (except farmers) (7.3%); production occupations (6.9%); architecture and engineering occupations (5.0%); education, training, and library occupations (4.8%)
Most popular occupations of females: sales and office occupations (62.2%); management occupations (except farmers) (17.2%); service occupations (15.9%); business and financial operations occupations (6.2%); production occupations (4.7%); healthcare practitioners and technical occupations (4.0%); architecture and engineering occupations (3.6%)
Roads and streets: Cook St.
Shady Oaks Mobile Home Park neighborhood detailed profile
Area: 0.002 square miles
Population: 5
Population density:
| Shady Oaks Mobile Home Park: | 2,737 people per square mile |
| Kannapolis: | 1,748 people per square mile |
Median household income in 2021:
| Shady Oaks Mobile Home Park: | $45,804 |
| Kannapolis: | $58,084 |
Median rent in in 2021:
| Shady Oaks Mobile Home Park: | $623 |
| Kannapolis: | $733 |
Male vs Females
| Males: | 1 |
| Females: | 3 |
Median age
| Males: | 37.8 years |
| Females: | 25.6 years |
Average estimated value of detached houses in 2021 (50.0% of all units):
| Shady Oaks Mobile Home Park: | $123,042 |
| North Carolina: | $316,354 |
Most popular occupations of males: sales and office occupations (36.9%); material moving occupations (11.7%); construction, extraction, and maintenance occupations (9.8%); management occupations (except farmers) (7.3%); production occupations (6.9%); architecture and engineering occupations (5.0%); education, training, and library occupations (4.8%)
Most popular occupations of females: sales and office occupations (62.2%); management occupations (except farmers) (17.2%); service occupations (15.9%); business and financial operations occupations (6.2%); production occupations (4.7%); healthcare practitioners and technical occupations (4.0%); architecture and engineering occupations (3.6%)
Roads and streets: Cook St.
Shady Oaks Mobile Home Park neighborhood detailed profile
Shadybrook Mobile Home Park neighborhood in Kannapolis statistics: (Find on map)
Area: 0.005 square miles
Roads and streets: Shadybrook Dr; Marlin Dr.
Shadybrook Mobile Home Park neighborhood detailed profile
Area: 0.005 square miles
Roads and streets: Shadybrook Dr; Marlin Dr.
Shadybrook Mobile Home Park neighborhood detailed profile
Sherwood Forest neighborhood in Kannapolis statistics: (Find on map)
Area: 0.116 square miles
Population: 153
Population density:
Median household income in 2021:
Median rent in in 2021:
Male vs Females
Median age
Average estimated value of detached houses in 2021 (96.1% of all units):
Most popular occupations of males: production occupations (26.5%); transportation occupations (16.1%); service occupations (12.1%); construction, extraction, and maintenance occupations (10.4%); management occupations (except farmers) (8.9%); material moving occupations (8.6%); sales and office occupations (6.3%)
Most popular occupations of females: education, training, and library occupations (44.5%); sales and office occupations (43.7%); service occupations (6.2%); healthcare practitioners and technical occupations (6.1%); community and social services occupations (5.0%); legal occupations (4.1%); management occupations (except farmers) (3.9%)
Roads and streets: Longbow Dr; Robinhood Ln; Sherwood Dr; Huntingdon Rd; Nottingham Rd; Friar Tuck Trl; Little John Trl.
Sherwood Forest neighborhood detailed profile
Area: 0.116 square miles
Population: 153
Population density:
| Sherwood Forest: | 1,318 people per square mile |
| Kannapolis: | 1,748 people per square mile |
Median household income in 2021:
| Sherwood Forest: | $88,919 |
| Kannapolis: | $58,084 |
Median rent in in 2021:
| Sherwood Forest: | $615 |
| Kannapolis: | $733 |
Male vs Females
| Males: | 75 |
| Females: | 78 |
Median age
| Males: | 28.2 years |
| Females: | 28.8 years |
Average estimated value of detached houses in 2021 (96.1% of all units):
| Sherwood Forest: | $192,375 |
| North Carolina: | $316,354 |
Most popular occupations of males: production occupations (26.5%); transportation occupations (16.1%); service occupations (12.1%); construction, extraction, and maintenance occupations (10.4%); management occupations (except farmers) (8.9%); material moving occupations (8.6%); sales and office occupations (6.3%)
Most popular occupations of females: education, training, and library occupations (44.5%); sales and office occupations (43.7%); service occupations (6.2%); healthcare practitioners and technical occupations (6.1%); community and social services occupations (5.0%); legal occupations (4.1%); management occupations (except farmers) (3.9%)
Roads and streets: Longbow Dr; Robinhood Ln; Sherwood Dr; Huntingdon Rd; Nottingham Rd; Friar Tuck Trl; Little John Trl.
Sherwood Forest neighborhood detailed profile
Sidneys Grove neighborhood in Kannapolis statistics: (Find on map)
Area: 0.018 square miles
Population: 23
Population density:
Median household income in 2021:
Median rent in in 2021:
Male vs Females
Median age
Average estimated value of detached houses in 2021 (100.0% of all units):
Most popular occupations of males: production occupations (26.5%); transportation occupations (15.9%); service occupations (12.1%); construction, extraction, and maintenance occupations (10.4%); management occupations (except farmers) (8.9%); material moving occupations (8.5%); sales and office occupations (6.2%)
Most popular occupations of females: education, training, and library occupations (44.5%); sales and office occupations (43.7%); healthcare practitioners and technical occupations (6.1%); service occupations (6.1%); community and social services occupations (4.9%); legal occupations (4.0%); management occupations (except farmers) (3.8%)
Sidneys Grove neighborhood detailed profile
Area: 0.018 square miles
Population: 23
Population density:
| Sidneys Grove: | 1,312 people per square mile |
| Kannapolis: | 1,748 people per square mile |
Median household income in 2021:
| Sidneys Grove: | $88,919 |
| Kannapolis: | $58,084 |
Median rent in in 2021:
| Sidneys Grove: | $615 |
| Kannapolis: | $733 |
Male vs Females
| Males: | 11 |
| Females: | 11 |
Median age
| Males: | 28.2 years |
| Females: | 28.8 years |
Average estimated value of detached houses in 2021 (100.0% of all units):
| Sidneys Grove: | $192,375 |
| North Carolina: | $316,354 |
Most popular occupations of males: production occupations (26.5%); transportation occupations (15.9%); service occupations (12.1%); construction, extraction, and maintenance occupations (10.4%); management occupations (except farmers) (8.9%); material moving occupations (8.5%); sales and office occupations (6.2%)
Most popular occupations of females: education, training, and library occupations (44.5%); sales and office occupations (43.7%); healthcare practitioners and technical occupations (6.1%); service occupations (6.1%); community and social services occupations (4.9%); legal occupations (4.0%); management occupations (except farmers) (3.8%)
Sidneys Grove neighborhood detailed profile
Sommerfield neighborhood in Kannapolis statistics: (Find on map)
Area: 0.133 square miles
Population: 12
Population density:
Median household income in 2021:
Median rent in in 2021:
Male vs Females
Median age
Housing prices:
Average estimated value of detached houses in 2021 (80.0% of all units):
Most popular occupations of males: material moving occupations (21.3%); service occupations (18.6%); management occupations (except farmers) (12.1%); transportation occupations (12.1%); construction, extraction, and maintenance occupations (7.0%); business and financial operations occupations (5.9%); healthcare practitioners and technical occupations (5.5%)
Most popular occupations of females: business and financial operations occupations (31.3%); sales and office occupations (26.3%); material moving occupations (15.8%); management occupations (except farmers) (9.2%); service occupations (9.0%); education, training, and library occupations (7.0%); legal occupations (4.5%)
Roads and streets: Heritage Oaks Dr.
Sommerfield neighborhood detailed profile
Area: 0.133 square miles
Population: 12
Population density:
| Sommerfield: | 90 people per square mile |
| Kannapolis: | 1,748 people per square mile |
Median household income in 2021:
| Sommerfield: | $96,484 |
| Kannapolis: | $58,084 |
Median rent in in 2021:
| Sommerfield: | $1,046 |
| Kannapolis: | $733 |
Male vs Females
| Males: | 6 |
| Females: | 6 |
Median age
| Males: | 49.3 years |
| Females: | 49.6 years |
Housing prices:
Average estimated value of detached houses in 2021 (80.0% of all units):
| Sommerfield: | $250,077 |
| North Carolina: | $316,354 |
Most popular occupations of males: material moving occupations (21.3%); service occupations (18.6%); management occupations (except farmers) (12.1%); transportation occupations (12.1%); construction, extraction, and maintenance occupations (7.0%); business and financial operations occupations (5.9%); healthcare practitioners and technical occupations (5.5%)
Most popular occupations of females: business and financial operations occupations (31.3%); sales and office occupations (26.3%); material moving occupations (15.8%); management occupations (except farmers) (9.2%); service occupations (9.0%); education, training, and library occupations (7.0%); legal occupations (4.5%)
Roads and streets: Heritage Oaks Dr.
Sommerfield neighborhood detailed profile
South Ridge Estates neighborhood in Kannapolis statistics: (Find on map)
Area: 0.015 square miles
Population: 24
Population density:
Median household income in 2021:
Median rent in in 2021:
Male vs Females
Median age
Most popular occupations of males: sales and office occupations (26.5%); service occupations (18.1%); material moving occupations (9.7%); management occupations (except farmers) (9.3%); construction, extraction, and maintenance occupations (7.3%); life, physical, and social science occupations (6.2%); business and financial operations occupations (4.9%)
Most popular occupations of females: sales and office occupations (25.2%); service occupations (16.9%); management occupations (except farmers) (15.0%); healthcare practitioners and technical occupations (8.2%); business and financial operations occupations (5.5%); construction, extraction, and maintenance occupations (4.7%); production occupations (4.7%)
Roads and streets: Southhaven Ct; Butler Ct; Brodie Ct.
South Ridge Estates neighborhood detailed profile
Area: 0.015 square miles
Population: 24
Population density:
| South Ridge Estates: | 1,609 people per square mile |
| Kannapolis: | 1,748 people per square mile |
Median household income in 2021:
| South Ridge Estates: | $57,813 |
| Kannapolis: | $58,084 |
Median rent in in 2021:
| South Ridge Estates: | $807 |
| Kannapolis: | $733 |
Male vs Females
| Males: | 12 |
| Females: | 11 |
Median age
| Males: | 39.2 years |
| Females: | 42.9 years |
Most popular occupations of males: sales and office occupations (26.5%); service occupations (18.1%); material moving occupations (9.7%); management occupations (except farmers) (9.3%); construction, extraction, and maintenance occupations (7.3%); life, physical, and social science occupations (6.2%); business and financial operations occupations (4.9%)
Most popular occupations of females: sales and office occupations (25.2%); service occupations (16.9%); management occupations (except farmers) (15.0%); healthcare practitioners and technical occupations (8.2%); business and financial operations occupations (5.5%); construction, extraction, and maintenance occupations (4.7%); production occupations (4.7%)
Roads and streets: Southhaven Ct; Butler Ct; Brodie Ct.
South Ridge Estates neighborhood detailed profile
Southwood Park neighborhood in Kannapolis statistics: (Find on map)
Area: 0.099 square miles
Population: 275
Population density:
Median household income in 2021:
Median rent in in 2021:
Male vs Females
Median age
Average estimated value of detached houses in 2021 (72.7% of all units):
Most popular occupations of males: management occupations (except farmers) (23.0%); transportation occupations (23.0%); production occupations (19.7%); construction, extraction, and maintenance occupations (8.7%); material moving occupations (6.2%); service occupations (6.1%); sales and office occupations (4.3%)
Most popular occupations of females: healthcare practitioners and technical occupations (29.3%); education, training, and library occupations (26.2%); sales and office occupations (14.5%); management occupations (except farmers) (8.8%); service occupations (8.8%); business and financial operations occupations (8.5%); community and social services occupations (7.4%)
Roads and streets: Springway Dr; US Hwy 29 Alt (S Main St).
Southwood Park neighborhood detailed profile
Area: 0.099 square miles
Population: 275
Population density:
| Southwood Park: | 2,765 people per square mile |
| Kannapolis: | 1,748 people per square mile |
Median household income in 2021:
| Southwood Park: | $87,593 |
| Kannapolis: | $58,084 |
Median rent in in 2021:
| Southwood Park: | $567 |
| Kannapolis: | $733 |
Male vs Females
| Males: | 157 |
| Females: | 117 |
Median age
| Males: | 41.3 years |
| Females: | 45.2 years |
Average estimated value of detached houses in 2021 (72.7% of all units):
| Southwood Park: | $216,687 |
| North Carolina: | $316,354 |
Most popular occupations of males: management occupations (except farmers) (23.0%); transportation occupations (23.0%); production occupations (19.7%); construction, extraction, and maintenance occupations (8.7%); material moving occupations (6.2%); service occupations (6.1%); sales and office occupations (4.3%)
Most popular occupations of females: healthcare practitioners and technical occupations (29.3%); education, training, and library occupations (26.2%); sales and office occupations (14.5%); management occupations (except farmers) (8.8%); service occupations (8.8%); business and financial operations occupations (8.5%); community and social services occupations (7.4%)
Roads and streets: Springway Dr; US Hwy 29 Alt (S Main St).
Southwood Park neighborhood detailed profile
Spud Valley neighborhood in Kannapolis statistics: (Find on map)
Area: 0.128 square miles
Population: 6
Population density:
Median household income in 2021:
Median rent in in 2021:
Male vs Females
Median age
Housing prices:
Average estimated value of detached houses in 2021 (66.7% of all units):
Most popular occupations of males: material moving occupations (27.8%); service occupations (26.5%); management occupations (except farmers) (25.7%); transportation occupations (24.6%); sales and office occupations (17.9%); construction, extraction, and maintenance occupations (17.1%); production occupations (13.8%)
Most popular occupations of females: sales and office occupations (58.8%); service occupations (39.2%); management occupations (except farmers) (29.6%); healthcare practitioners and technical occupations (28.8%); computer and mathematical occupations (22.9%); business and financial operations occupations (22.6%); material moving occupations (10.6%)
Roads and streets: New Potato Dr.
Spud Valley neighborhood detailed profile
Area: 0.128 square miles
Population: 6
Population density:
| Spud Valley: | 47 people per square mile |
| Kannapolis: | 1,748 people per square mile |
Median household income in 2021:
| Spud Valley: | $42,195 |
| Kannapolis: | $58,084 |
Median rent in in 2021:
| Spud Valley: | $911 |
| Kannapolis: | $733 |
Male vs Females
| Males: | 3 |
| Females: | 2 |
Median age
| Males: | 59.6 years |
| Females: | 58.1 years |
Housing prices:
Average estimated value of detached houses in 2021 (66.7% of all units):
| Spud Valley: | $243,396 |
| North Carolina: | $316,354 |
Most popular occupations of males: material moving occupations (27.8%); service occupations (26.5%); management occupations (except farmers) (25.7%); transportation occupations (24.6%); sales and office occupations (17.9%); construction, extraction, and maintenance occupations (17.1%); production occupations (13.8%)
Most popular occupations of females: sales and office occupations (58.8%); service occupations (39.2%); management occupations (except farmers) (29.6%); healthcare practitioners and technical occupations (28.8%); computer and mathematical occupations (22.9%); business and financial operations occupations (22.6%); material moving occupations (10.6%)
Roads and streets: New Potato Dr.
Spud Valley neighborhood detailed profile
Stonewyck neighborhood in Kannapolis statistics: (Find on map)
Area: 0.069 square miles
Population: 91
Population density:
Median household income in 2021:
Median rent in in 2021:
Male vs Females
Median age
Average estimated value of detached houses in 2021 (97.8% of all units):
Most popular occupations of males: production occupations (26.5%); transportation occupations (16.0%); service occupations (12.1%); construction, extraction, and maintenance occupations (10.4%); management occupations (except farmers) (8.9%); material moving occupations (8.5%); sales and office occupations (6.3%)
Most popular occupations of females: education, training, and library occupations (44.5%); sales and office occupations (43.7%); healthcare practitioners and technical occupations (6.1%); service occupations (6.1%); community and social services occupations (4.9%); legal occupations (4.0%); management occupations (except farmers) (3.8%)
Roads and streets: Stonewyck Ave; Stratton Ct; Middlebury Ct; Norwich Ct.
Other features: Irish Buffalo Crk.
Stonewyck neighborhood detailed profile
Area: 0.069 square miles
Population: 91
Population density:
| Stonewyck: | 1,314 people per square mile |
| Kannapolis: | 1,748 people per square mile |
Median household income in 2021:
| Stonewyck: | $88,919 |
| Kannapolis: | $58,084 |
Median rent in in 2021:
| Stonewyck: | $615 |
| Kannapolis: | $733 |
Male vs Females
| Males: | 44 |
| Females: | 46 |
Median age
| Males: | 28.2 years |
| Females: | 28.8 years |
Average estimated value of detached houses in 2021 (97.8% of all units):
| Stonewyck: | $192,375 |
| North Carolina: | $316,354 |
Most popular occupations of males: production occupations (26.5%); transportation occupations (16.0%); service occupations (12.1%); construction, extraction, and maintenance occupations (10.4%); management occupations (except farmers) (8.9%); material moving occupations (8.5%); sales and office occupations (6.3%)
Most popular occupations of females: education, training, and library occupations (44.5%); sales and office occupations (43.7%); healthcare practitioners and technical occupations (6.1%); service occupations (6.1%); community and social services occupations (4.9%); legal occupations (4.0%); management occupations (except farmers) (3.8%)
Roads and streets: Stonewyck Ave; Stratton Ct; Middlebury Ct; Norwich Ct.
Other features: Irish Buffalo Crk.
Stonewyck neighborhood detailed profile
The Colony neighborhood in Kannapolis statistics: (Find on map)
Area: 0.037 square miles
Roads and streets: Roanoke Dr; Richmond Dr.
The Colony neighborhood detailed profile
Area: 0.037 square miles
Roads and streets: Roanoke Dr; Richmond Dr.
The Colony neighborhood detailed profile
The States neighborhood in Kannapolis statistics: (Find on map)
Area: 0.006 square miles
Population: 9
Population density:
Median household income in 2021:
Median rent in in 2021:
Male vs Females
Median age
Most popular occupations of males: sales and office occupations (26.5%); service occupations (18.1%); material moving occupations (9.7%); management occupations (except farmers) (9.3%); construction, extraction, and maintenance occupations (7.3%); life, physical, and social science occupations (6.2%); business and financial operations occupations (4.9%)
Most popular occupations of females: sales and office occupations (25.2%); service occupations (16.9%); management occupations (except farmers) (15.0%); healthcare practitioners and technical occupations (8.2%); business and financial operations occupations (5.5%); construction, extraction, and maintenance occupations (4.7%); production occupations (4.7%)
Roads and streets: Coopers Ridge Dr.
The States neighborhood detailed profile
Area: 0.006 square miles
Population: 9
Population density:
| The States: | 1,577 people per square mile |
| Kannapolis: | 1,748 people per square mile |
Median household income in 2021:
| The States: | $57,813 |
| Kannapolis: | $58,084 |
Median rent in in 2021:
| The States: | $807 |
| Kannapolis: | $733 |
Male vs Females
| Males: | 4 |
| Females: | 4 |
Median age
| Males: | 39.2 years |
| Females: | 42.9 years |
Most popular occupations of males: sales and office occupations (26.5%); service occupations (18.1%); material moving occupations (9.7%); management occupations (except farmers) (9.3%); construction, extraction, and maintenance occupations (7.3%); life, physical, and social science occupations (6.2%); business and financial operations occupations (4.9%)
Most popular occupations of females: sales and office occupations (25.2%); service occupations (16.9%); management occupations (except farmers) (15.0%); healthcare practitioners and technical occupations (8.2%); business and financial operations occupations (5.5%); construction, extraction, and maintenance occupations (4.7%); production occupations (4.7%)
Roads and streets: Coopers Ridge Dr.
The States neighborhood detailed profile
Timberridge neighborhood in Kannapolis statistics: (Find on map)
Area: 0.022 square miles
Timberridge neighborhood detailed profile
Area: 0.022 square miles
Timberridge neighborhood detailed profile
Tranquility neighborhood in Kannapolis statistics: (Find on map)
Area: 0.188 square miles
Roads and streets: Century Dr; Overcrest Dr; Fields Manor Dr; Trailwood Ct; Baltimore Ln; Gathering Pl.
Tranquility neighborhood detailed profile
Area: 0.188 square miles
Roads and streets: Century Dr; Overcrest Dr; Fields Manor Dr; Trailwood Ct; Baltimore Ln; Gathering Pl.
Tranquility neighborhood detailed profile
Trinity Woods neighborhood in Kannapolis statistics: (Find on map)
Area: 0.094 square miles
Roads and streets: Copper Creek Trl; Chisholm Trl.
Trinity Woods neighborhood detailed profile
Area: 0.094 square miles
Roads and streets: Copper Creek Trl; Chisholm Trl.
Trinity Woods neighborhood detailed profile
Universal Mobile Home Park neighborhood in Kannapolis statistics: (Find on map)
Area: 0.002 square miles
Population: 3
Population density:
Median household income in 2021:
Median rent in in 2021:
Male vs Females
Median age
Most popular occupations of males: sales and office occupations (26.5%); service occupations (18.1%); material moving occupations (9.7%); management occupations (except farmers) (9.3%); construction, extraction, and maintenance occupations (7.3%); life, physical, and social science occupations (6.2%); business and financial operations occupations (4.9%)
Most popular occupations of females: sales and office occupations (25.2%); service occupations (16.9%); management occupations (except farmers) (15.0%); healthcare practitioners and technical occupations (8.2%); business and financial operations occupations (5.5%); construction, extraction, and maintenance occupations (4.7%); production occupations (4.7%)
Universal Mobile Home Park neighborhood detailed profile
Area: 0.002 square miles
Population: 3
Population density:
| Universal Mobile Home Park: | 1,320 people per square mile |
| Kannapolis: | 1,748 people per square mile |
Median household income in 2021:
| Universal Mobile Home Park: | $57,813 |
| Kannapolis: | $58,084 |
Median rent in in 2021:
| Universal Mobile Home Park: | $807 |
| Kannapolis: | $733 |
Male vs Females
| Males: | 1 |
| Females: | 1 |
Median age
| Males: | 39.2 years |
| Females: | 42.9 years |
Most popular occupations of males: sales and office occupations (26.5%); service occupations (18.1%); material moving occupations (9.7%); management occupations (except farmers) (9.3%); construction, extraction, and maintenance occupations (7.3%); life, physical, and social science occupations (6.2%); business and financial operations occupations (4.9%)
Most popular occupations of females: sales and office occupations (25.2%); service occupations (16.9%); management occupations (except farmers) (15.0%); healthcare practitioners and technical occupations (8.2%); business and financial operations occupations (5.5%); construction, extraction, and maintenance occupations (4.7%); production occupations (4.7%)
Universal Mobile Home Park neighborhood detailed profile
Villa Mobile Home Park neighborhood in Kannapolis statistics: (Find on map)
Area: 0.011 square miles
Roads and streets: Verona St; Genoa St; Messina Ct.
Villa Mobile Home Park neighborhood detailed profile
Area: 0.011 square miles
Roads and streets: Verona St; Genoa St; Messina Ct.
Villa Mobile Home Park neighborhood detailed profile
Villamont Height neighborhood in Kannapolis statistics: (Find on map)
Villamont Height neighborhood detailed profile
Villamont Height neighborhood detailed profile
Wagstaff's Town Country Mobile Home Park neighborhood in Kannapolis statistics: (Find on map)
Area: 0.046 square miles
Roads and streets: Nob Hill Dr; Waldorf Dr.
Other features: Irish Buffalo Crk.
Wagstaff's Town Country Mobile Home Park neighborhood detailed profile
Area: 0.046 square miles
Roads and streets: Nob Hill Dr; Waldorf Dr.
Other features: Irish Buffalo Crk.
Wagstaff's Town Country Mobile Home Park neighborhood detailed profile
Walker Park neighborhood in Kannapolis statistics: (Find on map)
Area: 0.018 square miles
Walker Park neighborhood detailed profile
Area: 0.018 square miles
Walker Park neighborhood detailed profile
Waterside Landing neighborhood in Kannapolis statistics: (Find on map)
Area: 0.113 square miles
Roads and streets: Summit Ridge Ln; Emily Ivy Ct; Summit Park Ct; Jonathon Ct; Prism Pl; Austin Run Ct.
Waterside Landing neighborhood detailed profile
Area: 0.113 square miles
Roads and streets: Summit Ridge Ln; Emily Ivy Ct; Summit Park Ct; Jonathon Ct; Prism Pl; Austin Run Ct.
Waterside Landing neighborhood detailed profile
West Oaks neighborhood in Kannapolis statistics: (Find on map)
Area: 0.049 square miles
Roads and streets: N Oakmont St.
West Oaks neighborhood detailed profile
Area: 0.049 square miles
Roads and streets: N Oakmont St.
West Oaks neighborhood detailed profile
Westgate Park neighborhood in Kannapolis statistics: (Find on map)
Area: 0.070 square miles
Roads and streets: Canterbury Rd.
Westgate Park neighborhood detailed profile
Area: 0.070 square miles
Roads and streets: Canterbury Rd.
Westgate Park neighborhood detailed profile
Whispering Winds neighborhood in Kannapolis statistics: (Find on map)
Area: 0.070 square miles
Whispering Winds neighborhood detailed profile
Area: 0.070 square miles
Whispering Winds neighborhood detailed profile
Wildwood Estates neighborhood in Kannapolis statistics: (Find on map)
Area: 0.027 square miles
Population: 30
Population density:
Median household income in 2021:
Median rent in in 2021:
Male vs Females
Median age
Average estimated value of detached houses in 2021 (100.0% of all units):
Most popular occupations of males: service occupations (25.6%); transportation occupations (18.9%); material moving occupations (16.6%); construction, extraction, and maintenance occupations (14.2%); life, physical, and social science occupations (6.0%); management occupations (except farmers) (3.8%); sales and office occupations (3.0%)
Most popular occupations of females: service occupations (23.9%); management occupations (except farmers) (19.2%); sales and office occupations (17.0%); education, training, and library occupations (13.0%); arts, design, entertainment, sports, and media occupations (10.9%); legal occupations (6.2%); production occupations (5.8%)
Roads and streets: Brookcrest Dr.
Wildwood Estates neighborhood detailed profile
Area: 0.027 square miles
Population: 30
Population density:
| Wildwood Estates: | 1,109 people per square mile |
| Kannapolis: | 1,748 people per square mile |
Median household income in 2021:
| Wildwood Estates: | $45,905 |
| Kannapolis: | $58,084 |
Median rent in in 2021:
| Wildwood Estates: | $819 |
| Kannapolis: | $733 |
Male vs Females
| Males: | 14 |
| Females: | 15 |
Median age
| Males: | 49.1 years |
| Females: | 40.1 years |
Average estimated value of detached houses in 2021 (100.0% of all units):
| Wildwood Estates: | $162,769 |
| North Carolina: | $316,354 |
Most popular occupations of males: service occupations (25.6%); transportation occupations (18.9%); material moving occupations (16.6%); construction, extraction, and maintenance occupations (14.2%); life, physical, and social science occupations (6.0%); management occupations (except farmers) (3.8%); sales and office occupations (3.0%)
Most popular occupations of females: service occupations (23.9%); management occupations (except farmers) (19.2%); sales and office occupations (17.0%); education, training, and library occupations (13.0%); arts, design, entertainment, sports, and media occupations (10.9%); legal occupations (6.2%); production occupations (5.8%)
Roads and streets: Brookcrest Dr.
Wildwood Estates neighborhood detailed profile
Windsor neighborhood in Kannapolis statistics: (Find on map)
Area: 0.038 square miles
Population: 50
Population density:
Median household income in 2021:
Median rent in in 2021:
Male vs Females
Median age
Average estimated value of detached houses in 2021 (96.0% of all units):
Most popular occupations of males: production occupations (26.5%); transportation occupations (16.2%); service occupations (12.1%); construction, extraction, and maintenance occupations (10.4%); management occupations (except farmers) (8.9%); material moving occupations (8.7%); sales and office occupations (6.3%)
Most popular occupations of females: education, training, and library occupations (44.5%); sales and office occupations (43.7%); service occupations (6.2%); healthcare practitioners and technical occupations (6.1%); community and social services occupations (5.0%); legal occupations (4.1%); management occupations (except farmers) (3.9%)
Roads and streets: Windsor Dr; Windsor Dr S; Brighton Dr; Brighton Cir.
Windsor neighborhood detailed profile
Area: 0.038 square miles
Population: 50
Population density:
| Windsor: | 1,299 people per square mile |
| Kannapolis: | 1,748 people per square mile |
Median household income in 2021:
| Windsor: | $88,919 |
| Kannapolis: | $58,084 |
Median rent in in 2021:
| Windsor: | $615 |
| Kannapolis: | $733 |
Male vs Females
| Males: | 24 |
| Females: | 26 |
Median age
| Males: | 28.2 years |
| Females: | 28.8 years |
Average estimated value of detached houses in 2021 (96.0% of all units):
| Windsor: | $192,375 |
| North Carolina: | $316,354 |
Most popular occupations of males: production occupations (26.5%); transportation occupations (16.2%); service occupations (12.1%); construction, extraction, and maintenance occupations (10.4%); management occupations (except farmers) (8.9%); material moving occupations (8.7%); sales and office occupations (6.3%)
Most popular occupations of females: education, training, and library occupations (44.5%); sales and office occupations (43.7%); service occupations (6.2%); healthcare practitioners and technical occupations (6.1%); community and social services occupations (5.0%); legal occupations (4.1%); management occupations (except farmers) (3.9%)
Roads and streets: Windsor Dr; Windsor Dr S; Brighton Dr; Brighton Cir.
Windsor neighborhood detailed profile
Woodmore neighborhood in Kannapolis statistics: (Find on map)
Area: 0.021 square miles
Population: 27
Population density:
Median household income in 2021:
Median rent in in 2021:
Male vs Females
Median age
Average estimated value of detached houses in 2021 (100.0% of all units):
Most popular occupations of males: production occupations (26.5%); transportation occupations (16.2%); service occupations (12.1%); construction, extraction, and maintenance occupations (10.4%); management occupations (except farmers) (8.9%); material moving occupations (8.7%); sales and office occupations (6.4%)
Most popular occupations of females: education, training, and library occupations (44.5%); sales and office occupations (43.7%); service occupations (6.3%); healthcare practitioners and technical occupations (6.1%); community and social services occupations (5.0%); legal occupations (4.1%); management occupations (except farmers) (3.9%)
Roads and streets: Woodmore Ln; Moorecrest Pl.
Woodmore neighborhood detailed profile
Area: 0.021 square miles
Population: 27
Population density:
| Woodmore: | 1,307 people per square mile |
| Kannapolis: | 1,748 people per square mile |
Median household income in 2021:
| Woodmore: | $88,919 |
| Kannapolis: | $58,084 |
Median rent in in 2021:
| Woodmore: | $615 |
| Kannapolis: | $733 |
Male vs Females
| Males: | 13 |
| Females: | 13 |
Median age
| Males: | 28.2 years |
| Females: | 28.8 years |
Average estimated value of detached houses in 2021 (100.0% of all units):
| Woodmore: | $192,375 |
| North Carolina: | $316,354 |
Most popular occupations of males: production occupations (26.5%); transportation occupations (16.2%); service occupations (12.1%); construction, extraction, and maintenance occupations (10.4%); management occupations (except farmers) (8.9%); material moving occupations (8.7%); sales and office occupations (6.4%)
Most popular occupations of females: education, training, and library occupations (44.5%); sales and office occupations (43.7%); service occupations (6.3%); healthcare practitioners and technical occupations (6.1%); community and social services occupations (5.0%); legal occupations (4.1%); management occupations (except farmers) (3.9%)
Roads and streets: Woodmore Ln; Moorecrest Pl.
Woodmore neighborhood detailed profile
Wren St Mobile Home Park neighborhood in Kannapolis statistics: (Find on map)
Area: 0.033 square miles
Population: 43
Population density:
Median household income in 2021:
Median rent in in 2021:
Male vs Females
Median age
Average estimated value of detached houses in 2021 (95.2% of all units):
Most popular occupations of males: production occupations (26.5%); transportation occupations (16.0%); service occupations (12.1%); construction, extraction, and maintenance occupations (10.4%); management occupations (except farmers) (8.9%); material moving occupations (8.6%); sales and office occupations (6.3%)
Most popular occupations of females: education, training, and library occupations (44.5%); sales and office occupations (43.7%); service occupations (6.2%); healthcare practitioners and technical occupations (6.1%); community and social services occupations (4.9%); legal occupations (4.0%); management occupations (except farmers) (3.8%)
Roads and streets: Davie Ave; Caswell Ave; Bertie Ave.
Other features: Irish Buffalo Crk.
Wren St Mobile Home Park neighborhood detailed profile
Area: 0.033 square miles
Population: 43
Population density:
| Wren St Mobile Home Park: | 1,322 people per square mile |
| Kannapolis: | 1,748 people per square mile |
Median household income in 2021:
| Wren St Mobile Home Park: | $88,919 |
| Kannapolis: | $58,084 |
Median rent in in 2021:
| Wren St Mobile Home Park: | $615 |
| Kannapolis: | $733 |
Male vs Females
| Males: | 21 |
| Females: | 22 |
Median age
| Males: | 28.2 years |
| Females: | 28.8 years |
Average estimated value of detached houses in 2021 (95.2% of all units):
| Wren St Mobile Home Park: | $192,375 |
| North Carolina: | $316,354 |
Most popular occupations of males: production occupations (26.5%); transportation occupations (16.0%); service occupations (12.1%); construction, extraction, and maintenance occupations (10.4%); management occupations (except farmers) (8.9%); material moving occupations (8.6%); sales and office occupations (6.3%)
Most popular occupations of females: education, training, and library occupations (44.5%); sales and office occupations (43.7%); service occupations (6.2%); healthcare practitioners and technical occupations (6.1%); community and social services occupations (4.9%); legal occupations (4.0%); management occupations (except farmers) (3.8%)
Roads and streets: Davie Ave; Caswell Ave; Bertie Ave.
Other features: Irish Buffalo Crk.
Wren St Mobile Home Park neighborhood detailed profile