Phenix City, Alabama Submit your own pictures of this city and show them to the world
OSM Map
General Map
Google Map
MSN Map
OSM Map
General Map
Google Map
MSN Map
OSM Map
General Map
Google Map
MSN Map
OSM Map
General Map
Google Map
MSN Map
Please wait while loading the map...
Population in 2022: 38,267 (97% urban, 3% rural). Population change since 2000: +35.4%Males: 18,679 Females: 19,588
March 2022 cost of living index in Phenix City: 83.4 (less than average, U.S. average is 100) Percentage of residents living in poverty in 2022: 25.5%for White Non-Hispanic residents , 31.2% for Black residents , 48.1% for Hispanic or Latino residents , 100.0% for Native Hawaiian and other Pacific Islander residents , 55.2% for other race residents , 33.7% for two or more races residents )
Profiles of local businesses
Business Search - 14 Million verified businesses
Data:
Median household income ($)
Median household income (% change since 2000)
Household income diversity
Ratio of average income to average house value (%)
Ratio of average income to average rent
Median household income ($) - White
Median household income ($) - Black or African American
Median household income ($) - Asian
Median household income ($) - Hispanic or Latino
Median household income ($) - American Indian and Alaska Native
Median household income ($) - Multirace
Median household income ($) - Other Race
Median household income for houses/condos with a mortgage ($)
Median household income for apartments without a mortgage ($)
Races - White alone (%)
Races - White alone (% change since 2000)
Races - Black alone (%)
Races - Black alone (% change since 2000)
Races - American Indian alone (%)
Races - American Indian alone (% change since 2000)
Races - Asian alone (%)
Races - Asian alone (% change since 2000)
Races - Hispanic (%)
Races - Hispanic (% change since 2000)
Races - Native Hawaiian and Other Pacific Islander alone (%)
Races - Native Hawaiian and Other Pacific Islander alone (% change since 2000)
Races - Two or more races (%)
Races - Two or more races (% change since 2000)
Races - Other race alone (%)
Races - Other race alone (% change since 2000)
Racial diversity
Unemployment (%)
Unemployment (% change since 2000)
Unemployment (%) - White
Unemployment (%) - Black or African American
Unemployment (%) - Asian
Unemployment (%) - Hispanic or Latino
Unemployment (%) - American Indian and Alaska Native
Unemployment (%) - Multirace
Unemployment (%) - Other Race
Population density (people per square mile)
Population - Males (%)
Population - Females (%)
Population - Males (%) - White
Population - Males (%) - Black or African American
Population - Males (%) - Asian
Population - Males (%) - Hispanic or Latino
Population - Males (%) - American Indian and Alaska Native
Population - Males (%) - Multirace
Population - Males (%) - Other Race
Population - Females (%) - White
Population - Females (%) - Black or African American
Population - Females (%) - Asian
Population - Females (%) - Hispanic or Latino
Population - Females (%) - American Indian and Alaska Native
Population - Females (%) - Multirace
Population - Females (%) - Other Race
Coronavirus confirmed cases (Jul 05, 2024)
Deaths caused by coronavirus (Jul 05, 2024)
Coronavirus confirmed cases (per 100k population) (Jul 05, 2024)
Deaths caused by coronavirus (per 100k population) (Jul 05, 2024)
Daily increase in number of cases (Jul 05, 2024)
Weekly increase in number of cases (Jul 05, 2024)
Cases doubled (in days) (Jul 05, 2024)
Hospitalized patients (Apr 18, 2022)
Negative test results (Apr 18, 2022)
Total test results (Apr 18, 2022)
COVID Vaccine doses distributed (per 100k population) (Sep 19, 2023)
COVID Vaccine doses administered (per 100k population) (Sep 19, 2023)
COVID Vaccine doses distributed (Sep 19, 2023)
COVID Vaccine doses administered (Sep 19, 2023)
Likely homosexual households (%)
Likely homosexual households (% change since 2000)
Likely homosexual households - Lesbian couples (%)
Likely homosexual households - Lesbian couples (% change since 2000)
Likely homosexual households - Gay men (%)
Likely homosexual households - Gay men (% change since 2000)
Cost of living index
Median gross rent ($)
Median contract rent ($)
Median monthly housing costs ($)
Median house or condo value ($)
Median house or condo value ($ change since 2000)
Mean house or condo value by units in structure - 1, detached ($)
Mean house or condo value by units in structure - 1, attached ($)
Mean house or condo value by units in structure - 2 ($)
Mean house or condo value by units in structure by units in structure - 3 or 4 ($)
Mean house or condo value by units in structure - 5 or more ($)
Mean house or condo value by units in structure - Boat, RV, van, etc. ($)
Mean house or condo value by units in structure - Mobile home ($)
Median house or condo value ($) - White
Median house or condo value ($) - Black or African American
Median house or condo value ($) - Asian
Median house or condo value ($) - Hispanic or Latino
Median house or condo value ($) - American Indian and Alaska Native
Median house or condo value ($) - Multirace
Median house or condo value ($) - Other Race
Median resident age
Resident age diversity
Median resident age - Males
Median resident age - Females
Median resident age - White
Median resident age - Black or African American
Median resident age - Asian
Median resident age - Hispanic or Latino
Median resident age - American Indian and Alaska Native
Median resident age - Multirace
Median resident age - Other Race
Median resident age - Males - White
Median resident age - Males - Black or African American
Median resident age - Males - Asian
Median resident age - Males - Hispanic or Latino
Median resident age - Males - American Indian and Alaska Native
Median resident age - Males - Multirace
Median resident age - Males - Other Race
Median resident age - Females - White
Median resident age - Females - Black or African American
Median resident age - Females - Asian
Median resident age - Females - Hispanic or Latino
Median resident age - Females - American Indian and Alaska Native
Median resident age - Females - Multirace
Median resident age - Females - Other Race
Commute - mean travel time to work (minutes)
Travel time to work - Less than 5 minutes (%)
Travel time to work - Less than 5 minutes (% change since 2000)
Travel time to work - 5 to 9 minutes (%)
Travel time to work - 5 to 9 minutes (% change since 2000)
Travel time to work - 10 to 19 minutes (%)
Travel time to work - 10 to 19 minutes (% change since 2000)
Travel time to work - 20 to 29 minutes (%)
Travel time to work - 20 to 29 minutes (% change since 2000)
Travel time to work - 30 to 39 minutes (%)
Travel time to work - 30 to 39 minutes (% change since 2000)
Travel time to work - 40 to 59 minutes (%)
Travel time to work - 40 to 59 minutes (% change since 2000)
Travel time to work - 60 to 89 minutes (%)
Travel time to work - 60 to 89 minutes (% change since 2000)
Travel time to work - 90 or more minutes (%)
Travel time to work - 90 or more minutes (% change since 2000)
Marital status - Never married (%)
Marital status - Now married (%)
Marital status - Separated (%)
Marital status - Widowed (%)
Marital status - Divorced (%)
Median family income ($)
Median family income (% change since 2000)
Median non-family income ($)
Median non-family income (% change since 2000)
Median per capita income ($)
Median per capita income (% change since 2000)
Median family income ($) - White
Median family income ($) - Black or African American
Median family income ($) - Asian
Median family income ($) - Hispanic or Latino
Median family income ($) - American Indian and Alaska Native
Median family income ($) - Multirace
Median family income ($) - Other Race
Median year house/condo built
Median year apartment built
Year house built - Built 2005 or later (%)
Year house built - Built 2000 to 2004 (%)
Year house built - Built 1990 to 1999 (%)
Year house built - Built 1980 to 1989 (%)
Year house built - Built 1970 to 1979 (%)
Year house built - Built 1960 to 1969 (%)
Year house built - Built 1950 to 1959 (%)
Year house built - Built 1940 to 1949 (%)
Year house built - Built 1939 or earlier (%)
Average household size
Household density (households per square mile)
Average household size - White
Average household size - Black or African American
Average household size - Asian
Average household size - Hispanic or Latino
Average household size - American Indian and Alaska Native
Average household size - Multirace
Average household size - Other Race
Occupied housing units (%)
Vacant housing units (%)
Owner occupied housing units (%)
Renter occupied housing units (%)
Vacancy status - For rent (%)
Vacancy status - For sale only (%)
Vacancy status - Rented or sold, not occupied (%)
Vacancy status - For seasonal, recreational, or occasional use (%)
Vacancy status - For migrant workers (%)
Vacancy status - Other vacant (%)
Residents with income below the poverty level (%)
Residents with income below 50% of the poverty level (%)
Children below poverty level (%)
Poor families by family type - Married-couple family (%)
Poor families by family type - Male, no wife present (%)
Poor families by family type - Female, no husband present (%)
Poverty status for native-born residents (%)
Poverty status for foreign-born residents (%)
Poverty among high school graduates not in families (%)
Poverty among people who did not graduate high school not in families (%)
Residents with income below the poverty level (%) - White
Residents with income below the poverty level (%) - Black or African American
Residents with income below the poverty level (%) - Asian
Residents with income below the poverty level (%) - Hispanic or Latino
Residents with income below the poverty level (%) - American Indian and Alaska Native
Residents with income below the poverty level (%) - Multirace
Residents with income below the poverty level (%) - Other Race
Air pollution - Air Quality Index (AQI)
Air pollution - CO
Air pollution - NO2
Air pollution - SO2
Air pollution - Ozone
Air pollution - PM10
Air pollution - PM25
Air pollution - Pb
Crime - Murders per 100,000 population
Crime - Rapes per 100,000 population
Crime - Robberies per 100,000 population
Crime - Assaults per 100,000 population
Crime - Burglaries per 100,000 population
Crime - Thefts per 100,000 population
Crime - Auto thefts per 100,000 population
Crime - Arson per 100,000 population
Crime - City-data.com crime index
Crime - Violent crime index
Crime - Property crime index
Crime - Murders per 100,000 population (5 year average)
Crime - Rapes per 100,000 population (5 year average)
Crime - Robberies per 100,000 population (5 year average)
Crime - Assaults per 100,000 population (5 year average)
Crime - Burglaries per 100,000 population (5 year average)
Crime - Thefts per 100,000 population (5 year average)
Crime - Auto thefts per 100,000 population (5 year average)
Crime - Arson per 100,000 population (5 year average)
Crime - City-data.com crime index (5 year average)
Crime - Violent crime index (5 year average)
Crime - Property crime index (5 year average)
1996 Presidential Elections Results (%) - Democratic Party (Clinton)
1996 Presidential Elections Results (%) - Republican Party (Dole)
1996 Presidential Elections Results (%) - Other
2000 Presidential Elections Results (%) - Democratic Party (Gore)
2000 Presidential Elections Results (%) - Republican Party (Bush)
2000 Presidential Elections Results (%) - Other
2004 Presidential Elections Results (%) - Democratic Party (Kerry)
2004 Presidential Elections Results (%) - Republican Party (Bush)
2004 Presidential Elections Results (%) - Other
2008 Presidential Elections Results (%) - Democratic Party (Obama)
2008 Presidential Elections Results (%) - Republican Party (McCain)
2008 Presidential Elections Results (%) - Other
2012 Presidential Elections Results (%) - Democratic Party (Obama)
2012 Presidential Elections Results (%) - Republican Party (Romney)
2012 Presidential Elections Results (%) - Other
2016 Presidential Elections Results (%) - Democratic Party (Clinton)
2016 Presidential Elections Results (%) - Republican Party (Trump)
2016 Presidential Elections Results (%) - Other
2020 Presidential Elections Results (%) - Democratic Party (Biden)
2020 Presidential Elections Results (%) - Republican Party (Trump)
2020 Presidential Elections Results (%) - Other
Ancestries Reported - Arab (%)
Ancestries Reported - Czech (%)
Ancestries Reported - Danish (%)
Ancestries Reported - Dutch (%)
Ancestries Reported - English (%)
Ancestries Reported - French (%)
Ancestries Reported - French Canadian (%)
Ancestries Reported - German (%)
Ancestries Reported - Greek (%)
Ancestries Reported - Hungarian (%)
Ancestries Reported - Irish (%)
Ancestries Reported - Italian (%)
Ancestries Reported - Lithuanian (%)
Ancestries Reported - Norwegian (%)
Ancestries Reported - Polish (%)
Ancestries Reported - Portuguese (%)
Ancestries Reported - Russian (%)
Ancestries Reported - Scotch-Irish (%)
Ancestries Reported - Scottish (%)
Ancestries Reported - Slovak (%)
Ancestries Reported - Subsaharan African (%)
Ancestries Reported - Swedish (%)
Ancestries Reported - Swiss (%)
Ancestries Reported - Ukrainian (%)
Ancestries Reported - United States (%)
Ancestries Reported - Welsh (%)
Ancestries Reported - West Indian (%)
Ancestries Reported - Other (%)
Educational Attainment - No schooling completed (%)
Educational Attainment - Less than high school (%)
Educational Attainment - High school or equivalent (%)
Educational Attainment - Less than 1 year of college (%)
Educational Attainment - 1 or more years of college (%)
Educational Attainment - Associate degree (%)
Educational Attainment - Bachelor's degree (%)
Educational Attainment - Master's degree (%)
Educational Attainment - Professional school degree (%)
Educational Attainment - Doctorate degree (%)
School Enrollment - Nursery, preschool (%)
School Enrollment - Kindergarten (%)
School Enrollment - Grade 1 to 4 (%)
School Enrollment - Grade 5 to 8 (%)
School Enrollment - Grade 9 to 12 (%)
School Enrollment - College undergrad (%)
School Enrollment - Graduate or professional (%)
School Enrollment - Not enrolled in school (%)
School enrollment - Public schools (%)
School enrollment - Private schools (%)
School enrollment - Not enrolled (%)
Median number of rooms in houses and condos
Median number of rooms in apartments
Housing units lacking complete plumbing facilities (%)
Housing units lacking complete kitchen facilities (%)
Density of houses
Urban houses (%)
Rural houses (%)
Households with people 60 years and over (%)
Households with people 65 years and over (%)
Households with people 75 years and over (%)
Households with one or more nonrelatives (%)
Households with no nonrelatives (%)
Population in households (%)
Family households (%)
Nonfamily households (%)
Population in families (%)
Family households with own children (%)
Median number of bedrooms in owner occupied houses
Mean number of bedrooms in owner occupied houses
Median number of bedrooms in renter occupied houses
Mean number of bedrooms in renter occupied houses
Median number of vehichles in owner occupied houses
Mean number of vehichles in owner occupied houses
Median number of vehichles in renter occupied houses
Mean number of vehichles in renter occupied houses
Mortgage status - with mortgage (%)
Mortgage status - with second mortgage (%)
Mortgage status - with home equity loan (%)
Mortgage status - with both second mortgage and home equity loan (%)
Mortgage status - without a mortgage (%)
Average family size
Average family size - White
Average family size - Black or African American
Average family size - Asian
Average family size - Hispanic or Latino
Average family size - American Indian and Alaska Native
Average family size - Multirace
Average family size - Other Race
Geographical mobility - Same house 1 year ago (%)
Geographical mobility - Moved within same county (%)
Geographical mobility - Moved from different county within same state (%)
Geographical mobility - Moved from different state (%)
Geographical mobility - Moved from abroad (%)
Place of birth - Born in state of residence (%)
Place of birth - Born in other state (%)
Place of birth - Native, outside of US (%)
Place of birth - Foreign born (%)
Housing units in structures - 1, detached (%)
Housing units in structures - 1, attached (%)
Housing units in structures - 2 (%)
Housing units in structures - 3 or 4 (%)
Housing units in structures - 5 to 9 (%)
Housing units in structures - 10 to 19 (%)
Housing units in structures - 20 to 49 (%)
Housing units in structures - 50 or more (%)
Housing units in structures - Mobile home (%)
Housing units in structures - Boat, RV, van, etc. (%)
House/condo owner moved in on average (years ago)
Renter moved in on average (years ago)
Year householder moved into unit - Moved in 1999 to March 2000 (%)
Year householder moved into unit - Moved in 1995 to 1998 (%)
Year householder moved into unit - Moved in 1990 to 1994 (%)
Year householder moved into unit - Moved in 1980 to 1989 (%)
Year householder moved into unit - Moved in 1970 to 1979 (%)
Year householder moved into unit - Moved in 1969 or earlier (%)
Means of transportation to work - Drove car alone (%)
Means of transportation to work - Carpooled (%)
Means of transportation to work - Public transportation (%)
Means of transportation to work - Bus or trolley bus (%)
Means of transportation to work - Streetcar or trolley car (%)
Means of transportation to work - Subway or elevated (%)
Means of transportation to work - Railroad (%)
Means of transportation to work - Ferryboat (%)
Means of transportation to work - Taxicab (%)
Means of transportation to work - Motorcycle (%)
Means of transportation to work - Bicycle (%)
Means of transportation to work - Walked (%)
Means of transportation to work - Other means (%)
Working at home (%)
Industry diversity
Most Common Industries - Agriculture, forestry, fishing and hunting, and mining (%)
Most Common Industries - Agriculture, forestry, fishing and hunting (%)
Most Common Industries - Mining, quarrying, and oil and gas extraction (%)
Most Common Industries - Construction (%)
Most Common Industries - Manufacturing (%)
Most Common Industries - Wholesale trade (%)
Most Common Industries - Retail trade (%)
Most Common Industries - Transportation and warehousing, and utilities (%)
Most Common Industries - Transportation and warehousing (%)
Most Common Industries - Utilities (%)
Most Common Industries - Information (%)
Most Common Industries - Finance and insurance, and real estate and rental and leasing (%)
Most Common Industries - Finance and insurance (%)
Most Common Industries - Real estate and rental and leasing (%)
Most Common Industries - Professional, scientific, and management, and administrative and waste management services (%)
Most Common Industries - Professional, scientific, and technical services (%)
Most Common Industries - Management of companies and enterprises (%)
Most Common Industries - Administrative and support and waste management services (%)
Most Common Industries - Educational services, and health care and social assistance (%)
Most Common Industries - Educational services (%)
Most Common Industries - Health care and social assistance (%)
Most Common Industries - Arts, entertainment, and recreation, and accommodation and food services (%)
Most Common Industries - Arts, entertainment, and recreation (%)
Most Common Industries - Accommodation and food services (%)
Most Common Industries - Other services, except public administration (%)
Most Common Industries - Public administration (%)
Occupation diversity
Most Common Occupations - Management, business, science, and arts occupations (%)
Most Common Occupations - Management, business, and financial occupations (%)
Most Common Occupations - Management occupations (%)
Most Common Occupations - Business and financial operations occupations (%)
Most Common Occupations - Computer, engineering, and science occupations (%)
Most Common Occupations - Computer and mathematical occupations (%)
Most Common Occupations - Architecture and engineering occupations (%)
Most Common Occupations - Life, physical, and social science occupations (%)
Most Common Occupations - Education, legal, community service, arts, and media occupations (%)
Most Common Occupations - Community and social service occupations (%)
Most Common Occupations - Legal occupations (%)
Most Common Occupations - Education, training, and library occupations (%)
Most Common Occupations - Arts, design, entertainment, sports, and media occupations (%)
Most Common Occupations - Healthcare practitioners and technical occupations (%)
Most Common Occupations - Health diagnosing and treating practitioners and other technical occupations (%)
Most Common Occupations - Health technologists and technicians (%)
Most Common Occupations - Service occupations (%)
Most Common Occupations - Healthcare support occupations (%)
Most Common Occupations - Protective service occupations (%)
Most Common Occupations - Fire fighting and prevention, and other protective service workers including supervisors (%)
Most Common Occupations - Law enforcement workers including supervisors (%)
Most Common Occupations - Food preparation and serving related occupations (%)
Most Common Occupations - Building and grounds cleaning and maintenance occupations (%)
Most Common Occupations - Personal care and service occupations (%)
Most Common Occupations - Sales and office occupations (%)
Most Common Occupations - Sales and related occupations (%)
Most Common Occupations - Office and administrative support occupations (%)
Most Common Occupations - Natural resources, construction, and maintenance occupations (%)
Most Common Occupations - Farming, fishing, and forestry occupations (%)
Most Common Occupations - Construction and extraction occupations (%)
Most Common Occupations - Installation, maintenance, and repair occupations (%)
Most Common Occupations - Production, transportation, and material moving occupations (%)
Most Common Occupations - Production occupations (%)
Most Common Occupations - Transportation occupations (%)
Most Common Occupations - Material moving occupations (%)
People in Group quarters - Institutionalized population (%)
People in Group quarters - Correctional institutions (%)
People in Group quarters - Federal prisons and detention centers (%)
People in Group quarters - Halfway houses (%)
People in Group quarters - Local jails and other confinement facilities (including police lockups) (%)
People in Group quarters - Military disciplinary barracks (%)
People in Group quarters - State prisons (%)
People in Group quarters - Other types of correctional institutions (%)
People in Group quarters - Nursing homes (%)
People in Group quarters - Hospitals/wards, hospices, and schools for the handicapped (%)
People in Group quarters - Hospitals/wards and hospices for chronically ill (%)
People in Group quarters - Hospices or homes for chronically ill (%)
People in Group quarters - Military hospitals or wards for chronically ill (%)
People in Group quarters - Other hospitals or wards for chronically ill (%)
People in Group quarters - Hospitals or wards for drug/alcohol abuse (%)
People in Group quarters - Mental (Psychiatric) hospitals or wards (%)
People in Group quarters - Schools, hospitals, or wards for the mentally retarded (%)
People in Group quarters - Schools, hospitals, or wards for the physically handicapped (%)
People in Group quarters - Institutions for the deaf (%)
People in Group quarters - Institutions for the blind (%)
People in Group quarters - Orthopedic wards and institutions for the physically handicapped (%)
People in Group quarters - Wards in general hospitals for patients who have no usual home elsewhere (%)
People in Group quarters - Wards in military hospitals for patients who have no usual home elsewhere (%)
People in Group quarters - Juvenile institutions (%)
People in Group quarters - Long-term care (%)
People in Group quarters - Homes for abused, dependent, and neglected children (%)
People in Group quarters - Residential treatment centers for emotionally disturbed children (%)
People in Group quarters - Training schools for juvenile delinquents (%)
People in Group quarters - Short-term care, detention or diagnostic centers for delinquent children (%)
People in Group quarters - Type of juvenile institution unknown (%)
People in Group quarters - Noninstitutionalized population (%)
People in Group quarters - College dormitories (includes college quarters off campus) (%)
People in Group quarters - Military quarters (%)
People in Group quarters - On base (%)
People in Group quarters - Barracks, unaccompanied personnel housing (UPH), (Enlisted/Officer), ;and similar group living quarters for military personnel (%)
People in Group quarters - Transient quarters for temporary residents (%)
People in Group quarters - Military ships (%)
People in Group quarters - Group homes (%)
People in Group quarters - Homes or halfway houses for drug/alcohol abuse (%)
People in Group quarters - Homes for the mentally ill (%)
People in Group quarters - Homes for the mentally retarded (%)
People in Group quarters - Homes for the physically handicapped (%)
People in Group quarters - Other group homes (%)
People in Group quarters - Religious group quarters (%)
People in Group quarters - Dormitories (%)
People in Group quarters - Agriculture workers' dormitories on farms (%)
People in Group quarters - Job Corps and vocational training facilities (%)
People in Group quarters - Other workers' dormitories (%)
People in Group quarters - Crews of maritime vessels (%)
People in Group quarters - Other nonhousehold living situations (%)
People in Group quarters - Other noninstitutional group quarters (%)
Residents speaking English at home (%)
Residents speaking English at home - Born in the United States (%)
Residents speaking English at home - Native, born elsewhere (%)
Residents speaking English at home - Foreign born (%)
Residents speaking Spanish at home (%)
Residents speaking Spanish at home - Born in the United States (%)
Residents speaking Spanish at home - Native, born elsewhere (%)
Residents speaking Spanish at home - Foreign born (%)
Residents speaking other language at home (%)
Residents speaking other language at home - Born in the United States (%)
Residents speaking other language at home - Native, born elsewhere (%)
Residents speaking other language at home - Foreign born (%)
Class of Workers - Employee of private company (%)
Class of Workers - Self-employed in own incorporated business (%)
Class of Workers - Private not-for-profit wage and salary workers (%)
Class of Workers - Local government workers (%)
Class of Workers - State government workers (%)
Class of Workers - Federal government workers (%)
Class of Workers - Self-employed workers in own not incorporated business and Unpaid family workers (%)
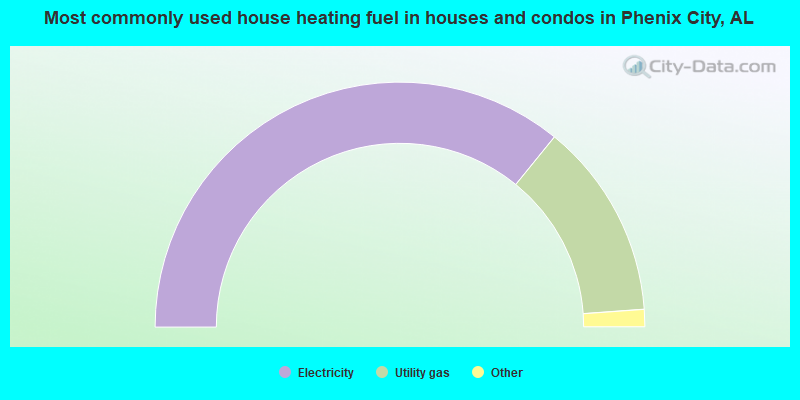
House heating fuel used in houses and condos - Utility gas (%)
House heating fuel used in houses and condos - Bottled, tank, or LP gas (%)
House heating fuel used in houses and condos - Electricity (%)
House heating fuel used in houses and condos - Fuel oil, kerosene, etc. (%)
House heating fuel used in houses and condos - Coal or coke (%)
House heating fuel used in houses and condos - Wood (%)
House heating fuel used in houses and condos - Solar energy (%)
House heating fuel used in houses and condos - Other fuel (%)
House heating fuel used in houses and condos - No fuel used (%)
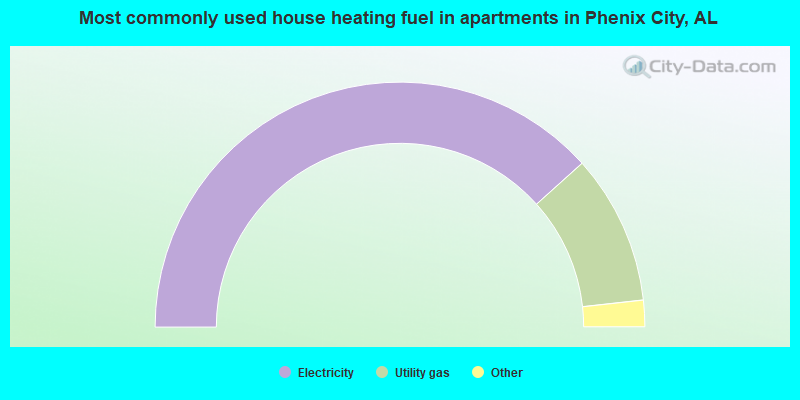
House heating fuel used in apartments - Utility gas (%)
House heating fuel used in apartments - Bottled, tank, or LP gas (%)
House heating fuel used in apartments - Electricity (%)
House heating fuel used in apartments - Fuel oil, kerosene, etc. (%)
House heating fuel used in apartments - Coal or coke (%)
House heating fuel used in apartments - Wood (%)
House heating fuel used in apartments - Solar energy (%)
House heating fuel used in apartments - Other fuel (%)
House heating fuel used in apartments - No fuel used (%)
Armed forces status - In Armed Forces (%)
Armed forces status - Civilian (%)
Armed forces status - Civilian - Veteran (%)
Armed forces status - Civilian - Nonveteran (%)
Fatal accidents locations in years 2005-2021
Fatal accidents locations in 2005
Fatal accidents locations in 2006
Fatal accidents locations in 2007
Fatal accidents locations in 2008
Fatal accidents locations in 2009
Fatal accidents locations in 2010
Fatal accidents locations in 2011
Fatal accidents locations in 2012
Fatal accidents locations in 2013
Fatal accidents locations in 2014
Fatal accidents locations in 2015
Fatal accidents locations in 2016
Fatal accidents locations in 2017
Fatal accidents locations in 2018
Fatal accidents locations in 2019
Fatal accidents locations in 2020
Fatal accidents locations in 2021
Alcohol use - People drinking some alcohol every month (%)
Alcohol use - People not drinking at all (%)
Alcohol use - Average days/month drinking alcohol
Alcohol use - Average drinks/week
Alcohol use - Average days/year people drink much
Audiometry - Average condition of hearing (%)
Audiometry - People that can hear a whisper from across a quiet room (%)
Audiometry - People that can hear normal voice from across a quiet room (%)
Audiometry - Ears ringing, roaring, buzzing (%)
Audiometry - Had a job exposure to loud noise (%)
Audiometry - Had off-work exposure to loud noise (%)
Blood Pressure & Cholesterol - Has high blood pressure (%)
Blood Pressure & Cholesterol - Checking blood pressure at home (%)
Blood Pressure & Cholesterol - Frequently checking blood cholesterol (%)
Blood Pressure & Cholesterol - Has high cholesterol level (%)
Consumer Behavior - Money monthly spent on food at supermarket/grocery store
Consumer Behavior - Money monthly spent on food at other stores
Consumer Behavior - Money monthly spent on eating out
Consumer Behavior - Money monthly spent on carryout/delivered foods
Consumer Behavior - Income spent on food at supermarket/grocery store (%)
Consumer Behavior - Income spent on food at other stores (%)
Consumer Behavior - Income spent on eating out (%)
Consumer Behavior - Income spent on carryout/delivered foods (%)
Current Health Status - General health condition (%)
Current Health Status - Blood donors (%)
Current Health Status - Has blood ever tested for HIV virus (%)
Current Health Status - Left-handed people (%)
Dermatology - People using sunscreen (%)
Diabetes - Diabetics (%)
Diabetes - Had a blood test for high blood sugar (%)
Diabetes - People taking insulin (%)
Diet Behavior & Nutrition - Diet health (%)
Diet Behavior & Nutrition - Milk product consumption (# of products/month)
Diet Behavior & Nutrition - Meals not home prepared (#/week)
Diet Behavior & Nutrition - Meals from fast food or pizza place (#/week)
Diet Behavior & Nutrition - Ready-to-eat foods (#/month)
Diet Behavior & Nutrition - Frozen meals/pizza (#/month)
Drug Use - People that ever used marijuana or hashish (%)
Drug Use - Ever used hard drugs (%)
Drug Use - Ever used any form of cocaine (%)
Drug Use - Ever used heroin (%)
Drug Use - Ever used methamphetamine (%)
Health Insurance - People covered by health insurance (%)
Kidney Conditions-Urology - Avg. # of times urinating at night
Medical Conditions - People with asthma (%)
Medical Conditions - People with anemia (%)
Medical Conditions - People with psoriasis (%)
Medical Conditions - People with overweight (%)
Medical Conditions - Elderly people having difficulties in thinking or remembering (%)
Medical Conditions - People who ever received blood transfusion (%)
Medical Conditions - People having trouble seeing even with glass/contacts (%)
Medical Conditions - People with arthritis (%)
Medical Conditions - People with gout (%)
Medical Conditions - People with congestive heart failure (%)
Medical Conditions - People with coronary heart disease (%)
Medical Conditions - People with angina pectoris (%)
Medical Conditions - People who ever had heart attack (%)
Medical Conditions - People who ever had stroke (%)
Medical Conditions - People with emphysema (%)
Medical Conditions - People with thyroid problem (%)
Medical Conditions - People with chronic bronchitis (%)
Medical Conditions - People with any liver condition (%)
Medical Conditions - People who ever had cancer or malignancy (%)
Mental Health - People who have little interest in doing things (%)
Mental Health - People feeling down, depressed, or hopeless (%)
Mental Health - People who have trouble sleeping or sleeping too much (%)
Mental Health - People feeling tired or having little energy (%)
Mental Health - People with poor appetite or overeating (%)
Mental Health - People feeling bad about themself (%)
Mental Health - People who have trouble concentrating on things (%)
Mental Health - People moving or speaking slowly or too fast (%)
Mental Health - People having thoughts they would be better off dead (%)
Oral Health - Average years since last visit a dentist
Oral Health - People embarrassed because of mouth (%)
Oral Health - People with gum disease (%)
Oral Health - General health of teeth and gums (%)
Oral Health - Average days a week using dental floss/device
Oral Health - Average days a week using mouthwash for dental problem
Oral Health - Average number of teeth
Pesticide Use - Households using pesticides to control insects (%)
Pesticide Use - Households using pesticides to kill weeds (%)
Physical Activity - People doing vigorous-intensity work activities (%)
Physical Activity - People doing moderate-intensity work activities (%)
Physical Activity - People walking or bicycling (%)
Physical Activity - People doing vigorous-intensity recreational activities (%)
Physical Activity - People doing moderate-intensity recreational activities (%)
Physical Activity - Average hours a day doing sedentary activities
Physical Activity - Average hours a day watching TV or videos
Physical Activity - Average hours a day using computer
Physical Functioning - People having limitations keeping them from working (%)
Physical Functioning - People limited in amount of work they can do (%)
Physical Functioning - People that need special equipment to walk (%)
Physical Functioning - People experiencing confusion/memory problems (%)
Physical Functioning - People requiring special healthcare equipment (%)
Prescription Medications - Average number of prescription medicines taking
Preventive Aspirin Use - Adults 40+ taking low-dose aspirin (%)
Reproductive Health - Vaginal deliveries (%)
Reproductive Health - Cesarean deliveries (%)
Reproductive Health - Deliveries resulted in a live birth (%)
Reproductive Health - Pregnancies resulted in a delivery (%)
Reproductive Health - Women breastfeeding newborns (%)
Reproductive Health - Women that had a hysterectomy (%)
Reproductive Health - Women that had both ovaries removed (%)
Reproductive Health - Women that have ever taken birth control pills (%)
Reproductive Health - Women taking birth control pills (%)
Reproductive Health - Women that have ever used Depo-Provera or injectables (%)
Reproductive Health - Women that have ever used female hormones (%)
Sexual Behavior - People 18+ that ever had sex (vaginal, anal, or oral) (%)
Sexual Behavior - Males 18+ that ever had vaginal sex with a woman (%)
Sexual Behavior - Males 18+ that ever performed oral sex on a woman (%)
Sexual Behavior - Males 18+ that ever had anal sex with a woman (%)
Sexual Behavior - Males 18+ that ever had any sex with a man (%)
Sexual Behavior - Females 18+ that ever had vaginal sex with a man (%)
Sexual Behavior - Females 18+ that ever performed oral sex on a man (%)
Sexual Behavior - Females 18+ that ever had anal sex with a man (%)
Sexual Behavior - Females 18+ that ever had any kind of sex with a woman (%)
Sexual Behavior - Average age people first had sex
Sexual Behavior - Average number of female sex partners in lifetime (males 18+)
Sexual Behavior - Average number of female vaginal sex partners in lifetime (males 18+)
Sexual Behavior - Average age people first performed oral sex on a woman (18+)
Sexual Behavior - Average number of woman performed oral sex on in lifetime (18+)
Sexual Behavior - Average number of male sex partners in lifetime (males 18+)
Sexual Behavior - Average number of male anal sex partners in lifetime (males 18+)
Sexual Behavior - Average age people first performed oral sex on a man (18+)
Sexual Behavior - Average number of male oral sex partners in lifetime (18+)
Sexual Behavior - People using protection when performing oral sex (%)
Sexual Behavior - Average number of times people have vaginal or anal sex a year
Sexual Behavior - People having sex without condom (%)
Sexual Behavior - Average number of male sex partners in lifetime (females 18+)
Sexual Behavior - Average number of male vaginal sex partners in lifetime (females 18+)
Sexual Behavior - Average number of female sex partners in lifetime (females 18+)
Sexual Behavior - Circumcised males 18+ (%)
Sleep Disorders - Average hours sleeping at night
Sleep Disorders - People that has trouble sleeping (%)
Smoking-Cigarette Use - People smoking cigarettes (%)
Taste & Smell - People 40+ having problems with smell (%)
Taste & Smell - People 40+ having problems with taste (%)
Taste & Smell - People 40+ that ever had wisdom teeth removed (%)
Taste & Smell - People 40+ that ever had tonsils teeth removed (%)
Taste & Smell - People 40+ that ever had a loss of consciousness because of a head injury (%)
Taste & Smell - People 40+ that ever had a broken nose or other serious injury to face or skull (%)
Taste & Smell - People 40+ that ever had two or more sinus infections (%)
Weight - Average height (inches)
Weight - Average weight (pounds)
Weight - Average BMI
Weight - People that are obese (%)
Weight - People that ever were obese (%)
Weight - People trying to lose weight (%)
18,006 46.4% Black alone 15,495 40.0% White alone 2,160 5.6% Hispanic 2,104 5.4% Two or more races 549 1.4% Asian alone 521 1.3% Other race alone 62 0.2% Native Hawaiian and Other 38 0.10% American Indian alone
Officers per 1,000 residents here:
2.10Alabama average:
2.40
Latest news from Phenix City, AL collected exclusively by city-data.com from local newspapers, TV, and radio stations
Ancestries: American (13.5%), English (5.1%), German (4.6%), Irish (2.1%), European (1.7%), African (1.0%).
Current Local Time:
Land area: 24.6 square miles.
Population density: 1,556 people per square mile (low).
1,563 residents are foreign born (1.9% Latin America , 1.2% Asia , 0.8% Europe ).
This city:
4.0%Alabama:
3.5%
Median real estate property taxes paid for housing units with mortgages in 2022: $976 (0.5%)Median real estate property taxes paid for housing units with no mortgage in 2022: $602 (0.4%)
Nearest city with pop. 50,000+: Columbus, GA
Nearest city with pop. 200,000+: Montgomery, AL
Nearest city with pop. 1,000,000+: Houston, TX
Nearest cities:
Latitude: 32.47 N, Longitude: 85.02 W
Daytime population change due to commuting: -4,653 (-12.0%)Workers who live and work in this city: 5,642 (32.3%)
Single-family new house construction building permits:
2022: 94 buildings , average cost: $132,4002021: 104 buildings , average cost: $104,0002020: 55 buildings , average cost: $145,8002019: 56 buildings , average cost: $153,5002018: 83 buildings , average cost: $146,9002017: 52 buildings , average cost: $181,4002016: 45 buildings , average cost: $211,6002015: 86 buildings , average cost: $188,9002014: 113 buildings , average cost: $190,7002013: 147 buildings , average cost: $192,8002012: 156 buildings , average cost: $194,2002011: 315 buildings , average cost: $191,9002010: 260 buildings , average cost: $177,0002009: 392 buildings , average cost: $174,3002008: 204 buildings , average cost: $151,1002007: 246 buildings , average cost: $121,8002006: 395 buildings , average cost: $129,9002005: 391 buildings , average cost: $117,3002004: 354 buildings , average cost: $90,0002003: 283 buildings , average cost: $89,1002002: 171 buildings , average cost: $89,4002001: 201 buildings , average cost: $88,5002000: 108 buildings , average cost: $76,1001999: 166 buildings , average cost: $92,9001998: 100 buildings , average cost: $80,6001997: 119 buildings , average cost: $78,300Unemployment in December 2023:
Population change in the 1990s: +2,468 (+9.6%).
Most common occupations in Phenix City, AL (%)
Both Males Females
Other production occupations, including supervisors (6.0%)
Other office and administrative support workers, including supervisors (4.6%)
Other management occupations, except farmers and farm managers (4.2%)
Other sales and related occupations, including supervisors (3.9%)
Textile, apparel, and furnishings workers (3.7%)
Building and grounds cleaning and maintenance occupations (3.4%)
Secretaries and administrative assistants (3.3%)
Other production occupations, including supervisors (9.1%)
Electrical equipment mechanics and other installation, maintenance, and repair workers, including supervisors (5.6%)
Other management occupations, except farmers and farm managers (5.6%)
Laborers and material movers, hand (4.7%)
Textile, apparel, and furnishings workers (4.0%)
Driver/sales workers and truck drivers (3.9%)
Other sales and related occupations, including supervisors (3.5%)
Other office and administrative support workers, including supervisors (7.4%)
Secretaries and administrative assistants (6.3%)
Cashiers (4.9%)
Other sales and related occupations, including supervisors (4.3%)
Health technologists and technicians (4.1%)
Preschool, kindergarten, elementary, and middle school teachers (3.6%)
Building and grounds cleaning and maintenance occupations (3.5%)
Tornado activity:
Phenix City-area historical tornado activity is slightly below Alabama state average. It is 38% greater than the overall U.S. average.
On 3/31/1961, a category F3 (max. wind speeds 158-206 mph) tornado 2.8 miles away from the Phenix City city center injured 7 people and caused between $5000 and $50,000 in damages.
On 4/18/1953, a category F3 tornado 5.9 miles away from the city center killed 8 people and injured 495 people and caused between $5,000,000 and $50,000,000 in damages.
Earthquake activity:
Phenix City-area historical earthquake activity is significantly above Alabama state average. It is 34% greater than the overall U.S. average. On 4/29/2003 at 08:59:39, a magnitude 4.9 (4.4 MB, 4.6 MW, 4.9 LG, Class: Light, Intensity: IV - V) earthquake occurred 144.1 miles away from Phenix City center On 10/24/1997 at 08:35:17, a magnitude 4.9 (4.8 MB, 4.2 MS, 4.9 LG, Depth: 6.2 mi) earthquake occurred 162.0 miles away from Phenix City center On 1/18/1999 at 07:00:53, a magnitude 4.8 (4.8 MB, 4.0 LG, Depth: 0.6 mi) earthquake occurred 144.9 miles away from the city center On 8/2/1974 at 08:52:09, a magnitude 4.9 (4.3 MB, 4.9 LG) earthquake occurred 175.7 miles away from Phenix City center On 4/29/2003 at 08:59:39, a magnitude 4.6 (4.6 MW, Depth: 12.3 mi) earthquake occurred 144.1 miles away from Phenix City center On 6/24/1975 at 11:11:36, a magnitude 4.5 (4.5 MB) earthquake occurred 184.7 miles away from Phenix City center Magnitude types: regional Lg-wave magnitude (LG), body-wave magnitude (MB), surface-wave magnitude (MS), moment magnitude (MW) Natural disasters: The number of natural disasters in Russell County (18) is near the US average (15).Major Disasters (Presidential) Declared: 12Emergencies Declared: 5Storms: 10, Floods: 9, Tornadoes: 8, Hurricanes: 5, Winds: 3, Drought: 1, Snowfall: 1, Tropical Storm: 1, Winter Storm: 1, Other: 1 (Note: some incidents may be assigned to more than one category). Hospitals in Phenix City: COLUMBUS HOSPICE OF ALABAMA (1521 FIFTH AVENUE) JACK HUGHSTON MEMORIAL HOSPITAL (Government - State, provides emergency services, 4401 RIVER CHASE DRIVE) VISTACARE OF ALABAMA (3615 SOUTH RAILROAD STREET) WIREGRASS HOSPICE, PHENIX CITY (1901 STADIUM DRIVE, SUITE C) Nursing Homes in Phenix City: CANTERBURY HEALTH CARE FACILITY (1720 KNOWLES ROAD) PARKWOOD HEALTH CARE FACILITY (3301 STADIUM DRIVE) PHENIX CITY HEALTH CARE, INC (3900 LAKEWOOD DRIVE) Dialysis Facilities in Phenix City: DCI PHENIX CITY (1611 21ST COURT) PHENIX CITY DIALYSIS (1900 OPELIKA ROAD) PHYSICIAN'S CHOICE OF LEE COUNTY (5009 RIVERCHASE DRIVE) Home Health Centers in Phenix City: GENTIVA HEALTH SERVICES (5009 RIVER CHASE DRIVE, BLDG 100, SUITE C) RUSSELL COUNTY HOME CARE (1850 CRAWFORD ROAD) Airports located in Phenix City: Amtrak station near Phenix City: 3 miles: COLUMBUS (818 VETERANS PKY.) - Bus Station Services: enclosed waiting area, public restrooms, public payphones, vending machines.
College/University in Phenix City: Chattahoochee Valley Community College Full-time enrollment: 1,431; Location: 2602 College Drive; Public; Website: www.cv.edu)
Colleges/universities with over 2000 students nearest to Phenix City:
Columbus Technical College (about 4 miles; Columbus, GA ; Full-time enrollment: 3,241)
Columbus State University (about 6 miles; Columbus, GA ; FT enrollment: 6,876)
Auburn University (about 29 miles; Auburn University, AL ; FT enrollment: 22,741)
Tuskegee University (about 41 miles; Tuskegee, AL ; FT enrollment: 2,810)
Georgia Southwestern State University (about 55 miles; Americus, GA ; FT enrollment: 2,689)
Southern Union State Community College (about 56 miles; Wadley, AL ; FT enrollment: 4,120)
Gordon State College (about 65 miles; Barnesville, GA ; FT enrollment: 3,336)
Public high schools in Phenix City: CENTRAL HIGH SCH Location: 2400 DOBBS DR, Grades: 10-12)
CENTRAL FRESHMAN ACAD Location: 2800 DOBBS DRIVE, Grades: 9)
Private high schools in Phenix City: TEEN UNIVERSITY Students: 10, Location: 707 DILLINGHAM ST, Grades: 8-12, Boys only )
NEW TESTAMENT BAPTIST SCHOOL Students: 6, Location: 9650 LEE RD 240, Grades: KG-12)
Biggest public elementary/middle schools in Phenix City: PHENIX CITY INTERMEDIATE SCH Students: 1,072, Location: 2401 S RAILROAD ST, Grades: 6-7)RIDGECREST ELEM SCH Students: 690, Location: 1806 8TH PL SO, Grades: KG-5)LADONIA ELEM SCH Students: 561, Location: 9 WOODLAND DR, Grades: PK-6)PHENIX CITY ELEM SCH Students: 495, Location: 2307 SOUTH RAILROAD STREET, Grades: KG-5)SOUTH GIRARD SCH Students: 424, Location: 521 FONTAINE RD, Grades: 8)SHERWOOD ELEM SCH Students: 407, Location: 706 IDLE HOUR DR, Grades: KG-5)WESTVIEW ELEM SCH Students: 285, Location: 1012 INGERSOLL DR, Grades: KG-5)MEADOWLANE ELEM SCH Students: 210, Location: 709 MEADOWLANE DR, Grades: KG-5)LAKEWOOD ELEM SCH Students: 209, Location: 24 EXPLORER DRIVE, Grades: 3-5)LAKEWOOD PRIMARY SCH Location: #18 EXPLORER ROAD, Grades: KG-2)
Private elementary/middle schools in Phenix City: PHENIX CHRISTIAN SCHOOL Students: 92, Location: 3777 US HIGHWAY 431 N, Grades: PK-5)
ST PATRICK'S SCHOOL Students: 75, Location: 3910 LAKEWOOD DR, Grades: PK-8)
MOTHER MARY SCHOOL Students: 61, Location: 318 SEALE RD STE A, Grades: PK-8)
VERITAS ACADEMY Students: 51, Location: 4011 LAKEWOOD DR, Grades: KG-7)
See full list of schools located in Phenix City Library in Phenix City: PHENIX CITY-RUSSELL CO PUB. LIBRARY Operating income: $276,109; Location: 1501 17TH AVENUE; 49,119 books ; 448 audio materials ; 2,276 video materials ; 81 state licensed databases ; 95 print serial subscriptions )
User-submitted facts and corrections:
While Phenix City is actually in the central time zone, we actually use the easternern time zone because of the closeness of Columbus, Georgia added by Bill
Notable locations in Phenix City: (A) , Phenix City Fire Department Station 3 (B) , Phenix City Fire Department Station 1 (C) , Phenix City Fire Department Station 4 (D) . Display/hide their locations on the map
Shopping Centers: (1) , Village Green Shopping Center (2) , Sherwood Shopping Center (3) , Parkview Shopping Center (4) , Fosters Shopping Center (5) . Display/hide their locations on the map
Churches in Phenix City include: (A) , Summerville Church (B) , Phillips Christian Methodist Episcopal Temple (C) , Nichols African Methodist Episcopal Chapel (D) , Girard African Methodist Episcopal Chapel (E) , Allen African Methodist Episcopal Temple (F) , Auburn Heights Baptist Church (G) , Baptist Center Church (H) , Bethany Congregational Church (I) . Display/hide their locations on the map
Cemeteries: (1) , Felix Edwards Cemetery (2) , Zion Cemetery (3) , Pine Grove Cemetery (4) . Display/hide their locations on the map
Reservoirs: (A) , Wrights Lakes (B) , Moon Lake (C) , Kinnett Lake (D) , Asbury Park Lake (E) . Display/hide their locations on the map
Creeks: (A) , Holland Creek (B) . Display/hide their locations on the map
Parks in Phenix City include: (1) , Girard Historic District (2) , Kid Alley Residential Historic District (3) , Lower Twentieth Street Residential Historic District (4) , Smith Residential Historic District (5) , Snow Valley Residential Historic District (6) , Upper Twentieth Street Residential Historic District (7) , Lakeview Park (8) , Fontaine Park (9) . Display/hide their locations on the map
Tourist attractions: (1) , Skatearama (Amusement & Theme Parks; 280 By-Pass) (2) . Display/hide their approximate locations on the map
Hotels: (1) , Ramada Limited (Highway 280) (2) , Bamboo Motel (3104 Opelika Road) (3) , Howard Johnson Express (1600 East 280 Bypass) (4) , Center City Motel (1901 Opelika Road) (5) , Colonial Inn (905 280 Bypass) (6) , Crawford Motor Inn (4521 US Highway 80 West) (7) , Ramada Limited Phenix City (3560 Us Highway 280 Hwy 280 & 431 North) (8) , Holiday Inn Express (1700 East 280 Bypass) (9) . Display/hide their approximate locations on the map
Courts: (1) , Phenix City - Utilities- Municipal Court Clerk- Dispatch (1119 Broad Street) (2) , Russell County Court Referral (1206 Broad Street) (3) , Phenix City - Accounting- Municipal Court Clerk- Building Inspections (1119 Broad Street) (4) . Display/hide their approximate locations on the map
Birthplace of: Harvey Glance - Athletics competitor, Joe Meriweather - Basketball player-coach, Rufus Stokes - Inventor, Triandos Luke - 2005 NFL player (Denver Broncos, born : Dec 24, 1981), Billy Jackson (American football) - Football player, Clarence Sanders - College basketball player (Mississippi Rebels), David Ray (American football) - Football player, Herm Lee - Football player, James Joseph (American football) - Football player, Skeeter Newsome - Major League Baseball shortstop.
Russell County has a predicted average indoor radon screening level between 2 and 4 pCi/L (pico curies per liter) - Moderate Potential Drinking water stations with addresses in Phenix City and their reported violations in the past:
PHENIX CITY UTILITIES (Address: 1119 BROAD STREET Population served: 35,358, Surface water):
Past health violations:
MCL, Average - Between APR-2013 and JUN-2013, Contaminant: TTHM. Follow-up actions: St Public Notif requested (JUL-12-2013), St Violation/Reminder Notice (JUL-12-2013), St Compliance achieved (AUG-12-2013), St Public Notif received (AUG-21-2013)
MCL, Average - Between JAN-2013 and MAR-2013, Contaminant: TTHM. Follow-up actions: St Public Notif requested (APR-18-2013), St Violation/Reminder Notice (APR-18-2013), St Public Notif received (MAY-30-2013), St Compliance achieved (AUG-12-2013)
MCL, Average - Between OCT-2012 and DEC-2012, Contaminant: TTHM. Follow-up actions: St Public Notif requested (FEB-06-2013), St Violation/Reminder Notice (FEB-06-2013), St Public Notif received (APR-26-2013), St Compliance achieved (AUG-12-2013)
Past monitoring violations:
31 regular monitoring violations
Population served: 11,538, Purch surface water):
Past monitoring violations:
Follow-up Or Routine LCR Tap M/R - In OCT-11-2007, Contaminant: Lead and Copper Rule. Follow-up actions: St Compliance achieved (JUL-16-2009)
One minor monitoring violation
Average household size: This city:
2.4 peopleAlabama:
2.5 people
Percentage of family households: This city:
65.1%Whole state:
67.8%
Percentage of households with unmarried partners: This city:
5.6%Whole state:
4.7%
Likely homosexual households (counted as self-reported same-sex unmarried-partner households)
Lesbian couples: 0.2% of all households Gay men: 0.3% of all households
People in group quarters in Phenix City in 2010:
291 people in local jails and other municipal confinement facilities
203 people in nursing facilities/skilled-nursing facilities
47 people in emergency and transitional shelters (with sleeping facilities) for people experiencing homelessness
11 people in group homes intended for adults
5 people in other noninstitutional facilities
People in group quarters in Phenix City in 2000:
314 people in nursing homes
295 people in local jails and other confinement facilities (including police lockups)
46 people in other noninstitutional group quarters
10 people in homes for the mentally retarded
5 people in homes or halfway houses for drug/alcohol abuse
3 people in homes for the physically handicapped
Banks with branches in Phenix City (2011 data):
Phenix-Girard Bank: Stadium Drive Branch, Phenix Park Branch, at 8th Avenue And 13th Street, Highway 280 Branch. Info updated 2006/11/03: Bank assets: $150.4 mil, Deposits: $109.4 mil, local headquarters , positive income , Commercial Lending Specialization, 5 total offices , Holding Company: Phenix-Girard Bancshares, Inc.
Synovus Bank: Stadium Drive Branch, Phenix City Branch, North Banking Center. Info updated 2011/01/25: Bank assets: $26,863.3 mil, Deposits: $22,415.0 mil, headquarters in Columbus, GA, positive income , Commercial Lending Specialization, 296 total offices , Holding Company: Synovus Financial Corp.
Regions Bank: Broad Street Branch at 1200 Broad Street, branch established on 1963/01/23; 280 North Branch at 3548 280/431 Bypass, branch established on 1999/05/30. Info updated 2011/02/24: Bank assets: $123,368.2 mil, Deposits: $98,301.3 mil, headquarters in Birmingham, AL, positive income , Commercial Lending Specialization, 1778 total offices , Holding Company: Regions Financial Corporation
Wells Fargo Bank, National Association: 280 Bypass Branch at 1014 U.S. Highway 280 By-Pass, branch established on 1996/10/15; Thirteenth Street Phenix City Branch at 616 13th Street, branch established on 1989/11/20. Info updated 2011/04/05: Bank assets: $1,161,490.0 mil, Deposits: $905,653.0 mil, headquarters in Sioux Falls, SD, positive income , 6395 total offices , Holding Company: Wells Fargo & Company
Branch Banking and Trust Company: 280 Bypass Branch at 1200 280 Bypass, branch established on 1934/01/01; Phenix City Branch at 1201 Broad Street, branch established on 1992/07/24. Info updated 2010/03/29: Bank assets: $168,867.6 mil, Deposits: $127,549.5 mil, headquarters in Winston Salem, NC, positive income , Commercial Lending Specialization, 1793 total offices , Holding Company: Bb&T Corporation
AuburnBank: Phenix City Branch at 3700 U.S. Hwy 431 N, branch established on 1998/08/09. Info updated 2006/11/03: Bank assets: $776.8 mil, Deposits: $620.9 mil, headquarters in Auburn, AL, positive income , Commercial Lending Specialization, 10 total offices , Holding Company: Auburn National Bancorporation, Inc.
For population 15 years and over in Phenix City:
Never married: 33.9%Now married: 45.2%Separated: 3.9%Widowed: 4.0%Divorced: 12.9% For population 25 years and over in Phenix City:
High school or higher: 87.8%Bachelor's degree or higher: 21.2%Graduate or professional degree: 8.7%Unemployed: 6.5%Mean travel time to work (commute): 19.0 minutes
Education Gini index (Inequality in education) Here:
10.8Alabama average:
11.5
Religion statistics for Phenix City, AL (based on Russell County data)
Religion Adherents Congregations Evangelical Protestant 23,650 74 Black Protestant 8,303 38 Mainline Protestant 2,444 14 Catholic 1,595 4 Other 798 3 None 16,157 -
Source: Clifford Grammich, Kirk Hadaway, Richard Houseal, Dale E.Jones, Alexei Krindatch, Richie Stanley and Richard H.Taylor. 2012. 2010 U.S.Religion Census: Religious Congregations & Membership Study. Association of Statisticians of American Religious Bodies. Jones, Dale E., et al. 2002. Congregations and Membership in the United States 2000. Nashville, TN: Glenmary Research Center. Graphs represent county-level data
Food Environment Statistics: Number of grocery stores : 13This county :
2.59 / 10,000 pop.State :
1.89 / 10,000 pop.
Number of supercenters and club stores : 1This county :
0.20 / 10,000 pop.Alabama :
0.20 / 10,000 pop.
Number of convenience stores (no gas) : 2This county :
0.40 / 10,000 pop.Alabama :
0.65 / 10,000 pop.
Number of convenience stores (with gas) : 37Here :
7.37 / 10,000 pop.Alabama :
6.32 / 10,000 pop.
Number of full-service restaurants : 24Russell County :
4.78 / 10,000 pop.State :
5.75 / 10,000 pop.
Adult diabetes rate : Russell County :
12.9%State :
11.8%
Adult obesity rate : Russell County :
34.8%Alabama :
31.7%
Low-income preschool obesity rate : Russell County :
11.2%State :
13.5%
Health and Nutrition:
Average overall health of teeth and gums : People feeling badly about themselves : This city:
19.9%Alabama:
20.7%
People not drinking alcohol at all : This city:
11.4%Alabama:
11.0%
Average hours sleeping at night : Phenix City:
6.7Alabama:
6.8
Overweight people : This city:
34.9%State:
34.4%
General health condition : Average condition of hearing : More about Health and Nutrition of Phenix City, AL Residents
Phenix City government finances - Expenditure in 2021 (per resident):
Current Operations - General - Other: $8,681,000 ($226.85)
Police Protection: $6,727,000 ($175.79)Local Fire Protection: $4,896,000 ($127.94)Water Utilities: $4,725,000 ($123.47)Parks and Recreation: $4,473,000 ($116.89)Sewerage: $2,723,000 ($71.16)Solid Waste Management: $2,533,000 ($66.19)Regular Highways: $1,399,000 ($36.56)Central Staff Services: $1,051,000 ($27.46)Protective Inspection and Regulation - Other: $895,000 ($23.39)Financial Administration: $685,000 ($17.90)Judicial and Legal Services: $387,000 ($10.11)Libraries: $378,000 ($9.88)Housing and Community Development: $1,000 ($0.03)General - Interest on Debt: $1,928,000 ($50.38)
Intergovernmental to Local - Other - Corrections: $49,000 ($1.28)
Other - Health - Other: $34,000 ($0.89)Other - Public Welfare - Other: $26,000 ($0.68)Other - Natural Resources - Other: $14,000 ($0.37)Other - Parks and Recreation: $14,000 ($0.37)Other Capital Outlay - Solid Waste Management: $326,000 ($8.52)
Police Protection: $258,000 ($6.74)General - Other: $181,000 ($4.73)Local Fire Protection: $143,000 ($3.74)Parks and Recreation: $97,000 ($2.53)Regular Highways: $57,000 ($1.49)Protective Inspection and Regulation - Other: $34,000 ($0.89)Libraries: $17,000 ($0.44)Judicial and Legal Services: $2,000 ($0.05)Water Utilities: $2,000 ($0.05)Financial Administration: $1,000 ($0.03)Water Utilities - Interest on Debt: $1,830,000 ($47.82)
Phenix City government finances - Revenue in 2021 (per resident):
Charges - Sewerage: $5,207,000 ($136.07)
Solid Waste Management: $2,710,000 ($70.82)Parks and Recreation: $1,142,000 ($29.84)Other: $344,000 ($8.99)Parking Facilities: $7,000 ($0.18)Miscellaneous - Fines and Forfeits: $693,000 ($18.11)
Interest Earnings: $279,000 ($7.29)General Revenue - Other: $255,000 ($6.66)Rents: $80,000 ($2.09)Donations From Private Sources: $19,000 ($0.50)Revenue - Water Utilities: $6,700,000 ($175.09)
State Intergovernmental - Other: $3,423,000 ($89.45)
General Local Government Support: $341,000 ($8.91)Tax - General Sales and Gross Receipts: $23,053,000 ($602.43)
Property: $11,055,000 ($288.89)Other License: $5,181,000 ($135.39)Motor Fuels Sales: $1,064,000 ($27.80)Alcoholic Beverage Sales: $648,000 ($16.93)Tobacco Products Sales: $126,000 ($3.29)Motor Vehicle License: $105,000 ($2.74)
Phenix City government finances - Debt in 2021 (per resident):
Long Term Debt - Beginning Outstanding - Unspecified Public Purpose: $117,057,000 ($3058.95)
Outstanding Unspecified Public Purpose: $111,896,000 ($2924.09)Retired Unspecified Public Purpose: $5,161,000 ($134.87)Beginning Outstanding - Public Debt for Private Purpose: $3,522,000 ($92.04)Outstanding Nonguaranteed - Industrial Revenue: $3,288,000 ($85.92)Retired Nonguaranteed - Public Debt for Private Purpose: $234,000 ($6.11)
Phenix City government finances - Cash and Securities in 2021 (per resident):
Other Funds - Cash and Securities: $9,794,000 ($255.94)
Sinking Funds - Cash and Securities: $3,521,000 ($92.01)
12.40% of this county's 2021 resident taxpayers lived in other counties in 2020 ($38,710 average adjusted gross income )
Here:
12.40%Alabama average:
6.87%
0.13% of residents moved from foreign countries ($560 average AGI )Russell County:
0.13%Alabama average:
0.02%
Top counties from which taxpayers relocated into this county between 2020 and 2021:
Businesses in Phenix City, AL
Name Count Name Count
Ace Hardware 1 Kmart 1 Advance Auto Parts 2 Lane Furniture 1 Applebee's 1 Little Caesars Pizza 2 Arby's 1 McDonald's 4 AutoZone 2 Nike 2 Burger King 2 Papa John's Pizza 2 CVS 2 Pizza Hut 1 Chick-Fil-A 1 Publix Super Markets 1 Church's Chicken 1 Quality 1 Circle K 3 RadioShack 1 Cricket Wireless 1 Ramada 1 Curves 1 Rodeway Inn 1 Days Inn 1 SONIC Drive-In 1 Domino's Pizza 1 Subway 3 FedEx 3 T-Mobile 2 Goodwill 2 Taco Bell 1 H&R Block 1 U-Haul 5 Hardee's 1 UPS 1 Hilton 1 Verizon Wireless 1 Holiday Inn 1 Waffle House 3 Home Depot 1 Walgreens 2 IHOP 1 Walmart 1 KFC 2
Strongest AM radio stations in Phenix City:
WEAM (1580 AM; 2 kW; COLUMBUS, GA; Owner: DAVIS BROADCASTING, INC. OF COLUMBUS)
WMLF (1270 AM; 5 kW; COLUMBUS, GA; Owner: CLEAR CHANNEL BROADCASTING LICENSES, INC.)
WRCG (1420 AM; 5 kW; COLUMBUS, GA; Owner: ABG GEORGIA, LLC)
WDAK (540 AM; 5 kW; COLUMBUS, GA; Owner: CLEAR CHANNEL BROADCASTING LICENSES, INC.)
WHAL (1460 AM; 4 kW; PHENIX CITY/COLUMBUS, AL; Owner: CLEAR CHANNEL BROADCASTING LICENSES, INC.)
WOKS (1340 AM; 1 kW; COLUMBUS, GA; Owner: DAVIS BROADCASTING, INC.)
WGST (640 AM; 50 kW; ATLANTA, GA; Owner: CITICASTERS LICENSES, L.P.)
WMAC (940 AM; 50 kW; MACON, GA; Owner: CUMULUS LICENSING CORP.)
WGSE (720 AM; daytime; 8 kW; HOGANSVILLE, GA; Owner: CITICASTERS LICENSES, L.P.)
WKNG (1060 AM; daytime; 50 kW; TALLAPOOSA, GA; Owner: WKNG, INC.)
WSB (750 AM; 50 kW; ATLANTA, GA; Owner: CXR HOLDINGS, INC.)
WCNN (680 AM; 50 kW; NORTH ATLANTA, GA; Owner: DICKEY BROADCASTING COMPANY)
WNSI (810 AM; 50 kW; JACKSONVILLE, AL; Owner: UNITED BROADCASTING NETWORK, INC.)
Strongest FM radio stations in Phenix City:
WCGQ (107.3 FM; COLUMBUS, GA; Owner: ABG GEORGIA, LLC)
WFXE (104.9 FM; COLUMBUS, GA; Owner: DAVIS BROADCASTING)
WFRC (90.5 FM; COLUMBUS, GA; Owner: FAMILY STATIONS, INC.)
WGSY (100.1 FM; PHENIX CITY, AL; Owner: CLEAR CHANNEL BROADCASTING LICENSES, INC.)
WBFA (101.3 FM; SMITHS, AL; Owner: CLEAR CHANNEL BROADCASTING LICENSES, INC.)
WAGH (98.3 FM; FORT MITCHELL, AL; Owner: CLEAR CHANNEL BROADCASTING LICENSES, INC.)
W293AD (106.5 FM; COLUMBUS, GA; Owner: CLEAR CHANNEL BROADCASTING LICENSES, INC.)
WVFJ-FM (93.3 FM; MANCHESTER, GA; Owner: PROVIDENT BROADCASTING COMPANY)
WYFK (89.5 FM; COLUMBUS, GA; Owner: BIBLE BROADCASTING NETWORK, INC.)
WMXA (96.7 FM; OPELIKA, AL; Owner: QANTUM OF AUBURN LICENSE COMPANY, LLC)
WSTH-FM (106.1 FM; ALEXANDER CITY, AL; Owner: CLEAR CHANNEL BROADCASTING LICENSES, INC.)
WJSP-FM (88.1 FM; WARM SPRINGS, GA; Owner: GEORGIA PUBLIC TELECOMMUNICATIONS COMMISSION)
WKZJ (95.7 FM; GREENVILLE, GA; Owner: DAVIS B/CASTING OF COLUMBUS, INC)
WKCN (99.3 FM; LUMPKIN, GA; Owner: ABG GEORGIA, LLC)
WEAM-FM (100.7 FM; BUENA VISTA, GA; Owner: DAVIS BROADCASTING INC., OF COLUMBUS)
WRLD-FM (95.3 FM; VALLEY, AL; Owner: ABG GEORGIA, LLC)
WTJB (91.7 FM; COLUMBUS, GA; Owner: TROY STATE UNIVERSITY)
WKKR (97.7 FM; AUBURN, AL; Owner: QANTUM OF AUBURN LICENSE COMPANY, LLC)
TV broadcast stations around Phenix City:
W06BH (Channel 6; PHENIX CITY, ETC., AL; Owner: GREENE COMMUNICATIONS, INC.)
WCGT-LP (Channel 16; COLUMBUS, GA; Owner: COLUMBUS TELEVISION, INC.)
WLTZ (Channel 38; COLUMBUS, GA; Owner: LEWIS BROADCASTING CORPORATION)
W55CR (Channel 55; ATLANTA, GA; Owner: WORD OF GOD FELLOWSHIP, INC.)
WXTX (Channel 54; COLUMBUS, GA; Owner: FISHER BROADCASTING - GEORGIA, L.L.C.)
WTVM (Channel 9; COLUMBUS, GA; Owner: RAYCOM AMERICA, INC.)
WRBL (Channel 3; COLUMBUS, GA; Owner: MEDIA GENERAL BROADCASTING OF SO. CAROLINA HOLDINGS, INC.)
WSWS-TV (Channel 66; OPELIKA, AL; Owner: PAPPAS TELECASTING OF OPELIKA)
WJSP-TV (Channel 28; COLUMBUS, GA; Owner: GEORGIA PUBLIC TELECOMMUNICATIONS COMMISSION)
WACS-TV (Channel 25; DAWSON, GA; Owner: GEORGIA PUBLIC TELECOMMUNICATIONS COMMISSION)
National Bridge Inventory (NBI) Statistics 88 Number of bridges1,358ft / 414m Total length $167,952,000 Total costs813,451 Total average daily traffic66,645 Total average daily truck traffic
New bridges - historical statistics
2 1920-1929 5 1930-1939 4 1940-1949 3 1950-1959 20 1960-1969 1 1970-1979 24 1980-1989 9 1990-1999 14 2000-2009 4 2010-2019 2 2020-2022
See full National Bridge Inventory statistics for Phenix City, AL
Home Mortgage Disclosure Act Aggregated Statistics For Year 2009(Based on 3 full and 8 partial tracts) A) FHA, FSA/RHS & VA B) Conventional C) Refinancings D) Home Improvement Loans E) Loans on Dwellings For 5+ Families F) Non-occupant Loans on G) Loans On Manufactured Number Average Value Number Average Value Number Average Value Number Average Value Number Average Value Number Average Value Number Average Value
LOANS ORIGINATED 150 $146,115 55 $106,867 263 $126,696 36 $31,372 3 $738,760 72 $79,430 3 $42,513 APPLICATIONS APPROVED, NOT ACCEPTED 5 $144,374 2 $180,585 27 $107,993 5 $22,050 0 $0 3 $72,630 2 $40,875 APPLICATIONS DENIED 21 $137,140 8 $70,888 134 $118,002 25 $36,845 0 $0 18 $67,219 2 $88,910 APPLICATIONS WITHDRAWN 20 $139,593 6 $116,208 106 $135,717 6 $41,128 0 $0 7 $109,743 0 $0 FILES CLOSED FOR INCOMPLETENESS 3 $152,537 2 $93,840 22 $125,562 2 $67,420 0 $0 4 $68,345 1 $14,440
Aggregated Statistics For Year 2008(Based on 3 full and 8 partial tracts) A) FHA, FSA/RHS & VA B) Conventional C) Refinancings D) Home Improvement Loans E) Loans on Dwellings For 5+ Families F) Non-occupant Loans on G) Loans On Manufactured Number Average Value Number Average Value Number Average Value Number Average Value Number Average Value Number Average Value Number Average Value
LOANS ORIGINATED 128 $128,023 93 $104,985 219 $118,434 45 $38,734 2 $1,216,680 79 $89,564 4 $48,628 APPLICATIONS APPROVED, NOT ACCEPTED 8 $131,292 8 $92,201 38 $103,515 9 $23,683 0 $0 12 $72,271 2 $90,825 APPLICATIONS DENIED 13 $114,357 23 $112,897 188 $119,970 75 $48,215 1 $1,171,400 18 $78,392 6 $52,235 APPLICATIONS WITHDRAWN 11 $142,529 16 $125,198 90 $122,348 14 $78,646 0 $0 10 $64,684 0 $0 FILES CLOSED FOR INCOMPLETENESS 3 $80,377 5 $80,372 18 $119,246 2 $167,570 0 $0 1 $40,470 1 $36,000
Aggregated Statistics For Year 2007(Based on 3 full and 8 partial tracts) A) FHA, FSA/RHS & VA B) Conventional C) Refinancings D) Home Improvement Loans E) Loans on Dwellings For 5+ Families F) Non-occupant Loans on G) Loans On Manufactured Number Average Value Number Average Value Number Average Value Number Average Value Number Average Value Number Average Value Number Average Value
LOANS ORIGINATED 95 $130,341 249 $111,027 318 $102,193 71 $37,442 3 $2,317,337 154 $78,577 6 $45,590 APPLICATIONS APPROVED, NOT ACCEPTED 6 $103,258 27 $96,924 63 $101,996 8 $55,979 0 $0 12 $102,597 1 $77,060 APPLICATIONS DENIED 17 $114,120 54 $111,263 226 $104,868 82 $38,508 1 $100,000 29 $87,632 6 $56,163 APPLICATIONS WITHDRAWN 5 $105,748 28 $111,862 101 $97,717 19 $60,433 0 $0 19 $82,863 3 $50,627 FILES CLOSED FOR INCOMPLETENESS 2 $138,580 4 $136,932 20 $123,024 6 $84,023 0 $0 1 $55,230 0 $0
Aggregated Statistics For Year 2006(Based on 3 full and 8 partial tracts) A) FHA, FSA/RHS & VA B) Conventional C) Refinancings D) Home Improvement Loans E) Loans on Dwellings For 5+ Families F) Non-occupant Loans on G) Loans On Manufactured Number Average Value Number Average Value Number Average Value Number Average Value Number Average Value Number Average Value Number Average Value
LOANS ORIGINATED 154 $127,763 385 $93,377 361 $90,775 76 $30,171 2 $1,059,535 206 $72,748 5 $57,070 APPLICATIONS APPROVED, NOT ACCEPTED 3 $186,650 37 $88,851 77 $89,486 17 $28,339 0 $0 13 $49,655 4 $49,062 APPLICATIONS DENIED 10 $106,734 77 $85,303 272 $89,277 112 $33,491 0 $0 23 $58,074 6 $55,807 APPLICATIONS WITHDRAWN 5 $107,864 33 $88,915 136 $98,720 37 $48,155 0 $0 21 $56,231 0 $0 FILES CLOSED FOR INCOMPLETENESS 4 $96,112 12 $85,039 48 $98,340 2 $41,185 0 $0 3 $60,063 1 $32,850
Aggregated Statistics For Year 2005(Based on 3 full and 8 partial tracts) A) FHA, FSA/RHS & VA B) Conventional C) Refinancings D) Home Improvement Loans E) Loans on Dwellings For 5+ Families F) Non-occupant Loans on G) Loans On Manufactured Number Average Value Number Average Value Number Average Value Number Average Value Number Average Value Number Average Value Number Average Value
LOANS ORIGINATED 96 $121,501 359 $88,314 318 $91,939 81 $28,438 4 $2,402,105 141 $74,998 5 $52,862 APPLICATIONS APPROVED, NOT ACCEPTED 4 $104,538 49 $83,632 106 $80,194 11 $34,710 0 $0 18 $71,029 1 $60,620 APPLICATIONS DENIED 11 $90,106 77 $77,265 246 $96,622 123 $22,926 1 $3,676,850 39 $32,307 15 $45,096 APPLICATIONS WITHDRAWN 7 $101,040 50 $91,534 166 $98,798 34 $85,783 0 $0 32 $58,664 4 $52,430 FILES CLOSED FOR INCOMPLETENESS 1 $87,820 6 $76,590 29 $98,344 2 $57,345 0 $0 5 $75,216 0 $0
Aggregated Statistics For Year 2004(Based on 3 full and 8 partial tracts) A) FHA, FSA/RHS & VA B) Conventional C) Refinancings D) Home Improvement Loans E) Loans on Dwellings For 5+ Families F) Non-occupant Loans on G) Loans On Manufactured Number Average Value Number Average Value Number Average Value Number Average Value Number Average Value Number Average Value Number Average Value
LOANS ORIGINATED 111 $110,608 293 $89,535 341 $92,359 62 $19,392 4 $1,362,380 130 $72,374 8 $42,894 APPLICATIONS APPROVED, NOT ACCEPTED 5 $141,110 32 $88,728 122 $79,105 6 $30,873 0 $0 15 $74,853 2 $38,885 APPLICATIONS DENIED 14 $103,614 65 $85,111 243 $82,933 79 $28,069 1 $1,200,000 22 $80,204 8 $56,285 APPLICATIONS WITHDRAWN 16 $101,699 25 $101,159 121 $92,540 23 $51,782 0 $0 22 $78,638 1 $32,950 FILES CLOSED FOR INCOMPLETENESS 2 $89,940 14 $68,087 59 $100,045 3 $38,300 0 $0 7 $67,746 0 $0
Aggregated Statistics For Year 2003(Based on 3 full and 8 partial tracts) A) FHA, FSA/RHS & VA B) Conventional C) Refinancings D) Home Improvement Loans E) Loans on Dwellings For 5+ Families F) Non-occupant Loans on Number Average Value Number Average Value Number Average Value Number Average Value Number Average Value Number Average Value
LOANS ORIGINATED 110 $101,795 217 $89,940 555 $88,698 51 $23,269 3 $4,146,677 124 $87,315 APPLICATIONS APPROVED, NOT ACCEPTED 5 $109,804 31 $68,114 102 $80,036 6 $15,338 0 $0 6 $52,457 APPLICATIONS DENIED 15 $95,777 68 $66,289 265 $79,327 44 $20,887 2 $316,360 34 $63,300 APPLICATIONS WITHDRAWN 18 $85,261 18 $84,324 103 $86,462 5 $37,210 0 $0 7 $73,711 FILES CLOSED FOR INCOMPLETENESS 2 $76,100 12 $84,862 32 $82,225 3 $26,780 0 $0 3 $77,493
Aggregated Statistics For Year 2002(Based on 3 full and 6 partial tracts) A) FHA, FSA/RHS & VA B) Conventional C) Refinancings D) Home Improvement Loans E) Loans on Dwellings For 5+ Families F) Non-occupant Loans on Number Average Value Number Average Value Number Average Value Number Average Value Number Average Value Number Average Value
LOANS ORIGINATED 121 $92,616 114 $68,994 343 $78,757 49 $14,398 5 $352,880 91 $57,727 APPLICATIONS APPROVED, NOT ACCEPTED 2 $76,280 15 $47,093 81 $65,823 6 $17,987 0 $0 3 $73,763 APPLICATIONS DENIED 8 $77,334 61 $52,972 188 $64,322 36 $19,066 0 $0 20 $55,357 APPLICATIONS WITHDRAWN 12 $79,840 16 $92,059 97 $74,249 3 $9,143 0 $0 7 $68,434 FILES CLOSED FOR INCOMPLETENESS 0 $0 11 $68,126 33 $81,812 0 $0 0 $0 7 $76,639
Aggregated Statistics For Year 2001(Based on 3 full and 6 partial tracts) A) FHA, FSA/RHS & VA B) Conventional C) Refinancings D) Home Improvement Loans E) Loans on Dwellings For 5+ Families F) Non-occupant Loans on Number Average Value Number Average Value Number Average Value Number Average Value Number Average Value Number Average Value
LOANS ORIGINATED 87 $86,106 102 $67,816 278 $74,171 66 $12,402 2 $612,670 84 $65,823 APPLICATIONS APPROVED, NOT ACCEPTED 2 $60,155 25 $56,294 46 $70,713 8 $26,930 0 $0 6 $103,742 APPLICATIONS DENIED 2 $104,235 91 $49,557 194 $64,169 53 $20,805 0 $0 18 $45,828 APPLICATIONS WITHDRAWN 6 $97,117 16 $64,366 78 $62,606 5 $19,532 3 $1,168,503 12 $55,193 FILES CLOSED FOR INCOMPLETENESS 1 $79,000 5 $102,118 19 $57,568 2 $14,245 0 $0 0 $0
Aggregated Statistics For Year 2000(Based on 3 full and 6 partial tracts) A) FHA, FSA/RHS & VA B) Conventional C) Refinancings D) Home Improvement Loans E) Loans on Dwellings For 5+ Families F) Non-occupant Loans on Number Average Value Number Average Value Number Average Value Number Average Value Number Average Value Number Average Value
LOANS ORIGINATED 78 $84,039 127 $60,341 131 $58,837 62 $13,152 1 $68,920 57 $47,700 APPLICATIONS APPROVED, NOT ACCEPTED 6 $59,303 39 $46,364 37 $43,513 10 $27,079 0 $0 4 $38,500 APPLICATIONS DENIED 10 $60,856 148 $44,328 157 $54,680 39 $13,392 0 $0 14 $59,332 APPLICATIONS WITHDRAWN 18 $78,508 17 $53,868 53 $54,998 5 $16,934 0 $0 3 $54,220 FILES CLOSED FOR INCOMPLETENESS 1 $166,880 4 $81,212 18 $52,593 0 $0 0 $0 3 $21,383
Aggregated Statistics For Year 1999(Based on 4 full and 6 partial tracts) A) FHA, FSA/RHS & VA B) Conventional C) Refinancings D) Home Improvement Loans E) Loans on Dwellings For 5+ Families F) Non-occupant Loans on Number Average Value Number Average Value Number Average Value Number Average Value Number Average Value Number Average Value
LOANS ORIGINATED 64 $80,541 179 $52,765 204 $59,964 66 $11,841 4 $433,570 60 $37,480 APPLICATIONS APPROVED, NOT ACCEPTED 1 $88,050 58 $54,063 32 $48,892 24 $13,833 0 $0 10 $54,919 APPLICATIONS DENIED 13 $76,732 254 $44,246 150 $56,511 74 $13,294 1 $424,550 13 $29,333 APPLICATIONS WITHDRAWN 10 $94,244 25 $57,607 76 $57,392 3 $37,387 0 $0 5 $27,208 FILES CLOSED FOR INCOMPLETENESS 1 $59,440 4 $47,638 19 $60,387 0 $0 0 $0 2 $58,035
Detailed mortgage data for all 11 tracts in Phenix City, AL
Private Mortgage Insurance Companies Aggregated Statistics For Year 2009(Based on 2 full and 7 partial tracts) A) Conventional B) Refinancings Number Average Value Number Average Value
LOANS ORIGINATED 5 $164,206 7 $158,644 APPLICATIONS APPROVED, NOT ACCEPTED 2 $131,480 3 $156,513 APPLICATIONS DENIED 0 $0 5 $134,598 APPLICATIONS WITHDRAWN 0 $0 1 $74,300 FILES CLOSED FOR INCOMPLETENESS 0 $0 0 $0
Aggregated Statistics For Year 2008(Based on 3 full and 8 partial tracts) A) Conventional B) Refinancings C) Non-occupant Loans on D) Loans On Manufactured Number Average Value Number Average Value Number Average Value Number Average Value
LOANS ORIGINATED 33 $129,761 15 $138,485 9 $74,841 1 $50,280 APPLICATIONS APPROVED, NOT ACCEPTED 11 $127,571 6 $114,415 2 $89,890 0 $0 APPLICATIONS DENIED 5 $104,104 2 $169,070 4 $94,365 0 $0 APPLICATIONS WITHDRAWN 1 $181,890 2 $130,545 0 $0 0 $0 FILES CLOSED FOR INCOMPLETENESS 0 $0 1 $147,920 0 $0 0 $0
Aggregated Statistics For Year 2007(Based on 3 full and 8 partial tracts) A) Conventional B) Refinancings C) Non-occupant Loans on Number Average Value Number Average Value Number Average Value
LOANS ORIGINATED 101 $117,174 40 $137,498 19 $76,496 APPLICATIONS APPROVED, NOT ACCEPTED 9 $81,256 5 $122,490 3 $77,493 APPLICATIONS DENIED 3 $127,380 4 $50,478 2 $71,085 APPLICATIONS WITHDRAWN 2 $176,645 1 $183,750 0 $0 FILES CLOSED FOR INCOMPLETENESS 0 $0 0 $0 0 $0
Aggregated Statistics For Year 2006(Based on 3 full and 8 partial tracts) A) Conventional B) Refinancings C) Non-occupant Loans on Number Average Value Number Average Value Number Average Value
LOANS ORIGINATED 83 $113,211 20 $110,032 15 $70,246 APPLICATIONS APPROVED, NOT ACCEPTED 5 $101,570 5 $94,404 0 $0 APPLICATIONS DENIED 2 $25,110 0 $0 0 $0 APPLICATIONS WITHDRAWN 2 $112,550 2 $128,450 0 $0 FILES CLOSED FOR INCOMPLETENESS 1 $82,560 0 $0 0 $0
Aggregated Statistics For Year 2005(Based on 3 full and 8 partial tracts) A) Conventional B) Refinancings C) Non-occupant Loans on Number Average Value Number Average Value Number Average Value
LOANS ORIGINATED 62 $107,134 29 $115,907 11 $74,284 APPLICATIONS APPROVED, NOT ACCEPTED 6 $100,647 4 $127,420 1 $73,900 APPLICATIONS DENIED 0 $0 0 $0 0 $0 APPLICATIONS WITHDRAWN 3 $83,863 3 $71,167 3 $76,367 FILES CLOSED FOR INCOMPLETENESS 2 $72,315 0 $0 2 $72,315
Aggregated Statistics For Year 2004(Based on 3 full and 8 partial tracts) A) Conventional B) Refinancings C) Non-occupant Loans on Number Average Value Number Average Value Number Average Value
LOANS ORIGINATED 73 $97,690 40 $96,558 23 $72,288 APPLICATIONS APPROVED, NOT ACCEPTED 5 $100,086 11 $103,315 3 $79,437 APPLICATIONS DENIED 1 $41,000 0 $0 1 $41,000 APPLICATIONS WITHDRAWN 0 $0 4 $111,342 1 $60,250 FILES CLOSED FOR INCOMPLETENESS 0 $0 0 $0 0 $0
Aggregated Statistics For Year 2003(Based on 3 full and 8 partial tracts) A) Conventional B) Refinancings C) Non-occupant Loans on Number Average Value Number Average Value Number Average Value
LOANS ORIGINATED 58 $95,333 102 $97,479 17 $57,764 APPLICATIONS APPROVED, NOT ACCEPTED 3 $97,943 9 $122,584 0 $0 APPLICATIONS DENIED 1 $58,660 0 $0 0 $0 APPLICATIONS WITHDRAWN 1 $61,390 11 $105,470 1 $73,970 FILES CLOSED FOR INCOMPLETENESS 0 $0 1 $42,230 1 $42,230
Aggregated Statistics For Year 2002(Based on 3 full and 6 partial tracts) A) Conventional B) Refinancings C) Non-occupant Loans on Number Average Value Number Average Value Number Average Value
LOANS ORIGINATED 38 $86,871 58 $93,920 9 $65,853 APPLICATIONS APPROVED, NOT ACCEPTED 4 $65,980 11 $70,835 3 $42,790 APPLICATIONS DENIED 0 $0 0 $0 0 $0 APPLICATIONS WITHDRAWN 0 $0 1 $194,880 0 $0 FILES CLOSED FOR INCOMPLETENESS 0 $0 0 $0 0 $0
Aggregated Statistics For Year 2001(Based on 3 full and 6 partial tracts) A) Conventional B) Refinancings C) Non-occupant Loans on Number Average Value Number Average Value Number Average Value
LOANS ORIGINATED 23 $85,699 41 $88,510 4 $82,248 APPLICATIONS APPROVED, NOT ACCEPTED 4 $87,815 3 $66,503 2 $89,080 APPLICATIONS DENIED 2 $129,000 0 $0 0 $0 APPLICATIONS WITHDRAWN 1 $30,790 0 $0 0 $0 FILES CLOSED FOR INCOMPLETENESS 0 $0 0 $0 0 $0
Aggregated Statistics For Year 2000(Based on 3 full and 6 partial tracts) A) Conventional B) Refinancings C) Non-occupant Loans on Number Average Value Number Average Value Number Average Value
LOANS ORIGINATED 36 $81,310 7 $91,939 11 $66,794 APPLICATIONS APPROVED, NOT ACCEPTED 5 $75,358 0 $0 0 $0 APPLICATIONS DENIED 2 $100,910 0 $0 1 $59,970 APPLICATIONS WITHDRAWN 3 $85,397 0 $0 0 $0 FILES CLOSED FOR INCOMPLETENESS 0 $0 0 $0 0 $0
Aggregated Statistics For Year 1999(Based on 4 full and 6 partial tracts) A) Conventional B) Refinancings C) Non-occupant Loans on Number Average Value Number Average Value Number Average Value
LOANS ORIGINATED 35 $90,717 35 $72,702 3 $35,997 APPLICATIONS APPROVED, NOT ACCEPTED 3 $121,280 4 $63,775 1 $21,610 APPLICATIONS DENIED 0 $0 2 $74,485 0 $0 APPLICATIONS WITHDRAWN 2 $72,945 0 $0 0 $0 FILES CLOSED FOR INCOMPLETENESS 0 $0 0 $0 0 $0
Fire-safe hotels and motels in Phenix City, Alabama:
Sunset Lodge, 1506 280 Byp, Phenix City, Alabama 36867 Phone: (334) 298-5255, Fax: (334) 291-0571
Red Roof Inn, 1700 US 280 Byp, Phenix City, Alabama 36867 Phone: (334) 298-9321, Fax: (334) 297-3958
Colonial Inn, 905 E 280 Byp, Phenix City, Alabama 36867 Phone: (334) 298-9361, Fax: (334) 297-8753
Rodeway Inn, 1600 Hwy 280 Byp, Phenix City, Alabama 36867 Phone: (334) 298-8000, Fax: (334) 297-0009
Holiday Inn Express Hotel & Suites, 1702 US 280 Byp, Phenix City, Alabama 36867 Phone: (334) 298-9404
Hampton Inn & Suites, 620 Martin Luther King Jr Pkwy, Phenix City, Alabama 36869 Phone: (334) 664-0776, Fax: (334) 298-1057
Quality Inn Phenix City, 600 Hwy 431, Phenix City, Alabama 36867 Phone: (334) 298-1005, Fax: (334) 298-0155
Courtyard By Marriott Columbus Phenix City, 1400 Whitewater Ave, Phenix City, Alabama 36867 Phone: (334) 664-9840, Fax: (334) 664-9841
2 other hotels and motels
All 10 fire-safe hotels and motels in Phenix City, Alabama
Most common first names in Phenix City, AL among deceased individuals Name Count Lived (average)
James 485 70.2 years Mary 389 75.2 years William 365 71.8 years John 303 71.3 years Willie 281 73.1 years Robert 220 68.8 years Annie 206 76.4 years George 151 72.9 years Charles 150 68.9 years Henry 130 71.6 years
Most common last names in Phenix City, AL among deceased individuals Last name Count Lived (average)
Williams 234 72.3 years Jones 227 71.3 years Smith 209 71.6 years Davis 158 71.5 years Brown 147 73.0 years Thomas 144 70.9 years Johnson 128 71.7 years Jackson 122 73.8 years Phillips 77 74.1 years Taylor 71 71.4 years
Phenix City compared to Alabama state average:
Unemployed percentage below state average. Black race population percentage above state average. Median age significantly below state average. Foreign-born population percentage above state average. Renting percentage above state average. Length of stay since moving in significantly above state average.
Top Patent Applicants
John Belfance (9)
Toby Clark (3)
Charles E. Webb (2)
Stuart E. Webb (2)
Zach Miron (1)
Nathan Carr (1)
Kaleb T. Allen (1)
Gilbert Strickland (1)
Barbara Lynn Parker (1)
Gary W. Hellman (1)
Total of 29 patent applications in 2008-2024.
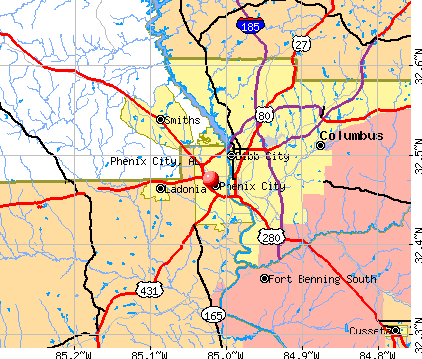


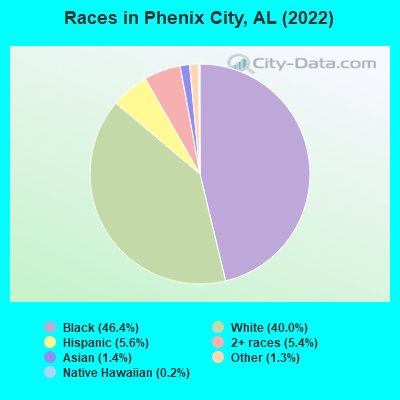
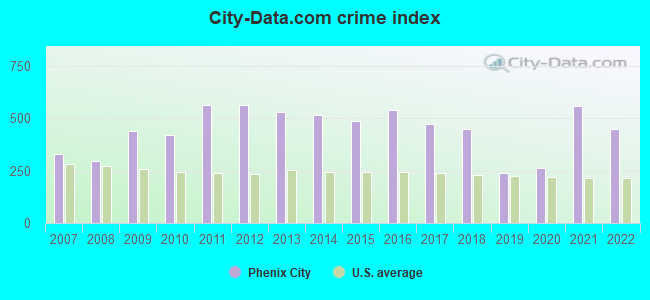
 Recent articles from our blog. Our writers, many of them Ph.D. graduates or candidates, create easy-to-read articles on a wide variety of topics.
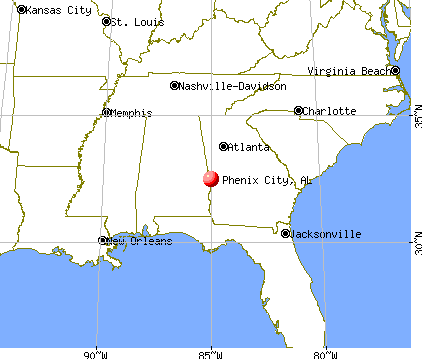
 (4.8 miles
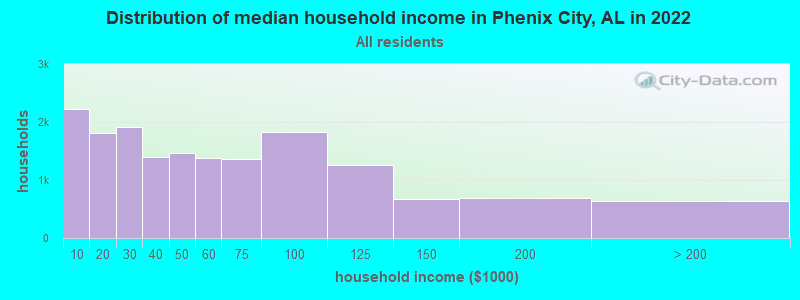
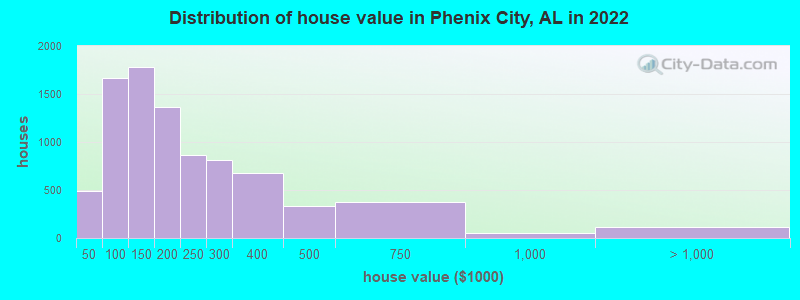

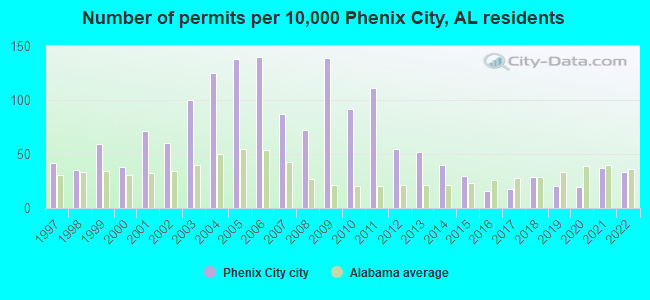
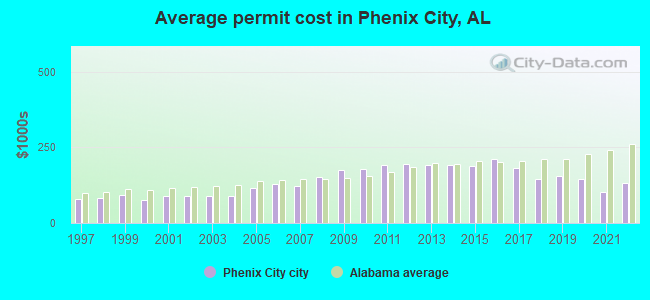
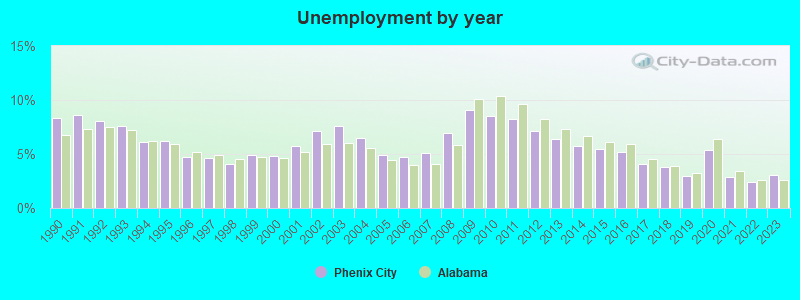
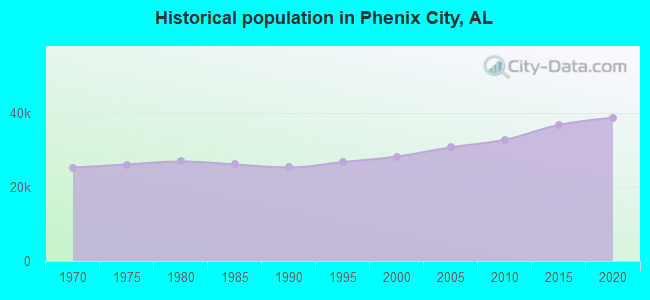
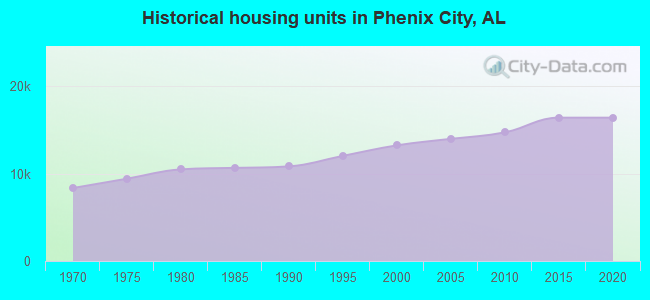
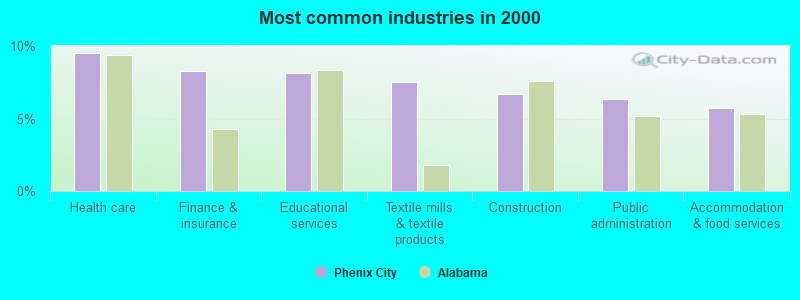
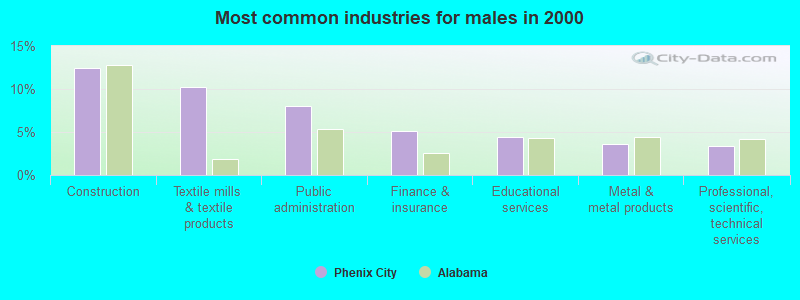
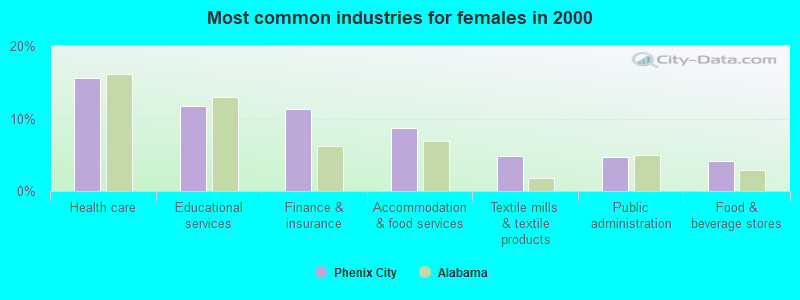
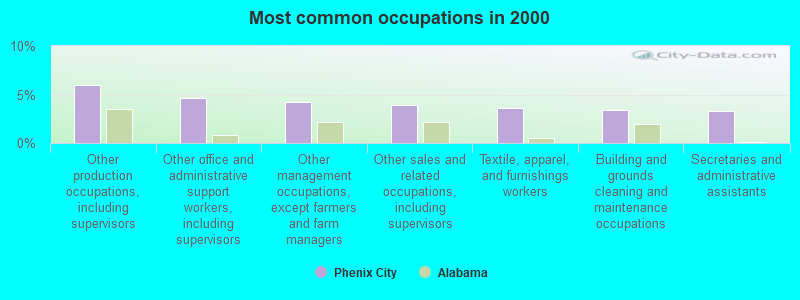
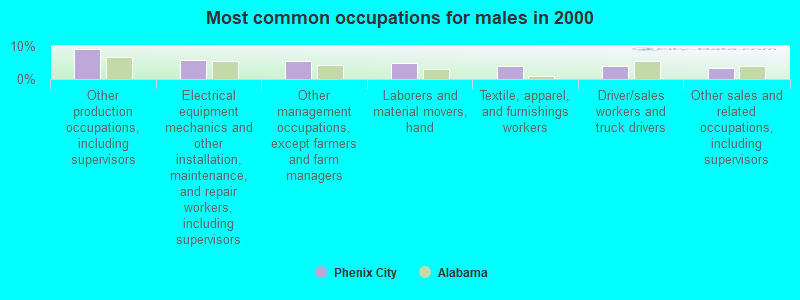
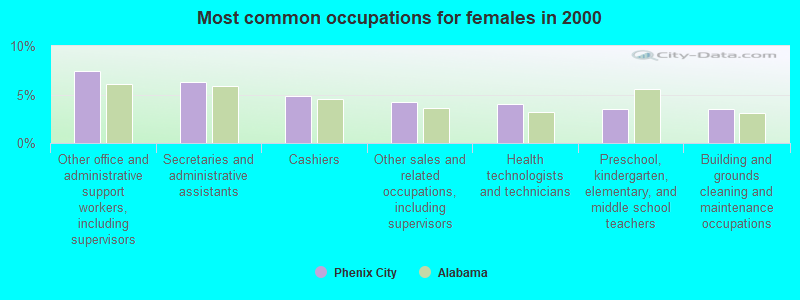


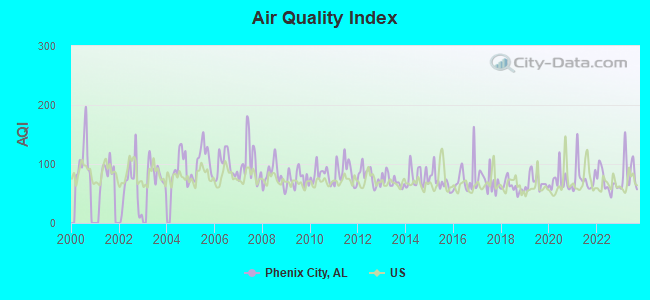
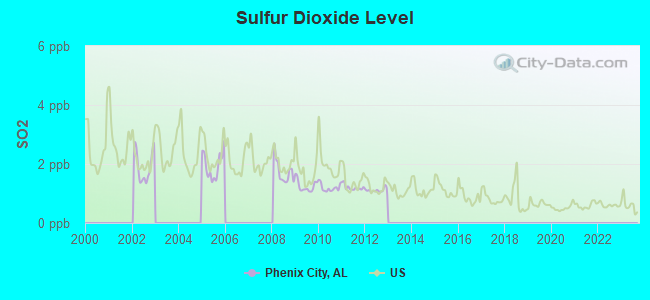
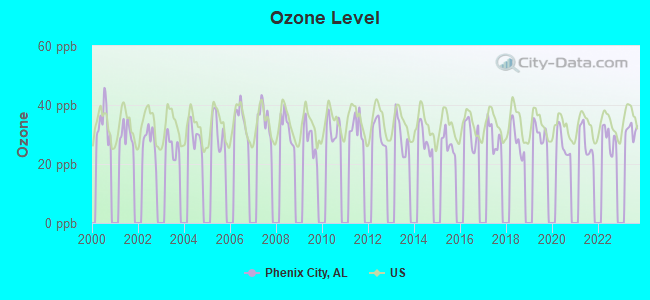
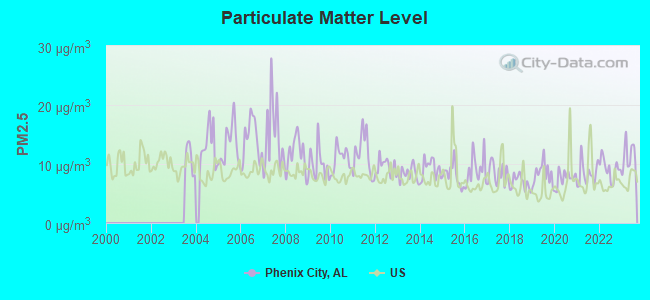
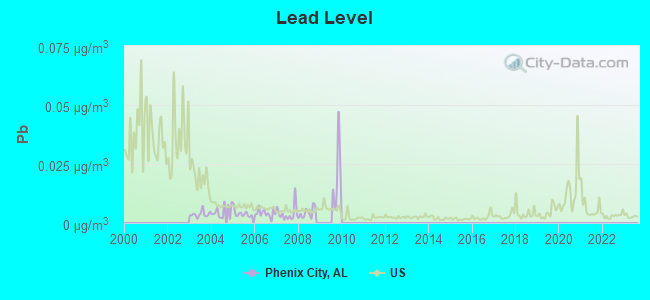

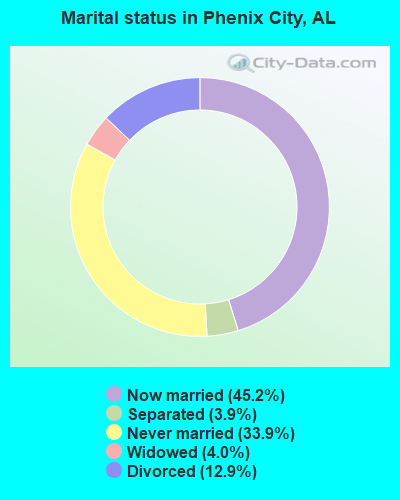
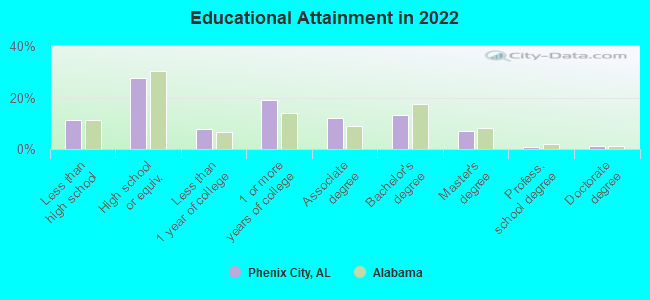
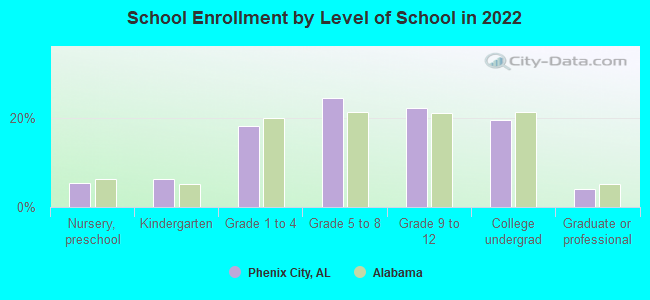
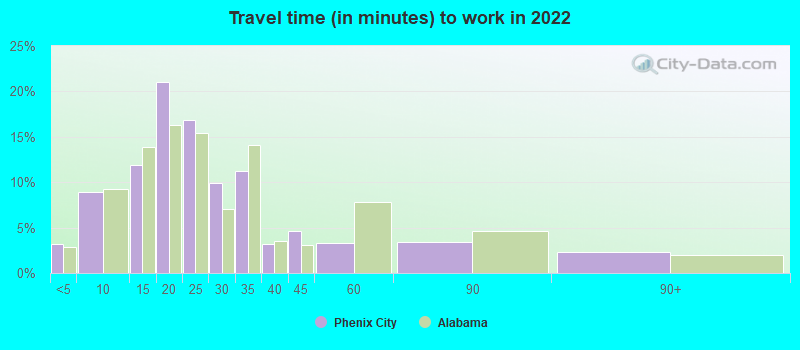
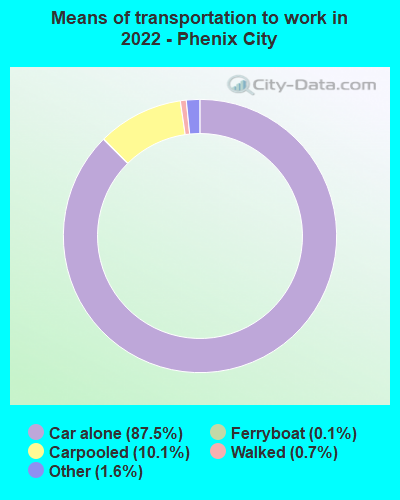
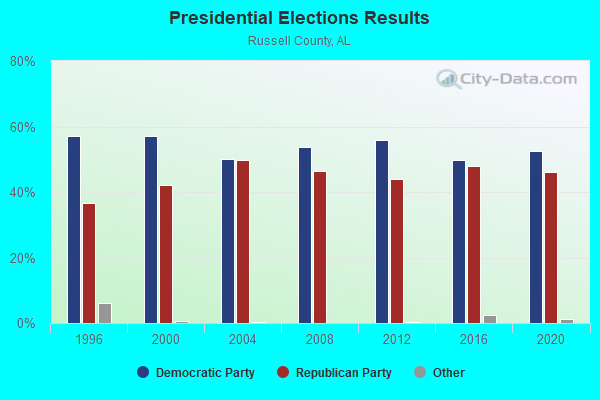
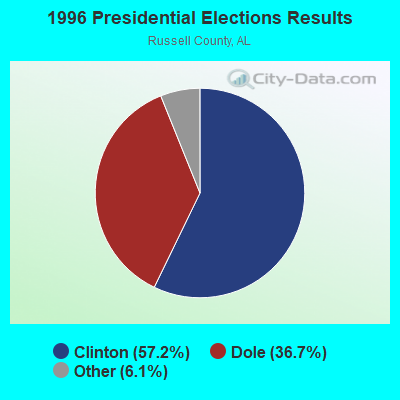
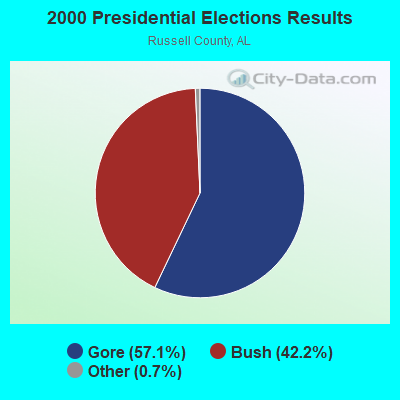
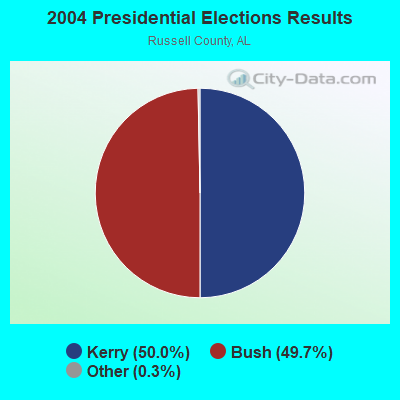
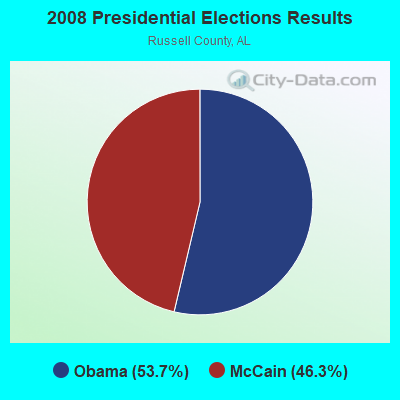
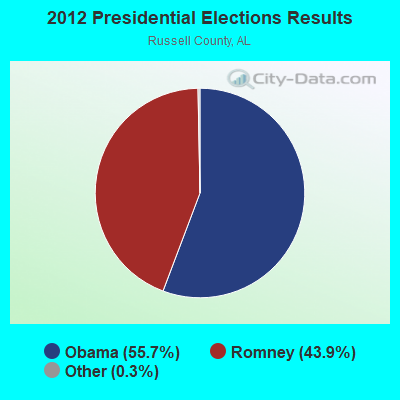
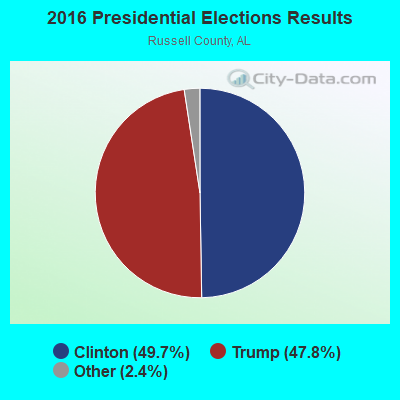
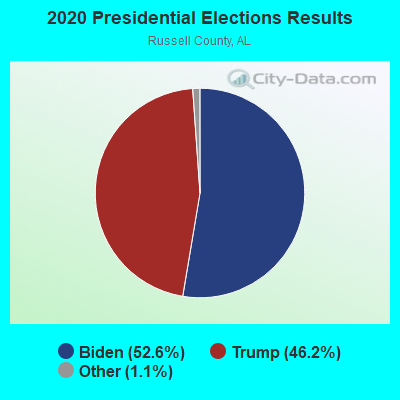
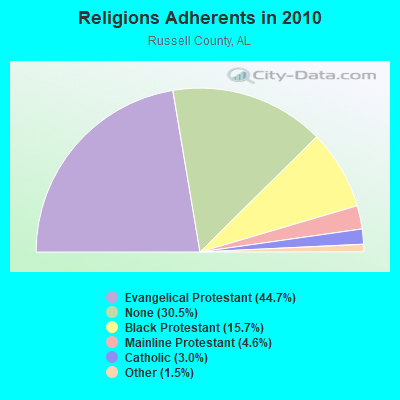
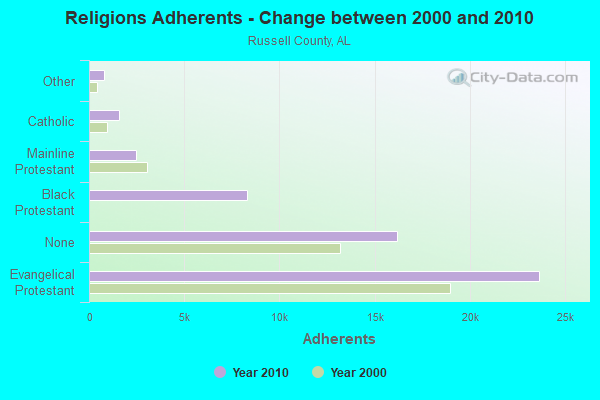
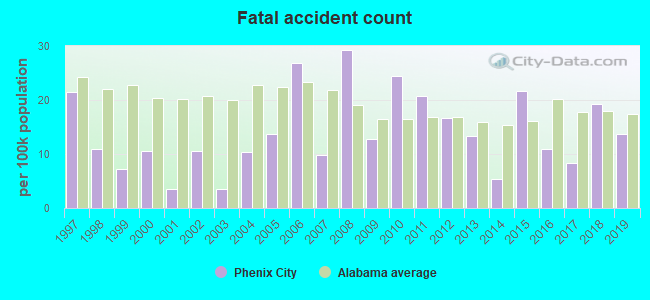
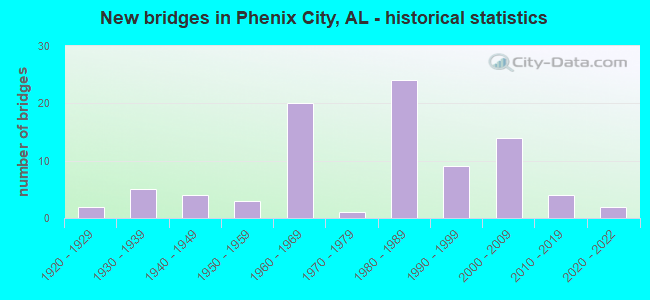
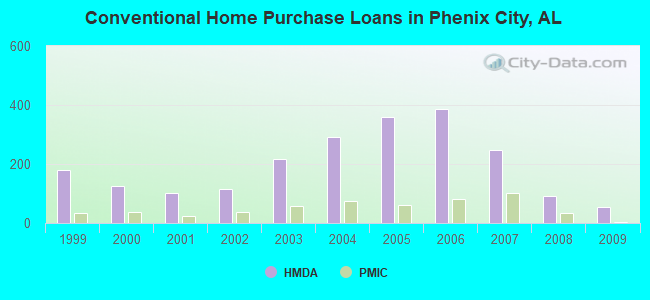
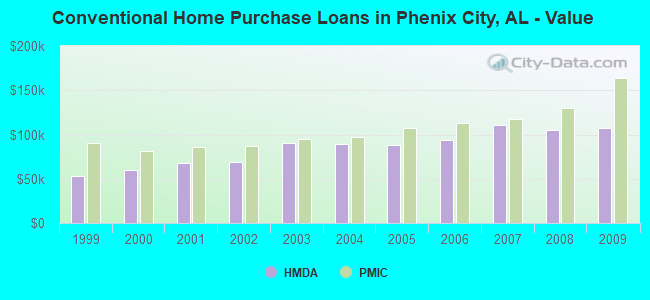
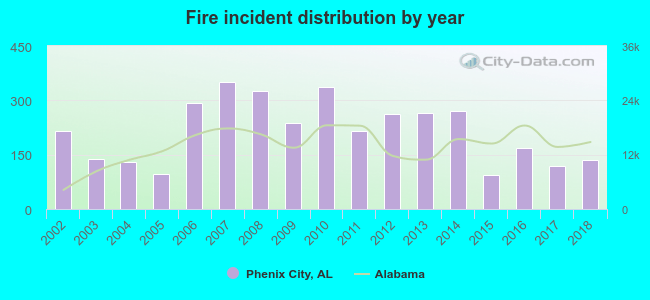 According to the data from the years 2002 - 2018 the average number of fires per year is 215. The highest number of reported fire incidents - 350 took place in 2007, and the least - 95 in 2015. The data has a declining trend.
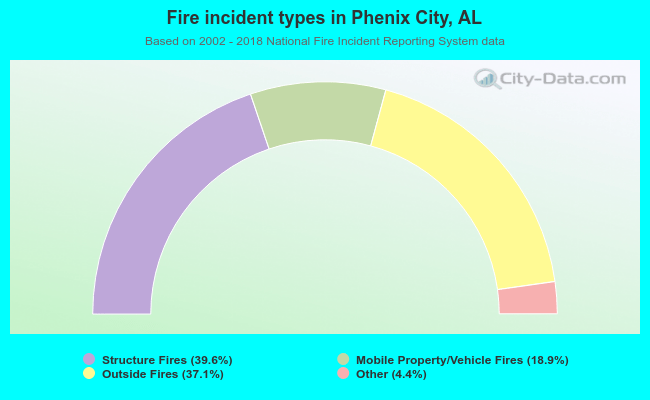 When looking into fire subcategories, the most incidents belonged to: Structure Fires (39.6%), and Outside Fires (37.1%).