The median household income in Winchester, CA in 2022 was $72,745, which was 25.9% less than the median annual income of $91,551 across the entire state of California. Compared to the median income of $33,472 in 2000 this represents an increase of 54.0%. The per capita income in 2022 was $22,858, which means an increase of 34.3% compared to 2000 when it was $15,028.
Whole page based on the data from 2000 / 2022 when the population of Winchester, California was 2,155 / 2,970
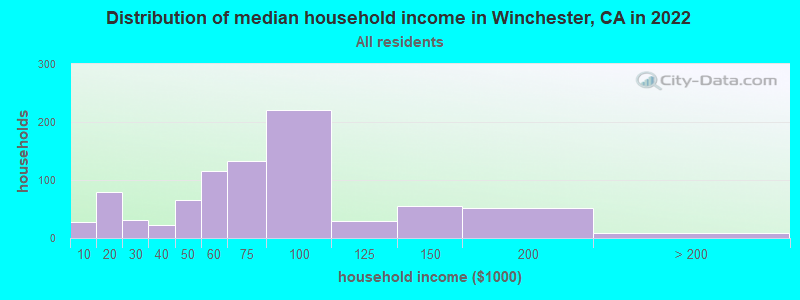
Income statistics for all residents
Median household income in Winchester, CA in 2022:
Winchester:
$72,746
California:
$91,551
Change in median household income between 2000 and 2022:
Winchester, California:
+117.3%
State:
+92.8%
Number of households with income < $10k:
Winchester:
3.3% (28)
California:
4.8% (654,370)
Number of households with income $10k - 20k:
Winchester:
9.5% (80)
California:
5.8% (789,493)
Number of households with income $20k - 30k:
Winchester:
3.7% (31)
State:
5.7% (778,318)
Number of households with income $30k - 40k:
Winchester:
2.7% (23)
State:
5.8% (783,170)
Number of households with income $40k - 50k:
Winchester:
7.7% (65)
State:
5.8% (781,352)
Number of households with income $50k - 60k:
Winchester:
13.8% (116)
California:
5.6% (760,175)
Number of households with income $60k - 75k:
Winchester:
15.7% (132)
State:
8.2% (1,104,699)
Number of households with income $75k - 100k:
Winchester:
26.2% (220)
State:
12.0% (1,627,633)
Number of households with income $100k - 125k:
Winchester:
3.5% (29)
State:
10.0% (1,358,619)
Number of households with income $125k - 150k:
Winchester:
6.5% (55)
California:
7.6% (1,027,455)
Number of households with income $150k - 200k:
Winchester:
6.2% (52)
State:
10.6% (1,439,811)
Number of households with income > $200k:
Winchester:
1.1% (9)
State:
18.0% (2,445,491)
Aggregate household income in Winchester in 2022: $61,320,221
Median family income in Winchester in 2022:
Winchester:
$83,742
California:
$104,823
Number of families with income $10k - 20k:
Winchester:
6.7% (41)
State:
3.5% (322,064)
Number of families with income $20k - 30k:
Winchester:
2.2% (14)
California:
4.7% (433,722)
Number of families with income $40k - 50k:
Winchester:
3.9% (24)
State:
5.6% (511,647)
Number of families with income $50k - 60k:
Winchester:
12.4% (77)
State:
5.5% (498,926)
Number of families with income $60k - 75k:
Winchester:
22.0% (136)
State:
8.0% (731,094)
Number of families with income $75k - 100k:
Winchester:
30.9% (191)
State:
12.2% (1,115,621)
Number of families with income $100k - 125k:
Winchester:
4.7% (29)
California:
10.5% (959,600)
Number of families with income $125k - 150k:
Winchester:
7.4% (46)
State:
8.4% (768,725)
Number of families with income $150k - 200k:
Winchester:
8.5% (53)
State:
11.9% (1,087,239)
Number of families with income > $200k:
Winchester:
1.4% (9)
State:
21.5% (1,963,769)
Median per capita income in Winchester in 2022:
Winchester:
$22,858
State:
$46,661
Change in median per capita income between 2000 and 2022:
Winchester, California:
+52.1%
State:
+105.5%
Income statistics for White residents
Median household income in Winchester, CA in 2022:
Winchester:
$83,910
California:
$100,917
Change in median household income between 2000 and 2022:
Winchester, California:
+141.7%
State:
+96.8%
Number of households with income < $10k:
Winchester:
0.0% (0)
State:
4.4% (284,109)
Number of households with income $10k - 20k:
Winchester:
18.0% (71)
California:
5.3% (340,330)
Number of households with income $20k - 30k:
Winchester:
7.4% (29)
State:
5.3% (343,145)
Number of households with income $30k - 40k:
Winchester:
5.1% (20)
State:
5.1% (330,146)
Number of households with income $40k - 50k:
Winchester:
4.8% (19)
State:
5.2% (335,310)
Number of households with income $50k - 60k:
Winchester:
0.0% (0)
State:
5.1% (326,299)
Number of households with income $60k - 75k:
Winchester:
6.1% (24)
California:
7.6% (487,640)
Number of households with income $75k - 100k:
Winchester:
38.6% (152)
State:
11.5% (736,578)
Number of households with income $100k - 125k:
Winchester:
5.8% (23)
State:
10.1% (648,782)
Number of households with income $125k - 150k:
Winchester:
6.1% (24)
State:
7.8% (499,671)
Number of households with income $150k - 200k:
Winchester:
8.1% (32)
California:
11.4% (729,603)
Number of households with income > $200k:
Winchester:
0.0% (0)
State:
21.2% (1,364,246)
Aggregate household income in Winchester in 2022: $29,757,847
Median family income in Winchester in 2022:
Winchester:
$95,486
State:
$125,379
Number of families with income $20k - 30k:
Winchester:
3.9% (10)
California:
3.5% (137,295)
Number of families with income $40k - 50k:
Winchester:
7.4% (19)
State:
4.3% (169,197)
Number of families with income $60k - 75k:
Winchester:
9.0% (23)
State:
7.0% (274,752)
Number of families with income $75k - 100k:
Winchester:
49.1% (125)
State:
11.3% (445,632)
Number of families with income $100k - 125k:
Winchester:
8.6% (22)
State:
10.7% (423,630)
Number of families with income $125k - 150k:
Winchester:
9.1% (23)
State:
9.1% (357,408)
Number of families with income $150k - 200k:
Winchester:
13.0% (33)
California:
13.5% (532,693)
Median non-family income in Winchester in 2022:
Winchester:
$20,287
State:
$62,819
Change in median non-family income between 2000 and 2022:
Winchester, California:
+48.0%
State:
+84.4%
Median per capita income in Winchester in 2022:
Winchester:
$30,940
California:
$61,706
Change in median per capita income between 2000 and 2022:
Winchester, California:
+81.6%
State:
+122.7%
Income statistics for Asian residents
Number of households with income < $10k:
Winchester:
0.0% (0)
State:
5.1% (106,273)
Number of households with income $10k - 20k:
Winchester:
0.0% (0)
California:
4.9% (101,815)
Number of households with income $20k - 30k:
Winchester:
0.0% (0)
State:
4.6% (94,414)
Number of households with income $30k - 40k:
Winchester:
0.0% (0)
State:
4.1% (84,491)
Number of households with income $40k - 50k:
Winchester:
0.0% (0)
California:
4.0% (81,758)
Number of households with income $50k - 60k:
Winchester:
51.3% (39)
State:
3.9% (80,971)
Number of households with income $60k - 75k:
Winchester:
6.6% (5)
State:
6.0% (124,194)
Number of households with income $75k - 100k:
Winchester:
0.0% (0)
State:
9.7% (200,337)
Number of households with income $100k - 125k:
Winchester:
0.0% (0)
State:
9.4% (193,488)
Number of households with income $125k - 150k:
Winchester:
13.2% (10)
State:
7.7% (158,253)
Number of households with income $150k - 200k:
Winchester:
17.1% (13)
State:
12.2% (252,139)
Number of households with income > $200k:
Winchester:
11.8% (9)
State:
28.4% (586,641)
Aggregate household income in Winchester in 2022: $7,831,136
Median family income in Winchester in 2022:
Winchester:
$180,320
State:
$136,040
Number of families with income $60k - 75k:
Winchester:
35.4% (12)
State:
5.9% (88,675)
Number of families with income $150k - 200k:
Winchester:
39.5% (14)
State:
13.2% (198,099)
Number of families with income > $200k:
Winchester:
25.1% (9)
California:
32.5% (489,303)
Median per capita income in Winchester in 2022:
Winchester:
$38,193
State:
$58,824
Income statistics for Hispanic or Latino residents
Median household income in Winchester, CA in 2022:
Winchester:
$75,942
California:
$75,698
Number of households with income < $10k:
Winchester:
0.0% (0)
State:
4.3% (183,294)
Number of households with income $10k - 20k:
Winchester:
0.0% (0)
State:
6.0% (253,903)
Number of households with income $20k - 30k:
Winchester:
0.0% (0)
State:
6.8% (286,386)
Number of households with income $30k - 40k:
Winchester:
0.0% (0)
California:
7.4% (313,728)
Number of households with income $40k - 50k:
Winchester:
17.5% (53)
California:
7.4% (313,199)
Number of households with income $50k - 60k:
Winchester:
24.8% (75)
State:
7.2% (305,366)
Number of households with income $60k - 75k:
Winchester:
31.1% (94)
California:
10.3% (434,937)
Number of households with income $75k - 100k:
Winchester:
6.3% (19)
State:
14.4% (607,302)
Number of households with income $100k - 125k:
Winchester:
4.6% (14)
State:
10.6% (447,424)
Number of households with income $125k - 150k:
Winchester:
6.3% (19)
State:
7.5% (316,022)
Number of households with income $150k - 200k:
Winchester:
9.3% (28)
California:
9.2% (386,269)
Number of households with income > $200k:
Winchester:
0.0% (0)
State:
8.8% (372,651)
Aggregate household income in Winchester in 2022: $24,278,897
Median family income in Winchester in 2022:
Winchester:
$76,116
State:
$77,589
Number of families with income $10k - 20k:
Winchester:
13.9% (42)
State:
4.6% (151,997)
Number of families with income $40k - 50k:
Winchester:
4.3% (13)
California:
7.7% (254,822)
Number of families with income $50k - 60k:
Winchester:
25.9% (78)
State:
7.4% (244,815)
Number of families with income $60k - 75k:
Winchester:
29.2% (88)
State:
10.5% (345,838)
Number of families with income $75k - 100k:
Winchester:
6.4% (19)
State:
14.9% (491,589)
Number of families with income $100k - 125k:
Winchester:
4.8% (14)
State:
10.7% (355,400)
Number of families with income $125k - 150k:
Winchester:
6.4% (19)
State:
7.8% (259,317)
Number of families with income $150k - 200k:
Winchester:
9.3% (28)
State:
9.3% (306,566)
Median per capita income in Winchester in 2022:
Winchester:
$17,234
California:
$27,240
Change in median per capita income between 2000 and 2022:
Winchester, California:
+144.9%
State:
+133.3%
Income statistics for Multirace residents
Median household income in Winchester, CA in 2022:
Winchester:
$68,601
California:
$83,153
Number of households with income < $10k:
Winchester:
29.4% (45)
State:
4.2% (85,299)
Number of households with income $10k - 20k:
Winchester:
0.0% (0)
State:
6.1% (122,966)
Number of households with income $20k - 30k:
Winchester:
0.0% (0)
State:
6.4% (129,328)
Number of households with income $30k - 40k:
Winchester:
0.0% (0)
State:
6.4% (130,070)
Number of households with income $40k - 50k:
Winchester:
0.0% (0)
State:
6.5% (131,254)
Number of households with income $50k - 60k:
Winchester:
0.0% (0)
California:
6.5% (132,382)
Number of households with income $60k - 75k:
Winchester:
54.9% (84)
State:
9.4% (191,472)
Number of households with income $75k - 100k:
Winchester:
15.7% (24)
California:
13.3% (269,691)
Number of households with income $100k - 125k:
Winchester:
0.0% (0)
State:
10.2% (207,286)
Number of households with income $125k - 150k:
Winchester:
0.0% (0)
State:
7.8% (158,259)
Number of households with income $150k - 200k:
Winchester:
0.0% (0)
State:
10.3% (209,227)
Number of households with income > $200k:
Winchester:
0.0% (0)
State:
13.0% (263,210)
Aggregate household income in Winchester in 2022: $8,004,664
Median per capita income in Winchester in 2022:
Winchester:
$24,845
State:
$32,124
Change in median per capita income between 2000 and 2022:
Winchester, California:
+66.6%
California:
+120.4%
Income statistics for other residents
Median household income in Winchester, CA in 2022:
Winchester:
$66,552
State:
$71,383
Number of households with income < $10k:
Winchester:
0.0% (0)
State:
4.6% (93,035)
Number of households with income $10k - 20k:
Winchester:
0.0% (0)
State:
6.3% (126,222)
Number of households with income $20k - 30k:
Winchester:
0.0% (0)
State:
7.1% (142,656)
Number of households with income $30k - 40k:
Winchester:
0.0% (0)
State:
8.2% (165,018)
Number of households with income $40k - 50k:
Winchester:
21.4% (43)
California:
8.0% (161,732)
Number of households with income $50k - 60k:
Winchester:
37.3% (75)
California:
7.6% (152,152)
Number of households with income $60k - 75k:
Winchester:
21.4% (43)
State:
10.4% (209,951)
Number of households with income $75k - 100k:
Winchester:
9.5% (19)
State:
14.7% (296,102)
Number of households with income $100k - 125k:
Winchester:
0.0% (0)
State:
10.7% (214,281)
Number of households with income $125k - 150k:
Winchester:
10.4% (21)
State:
7.1% (143,092)
Number of households with income $150k - 200k:
Winchester:
0.0% (0)
California:
8.6% (172,215)
Number of households with income > $200k:
Winchester:
0.0% (0)
State:
6.7% (134,102)
Aggregate household income in Winchester in 2022: $15,603,289
Median family income in Winchester in 2022:
Winchester:
$63,931
State:
$72,756
Number of families with income $10k - 20k:
Winchester:
22.5% (45)
California:
5.1% (82,116)
Number of families with income $50k - 60k:
Winchester:
36.8% (74)
State:
7.7% (124,826)
Number of families with income $60k - 75k:
Winchester:
20.6% (42)
California:
10.7% (173,628)
Number of families with income $75k - 100k:
Winchester:
9.9% (20)
California:
15.2% (245,724)
Number of families with income $125k - 150k:
Winchester:
10.2% (21)
State:
7.4% (119,985)
Median per capita income in Winchester in 2022:
Winchester:
$14,308
State:
$25,164
Change in median per capita income between 2000 and 2022:
Winchester, California:
+104.1%
State:
+137.9%
Discuss Winchester, California (CA) on our hugely popular California forum.