The median household income in Wimberley, TX in 2022 was $102,883, which was 29.7% greater than the median annual income of $72,284 across the entire state of Texas. Compared to the median income of $46,042 in 2000 this represents an increase of 55.2%. The per capita income in 2022 was $58,118, which means an increase of 56.9% compared to 2000 when it was $25,033.
Whole page based on the data from 2000 / 2022 when the population of Wimberley, Texas was 3,797 / 3,136
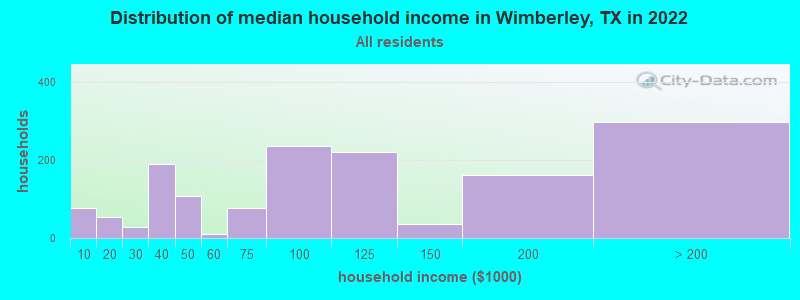
Income statistics for all residents
Median household income in Wimberley, TX in 2022:
Wimberley:
$102,884
State:
$72,284
Change in median household income between 2000 and 2022:
Wimberley, Texas:
+123.5%
State:
+81.0%
Number of households with income < $10k:
Wimberley:
5.1% (77)
State:
5.5% (611,011)
Number of households with income $10k - 20k:
Wimberley:
3.7% (55)
Texas:
6.7% (743,157)
Number of households with income $20k - 30k:
Wimberley:
1.8% (27)
State:
7.2% (803,381)
Number of households with income $30k - 40k:
Wimberley:
12.7% (190)
Texas:
7.8% (866,080)
Number of households with income $40k - 50k:
Wimberley:
7.2% (108)
Texas:
7.3% (810,440)
Number of households with income $50k - 60k:
Wimberley:
0.7% (11)
State:
7.2% (799,783)
Number of households with income $60k - 75k:
Wimberley:
5.1% (77)
State:
9.9% (1,095,384)
Number of households with income $75k - 100k:
Wimberley:
15.8% (236)
State:
12.8% (1,419,057)
Number of households with income $100k - 125k:
Wimberley:
14.7% (220)
State:
9.5% (1,054,577)
Number of households with income $125k - 150k:
Wimberley:
2.5% (37)
State:
6.7% (741,518)
Number of households with income $150k - 200k:
Wimberley:
10.8% (162)
Texas:
8.7% (961,776)
Number of households with income > $200k:
Wimberley:
19.8% (297)
Texas:
10.7% (1,181,544)
Aggregate household income in Wimberley in 2022: $188,298,706
Median family income in Wimberley in 2022:
Wimberley:
$132,132
State:
$86,267
Number of families with income $10k - 20k:
Wimberley:
6.8% (65)
State:
4.3% (324,514)
Number of families with income $40k - 50k:
Wimberley:
7.3% (69)
State:
6.7% (499,663)
Number of families with income $50k - 60k:
Wimberley:
1.2% (12)
State:
6.6% (492,203)
Number of families with income $60k - 75k:
Wimberley:
4.7% (45)
State:
9.5% (710,229)
Number of families with income $75k - 100k:
Wimberley:
18.1% (173)
Texas:
13.6% (1,015,480)
Number of families with income $100k - 125k:
Wimberley:
11.7% (112)
State:
10.7% (797,961)
Number of families with income $125k - 150k:
Wimberley:
3.8% (36)
State:
8.1% (602,985)
Number of families with income $150k - 200k:
Wimberley:
18.9% (180)
State:
10.7% (804,459)
Number of families with income > $200k:
Wimberley:
27.6% (263)
State:
13.5% (1,013,514)
Median non-family income in Wimberley in 2022:
Wimberley:
$37,654
State:
$45,999
Change in median non-family income between 2000 and 2022:
Wimberley, Texas:
+64.6%
State:
+79.5%
Median per capita income in Wimberley in 2022:
Wimberley:
$58,118
State:
$38,123
Change in median per capita income between 2000 and 2022:
Wimberley, Texas:
+132.2%
State:
+94.3%
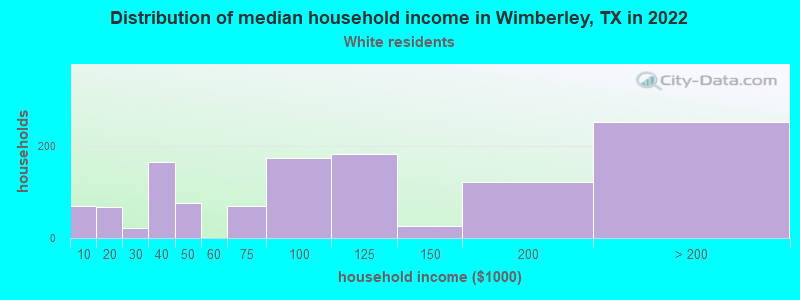
Income statistics for White residents
Median household income in Wimberley, TX in 2022:
Wimberley:
$100,068
State:
$82,032
Change in median household income between 2000 and 2022:
Wimberley, Texas:
+109.3%
Texas:
+91.0%
Number of households with income < $10k:
Wimberley:
5.7% (70)
State:
4.7% (273,716)
Number of households with income $10k - 20k:
Wimberley:
5.4% (67)
State:
5.5% (322,702)
Number of households with income $20k - 30k:
Wimberley:
1.8% (22)
State:
6.2% (363,947)
Number of households with income $30k - 40k:
Wimberley:
13.5% (166)
State:
6.8% (399,275)
Number of households with income $40k - 50k:
Wimberley:
6.2% (76)
Texas:
6.5% (383,417)
Number of households with income $50k - 60k:
Wimberley:
0.0% (0)
State:
6.6% (388,535)
Number of households with income $60k - 75k:
Wimberley:
5.7% (70)
Texas:
9.7% (566,295)
Number of households with income $75k - 100k:
Wimberley:
14.1% (174)
State:
13.0% (760,276)
Number of households with income $100k - 125k:
Wimberley:
14.9% (183)
State:
10.2% (597,596)
Number of households with income $125k - 150k:
Wimberley:
2.2% (27)
Texas:
7.4% (436,830)
Number of households with income $150k - 200k:
Wimberley:
9.9% (122)
Texas:
9.9% (583,067)
Number of households with income > $200k:
Wimberley:
20.6% (253)
State:
13.5% (792,647)
Aggregate household income in Wimberley in 2022: $155,334,229
Median family income in Wimberley in 2022:
Wimberley:
$143,355
Texas:
$101,788
Number of families with income $10k - 20k:
Wimberley:
8.7% (67)
State:
2.9% (113,421)
Number of families with income $40k - 50k:
Wimberley:
5.7% (44)
Texas:
5.6% (216,490)
Number of families with income $60k - 75k:
Wimberley:
5.7% (44)
Texas:
9.0% (346,106)
Number of families with income $75k - 100k:
Wimberley:
17.4% (134)
State:
13.7% (527,363)
Number of families with income $100k - 125k:
Wimberley:
13.0% (100)
State:
11.6% (448,411)
Number of families with income $125k - 150k:
Wimberley:
3.3% (25)
Texas:
9.2% (355,798)
Number of families with income $150k - 200k:
Wimberley:
17.0% (130)
Texas:
12.5% (480,185)
Number of families with income > $200k:
Wimberley:
29.3% (225)
State:
17.6% (677,490)
Median non-family income in Wimberley in 2022:
Wimberley:
$35,571
Texas:
$50,587
Change in median non-family income between 2000 and 2022:
Wimberley, Texas:
+54.1%
State:
+87.7%
Median per capita income in Wimberley in 2022:
Wimberley:
$61,422
State:
$47,740
Change in median per capita income between 2000 and 2022:
Wimberley, Texas:
+131.4%
Texas:
+114.3%
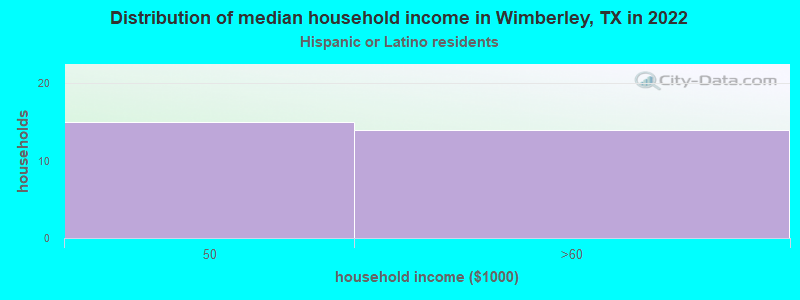
Income statistics for Hispanic or Latino residents
Number of households with income < $10k:
Wimberley:
0.0% (0)
State:
5.8% (213,953)
Number of households with income $10k - 20k:
Wimberley:
0.0% (0)
Texas:
8.0% (297,456)
Number of households with income $20k - 30k:
Wimberley:
0.0% (0)
State:
9.2% (340,166)
Number of households with income $30k - 40k:
Wimberley:
0.0% (0)
Texas:
9.5% (354,336)
Number of households with income $40k - 50k:
Wimberley:
51.7% (15)
State:
8.8% (327,013)
Number of households with income $50k - 60k:
Wimberley:
48.3% (14)
State:
8.3% (308,818)
Number of households with income $60k - 75k:
Wimberley:
0.0% (0)
State:
10.9% (405,109)
Number of households with income $75k - 100k:
Wimberley:
0.0% (0)
Texas:
13.8% (511,639)
Number of households with income $100k - 125k:
Wimberley:
0.0% (0)
Texas:
8.6% (319,728)
Number of households with income $125k - 150k:
Wimberley:
0.0% (0)
State:
5.7% (210,932)
Number of households with income $150k - 200k:
Wimberley:
0.0% (0)
State:
6.4% (236,055)
Number of households with income > $200k:
Wimberley:
0.0% (0)
State:
5.1% (189,259)
Aggregate household income in Wimberley in 2022: $18,544,860
Median per capita income in Wimberley in 2022:
Wimberley:
$25,074
Texas:
$24,862
Change in median per capita income between 2000 and 2022:
Wimberley, Texas:
+53.4%
State:
+130.8%
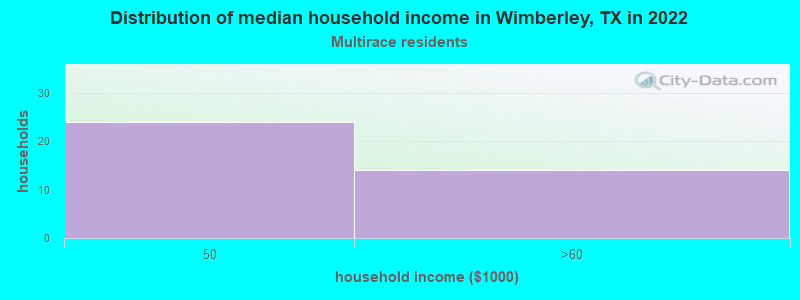
Income statistics for Multirace residents
Number of households with income < $10k:
Wimberley:
0.0% (0)
State:
5.5% (122,324)
Number of households with income $10k - 20k:
Wimberley:
0.0% (0)
Texas:
8.2% (182,232)
Number of households with income $20k - 30k:
Wimberley:
0.0% (0)
Texas:
8.5% (189,456)
Number of households with income $30k - 40k:
Wimberley:
0.0% (0)
State:
8.9% (197,499)
Number of households with income $40k - 50k:
Wimberley:
63.2% (24)
Texas:
8.7% (191,735)
Number of households with income $50k - 60k:
Wimberley:
36.8% (14)
Texas:
8.0% (177,535)
Number of households with income $60k - 75k:
Wimberley:
0.0% (0)
State:
10.5% (232,479)
Number of households with income $75k - 100k:
Wimberley:
0.0% (0)
State:
13.1% (290,448)
Number of households with income $100k - 125k:
Wimberley:
0.0% (0)
State:
8.6% (191,595)
Number of households with income $125k - 150k:
Wimberley:
0.0% (0)
State:
6.0% (133,361)
Number of households with income $150k - 200k:
Wimberley:
0.0% (0)
Texas:
7.2% (159,195)
Number of households with income > $200k:
Wimberley:
0.0% (0)
Texas:
6.7% (148,064)
Aggregate household income in Wimberley in 2022: $11,925,131
Median per capita income in Wimberley in 2022:
Wimberley:
$15,721
State:
$26,785
Income statistics for other residents
Median per capita income in Wimberley in 2022:
Wimberley:
$5,760
State:
$23,899
Change in median per capita income between 2000 and 2022:: -30.6%
Wimberley, Texas:
-30.6%
State:
+135.2%
Discuss Wimberley, Texas (TX) on our hugely popular Texas forum.