The median household income in Torrington, CT in 2022 was $65,298, which was 35.4% less than the median annual income of $88,429 across the entire state of Connecticut. Compared to the median income of $41,841 in 2000 this represents an increase of 35.9%. The per capita income in 2022 was $34,215, which means an increase of 37.4% compared to 2000 when it was $21,406.
Whole page based on the data from 2000 / 2022 when the population of Torrington, Connecticut was 35,202 / 35,656
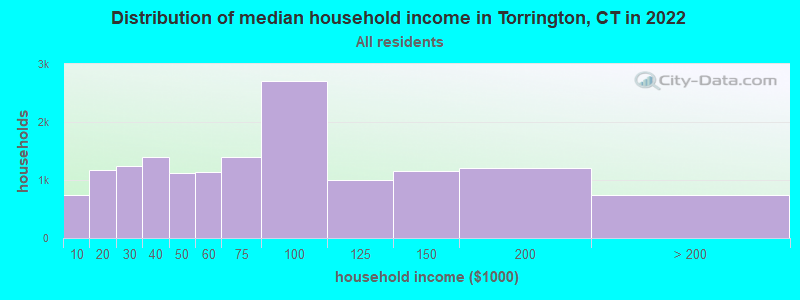
Income statistics for all residents
Median household income in Torrington, CT in 2022:
Torrington:
$65,299
Connecticut:
$88,429
Change in median household income between 2000 and 2022:
Torrington, Connecticut:
+56.1%
State:
+64.0%
Number of households with income < $10k:
Torrington:
4.9% (736)
State:
5.1% (72,746)
Number of households with income $10k - 20k:
Torrington:
7.8% (1,165)
Connecticut:
5.7% (81,643)
Number of households with income $20k - 30k:
Torrington:
8.3% (1,238)
State:
6.5% (92,844)
Number of households with income $30k - 40k:
Torrington:
9.3% (1,393)
State:
5.9% (83,934)
Number of households with income $40k - 50k:
Torrington:
7.5% (1,117)
Connecticut:
5.8% (83,025)
Number of households with income $50k - 60k:
Torrington:
7.6% (1,139)
State:
5.7% (81,788)
Number of households with income $60k - 75k:
Torrington:
9.3% (1,398)
Connecticut:
8.1% (115,651)
Number of households with income $75k - 100k:
Torrington:
18.0% (2,701)
State:
12.6% (180,173)
Number of households with income $100k - 125k:
Torrington:
6.6% (995)
State:
9.9% (141,231)
Number of households with income $125k - 150k:
Torrington:
7.7% (1,157)
Connecticut:
7.9% (112,826)
Number of households with income $150k - 200k:
Torrington:
8.0% (1,204)
Connecticut:
10.8% (154,641)
Number of households with income > $200k:
Torrington:
5.0% (747)
State:
16.3% (233,133)
Aggregate household income in Torrington in 2022: $1,206,574,158
Median family income in Torrington in 2022:
Torrington:
$81,444
Connecticut:
$115,183
Number of families with income < $10k:
Torrington:
3.4% (299)
State:
2.6% (23,251)
Number of families with income $10k - 20k:
Torrington:
3.9% (346)
State:
2.8% (25,184)
Number of families with income $20k - 30k:
Torrington:
6.1% (536)
State:
4.1% (36,835)
Number of families with income $30k - 40k:
Torrington:
5.0% (438)
Connecticut:
4.2% (38,052)
Number of families with income $40k - 50k:
Torrington:
7.5% (662)
State:
4.8% (43,104)
Number of families with income $50k - 60k:
Torrington:
5.4% (481)
State:
4.8% (43,284)
Number of families with income $60k - 75k:
Torrington:
11.2% (989)
State:
7.4% (66,521)
Number of families with income $75k - 100k:
Torrington:
20.9% (1,848)
Connecticut:
12.9% (116,232)
Number of families with income $100k - 125k:
Torrington:
9.5% (836)
State:
10.6% (95,504)
Number of families with income $125k - 150k:
Torrington:
10.3% (908)
State:
9.5% (86,149)
Number of families with income $150k - 200k:
Torrington:
9.3% (823)
Connecticut:
14.0% (125,908)
Number of families with income > $200k:
Torrington:
7.6% (676)
State:
22.4% (202,515)
Median non-family income in Torrington in 2022:
Torrington:
$40,713
Connecticut:
$50,964
Change in median non-family income between 2000 and 2022:
Torrington, Connecticut:
+68.8%
State:
+65.1%
Median per capita income in Torrington in 2022:
Torrington:
$34,216
State:
$51,581
Change in median per capita income between 2000 and 2022:
Torrington, Connecticut:
+59.8%
State:
+79.3%
Income statistics for White residents
Median household income in Torrington, CT in 2022:
Torrington:
$64,765
State:
$96,890
Change in median household income between 2000 and 2022:
Torrington, Connecticut:
+53.3%
State:
+68.5%
Number of households with income < $10k:
Torrington:
5.3% (583)
State:
4.2% (42,265)
Number of households with income $10k - 20k:
Torrington:
8.3% (905)
Connecticut:
4.8% (48,323)
Number of households with income $20k - 30k:
Torrington:
8.1% (883)
Connecticut:
5.7% (57,716)
Number of households with income $30k - 40k:
Torrington:
9.0% (980)
State:
5.3% (53,827)
Number of households with income $40k - 50k:
Torrington:
7.2% (791)
State:
5.3% (53,301)
Number of households with income $50k - 60k:
Torrington:
7.9% (867)
Connecticut:
5.5% (55,690)
Number of households with income $60k - 75k:
Torrington:
8.9% (978)
Connecticut:
8.0% (80,329)
Number of households with income $75k - 100k:
Torrington:
16.5% (1,807)
State:
12.7% (128,070)
Number of households with income $100k - 125k:
Torrington:
7.2% (791)
State:
10.0% (101,210)
Number of households with income $125k - 150k:
Torrington:
8.3% (903)
State:
8.0% (81,250)
Number of households with income $150k - 200k:
Torrington:
7.5% (825)
State:
11.8% (119,527)
Number of households with income > $200k:
Torrington:
5.7% (625)
State:
18.6% (187,875)
Aggregate household income in Torrington in 2022: $895,610,892
Median family income in Torrington in 2022:
Torrington:
$89,711
State:
$128,955
Number of families with income < $10k:
Torrington:
2.4% (148)
State:
1.9% (11,537)
Number of families with income $10k - 20k:
Torrington:
2.9% (181)
State:
1.8% (11,289)
Number of families with income $20k - 30k:
Torrington:
4.7% (293)
Connecticut:
3.0% (18,506)
Number of families with income $30k - 40k:
Torrington:
3.9% (247)
State:
2.9% (18,160)
Number of families with income $40k - 50k:
Torrington:
7.9% (498)
State:
3.9% (24,550)
Number of families with income $50k - 60k:
Torrington:
6.2% (391)
State:
4.3% (26,723)
Number of families with income $60k - 75k:
Torrington:
9.3% (583)
Connecticut:
7.1% (44,075)
Number of families with income $75k - 100k:
Torrington:
22.9% (1,431)
State:
12.5% (77,679)
Number of families with income $100k - 125k:
Torrington:
10.6% (663)
State:
11.1% (69,086)
Number of families with income $125k - 150k:
Torrington:
10.2% (635)
Connecticut:
9.6% (59,616)
Number of families with income $150k - 200k:
Torrington:
10.1% (634)
Connecticut:
15.7% (97,890)
Number of families with income > $200k:
Torrington:
8.9% (556)
State:
26.3% (163,417)
Median non-family income in Torrington in 2022:
Torrington:
$35,657
Connecticut:
$54,067
Change in median non-family income between 2000 and 2022:
Torrington, Connecticut:
+47.6%
State:
+68.7%
Median per capita income in Torrington in 2022:
Torrington:
$37,094
Connecticut:
$59,916
Change in median per capita income between 2000 and 2022:
Torrington, Connecticut:
+69.8%
Connecticut:
+90.2%
Income statistics for Black or African American residents
Median household income in Torrington, CT in 2022:
Torrington:
$66,627
State:
$61,803
Change in median household income between 2000 and 2022:
Torrington, Connecticut:
+76.2%
Connecticut:
+76.1%
Number of households with income < $10k:
Torrington:
2.6% (37)
State:
6.8% (9,494)
Number of households with income $10k - 20k:
Torrington:
4.2% (61)
Connecticut:
7.9% (11,003)
Number of households with income $20k - 30k:
Torrington:
5.5% (79)
State:
10.8% (15,045)
Number of households with income $30k - 40k:
Torrington:
14.9% (216)
Connecticut:
8.2% (11,501)
Number of households with income $40k - 50k:
Torrington:
11.9% (172)
State:
7.4% (10,416)
Number of households with income $50k - 60k:
Torrington:
10.4% (151)
Connecticut:
7.5% (10,534)
Number of households with income $60k - 75k:
Torrington:
6.0% (87)
State:
8.0% (11,244)
Number of households with income $75k - 100k:
Torrington:
17.6% (254)
State:
9.6% (13,370)
Number of households with income $100k - 125k:
Torrington:
1.9% (28)
State:
10.2% (14,244)
Number of households with income $125k - 150k:
Torrington:
6.1% (88)
State:
8.0% (11,246)
Number of households with income $150k - 200k:
Torrington:
18.9% (273)
State:
7.7% (10,727)
Number of households with income > $200k:
Torrington:
0.0% (0)
Connecticut:
7.9% (11,086)
Aggregate household income in Torrington in 2022: $130,549,608
Median family income in Torrington in 2022:
Torrington:
$73,348
State:
$87,228
Number of families with income < $10k:
Torrington:
12.4% (101)
State:
3.8% (3,184)
Number of families with income $10k - 20k:
Torrington:
12.0% (97)
Connecticut:
4.8% (4,026)
Number of families with income $20k - 30k:
Torrington:
9.4% (77)
State:
6.0% (5,015)
Number of families with income $30k - 40k:
Torrington:
4.5% (37)
State:
7.7% (6,445)
Number of families with income $40k - 50k:
Torrington:
5.4% (44)
State:
6.6% (5,531)
Number of families with income $60k - 75k:
Torrington:
9.7% (79)
State:
8.2% (6,861)
Number of families with income $75k - 100k:
Torrington:
13.7% (112)
State:
12.7% (10,598)
Number of families with income $100k - 125k:
Torrington:
3.2% (26)
State:
11.4% (9,482)
Number of families with income $125k - 150k:
Torrington:
11.3% (92)
Connecticut:
11.2% (9,356)
Number of families with income $150k - 200k:
Torrington:
18.4% (150)
State:
11.4% (9,497)
Median non-family income in Torrington in 2022:
Torrington:
$67,638
State:
$38,608
Change in median non-family income between 2000 and 2022:
Torrington, Connecticut:
+128.6%
State:
+77.0%
Median per capita income in Torrington in 2022:
Torrington:
$32,712
Connecticut:
$36,289
Change in median per capita income between 2000 and 2022:
Torrington, Connecticut:
+98.9%
State:
+117.5%
Income statistics for Asian residents
Median household income in Torrington, CT in 2022:
Torrington:
$70,996
State:
$110,568
Change in median household income between 2000 and 2022:
Torrington, Connecticut:
+73.6%
Connecticut:
+79.5%
Number of households with income < $10k:
Torrington:
0.0% (0)
State:
7.1% (4,245)
Number of households with income $10k - 20k:
Torrington:
9.0% (39)
State:
3.5% (2,087)
Number of households with income $20k - 30k:
Torrington:
8.1% (35)
Connecticut:
4.1% (2,464)
Number of households with income $30k - 40k:
Torrington:
10.4% (45)
State:
4.1% (2,478)
Number of households with income $40k - 50k:
Torrington:
7.6% (33)
Connecticut:
3.3% (1,983)
Number of households with income $50k - 60k:
Torrington:
9.2% (40)
State:
3.9% (2,328)
Number of households with income $60k - 75k:
Torrington:
8.5% (37)
Connecticut:
7.0% (4,228)
Number of households with income $75k - 100k:
Torrington:
36.0% (156)
Connecticut:
11.5% (6,911)
Number of households with income $100k - 125k:
Torrington:
1.2% (5)
State:
10.2% (6,127)
Number of households with income $125k - 150k:
Torrington:
1.8% (8)
State:
8.5% (5,079)
Number of households with income $150k - 200k:
Torrington:
0.0% (0)
State:
12.4% (7,434)
Number of households with income > $200k:
Torrington:
8.1% (35)
Connecticut:
24.4% (14,661)
Aggregate household income in Torrington in 2022: $32,220,316
Median family income in Torrington in 2022:
Torrington:
$50,547
State:
$134,548
Number of families with income $10k - 20k:
Torrington:
1.6% (3)
State:
1.6% (700)
Number of families with income $20k - 30k:
Torrington:
15.7% (34)
Connecticut:
3.8% (1,682)
Number of families with income $30k - 40k:
Torrington:
15.7% (34)
State:
3.8% (1,652)
Number of families with income $40k - 50k:
Torrington:
10.4% (23)
State:
2.0% (863)
Number of families with income $50k - 60k:
Torrington:
13.0% (28)
Connecticut:
3.7% (1,635)
Number of families with income $60k - 75k:
Torrington:
9.2% (20)
Connecticut:
6.0% (2,651)
Number of families with income $75k - 100k:
Torrington:
14.2% (31)
State:
11.0% (4,844)
Number of families with income $125k - 150k:
Torrington:
3.2% (7)
State:
8.2% (3,588)
Number of families with income > $200k:
Torrington:
17.0% (37)
Connecticut:
30.8% (13,522)
Median non-family income in Torrington in 2022:
Torrington:
$72,230
Connecticut:
$63,785
Median per capita income in Torrington in 2022:
Torrington:
$31,086
Connecticut:
$55,295
Change in median per capita income between 2000 and 2022:
Torrington, Connecticut:
+91.8%
Connecticut:
+97.8%
Income statistics for Hispanic or Latino residents
Median household income in Torrington, CT in 2022:
Torrington:
$58,738
Connecticut:
$60,275
Change in median household income between 2000 and 2022:
Torrington, Connecticut:
+82.9%
State:
+87.9%
Number of households with income < $10k:
Torrington:
0.0% (0)
State:
8.7% (18,584)
Number of households with income $10k - 20k:
Torrington:
12.4% (260)
State:
9.1% (19,235)
Number of households with income $20k - 30k:
Torrington:
17.2% (360)
Connecticut:
8.9% (18,989)
Number of households with income $30k - 40k:
Torrington:
3.9% (81)
State:
7.5% (15,967)
Number of households with income $40k - 50k:
Torrington:
11.0% (231)
State:
8.7% (18,466)
Number of households with income $50k - 60k:
Torrington:
6.3% (132)
Connecticut:
6.9% (14,706)
Number of households with income $60k - 75k:
Torrington:
9.7% (203)
Connecticut:
8.9% (18,888)
Number of households with income $75k - 100k:
Torrington:
22.2% (465)
State:
13.5% (28,669)
Number of households with income $100k - 125k:
Torrington:
2.3% (49)
Connecticut:
8.2% (17,434)
Number of households with income $125k - 150k:
Torrington:
4.9% (103)
Connecticut:
6.5% (13,752)
Number of households with income $150k - 200k:
Torrington:
7.5% (157)
State:
6.6% (14,114)
Number of households with income > $200k:
Torrington:
2.5% (53)
State:
6.4% (13,630)
Aggregate household income in Torrington in 2022: $145,492,082
Median family income in Torrington in 2022:
Torrington:
$71,159
State:
$68,336
Number of families with income < $10k:
Torrington:
3.1% (44)
Connecticut:
5.2% (7,456)
Number of families with income $10k - 20k:
Torrington:
8.9% (127)
State:
6.0% (8,616)
Number of families with income $20k - 30k:
Torrington:
13.0% (186)
State:
8.9% (12,680)
Number of families with income $30k - 40k:
Torrington:
4.5% (64)
State:
8.5% (12,090)
Number of families with income $40k - 50k:
Torrington:
6.8% (97)
State:
8.8% (12,624)
Number of families with income $50k - 60k:
Torrington:
2.7% (39)
State:
8.4% (11,924)
Number of families with income $60k - 75k:
Torrington:
17.2% (245)
State:
8.9% (12,677)
Number of families with income $75k - 100k:
Torrington:
19.6% (280)
Connecticut:
14.3% (20,457)
Number of families with income $100k - 125k:
Torrington:
5.2% (74)
State:
8.2% (11,720)
Number of families with income $125k - 150k:
Torrington:
9.8% (140)
Connecticut:
8.2% (11,729)
Number of families with income $150k - 200k:
Torrington:
5.9% (84)
State:
7.1% (10,096)
Number of families with income > $200k:
Torrington:
3.5% (50)
State:
7.4% (10,622)
Median non-family income in Torrington in 2022:
Torrington:
$35,123
State:
$36,714
Change in median non-family income between 2000 and 2022:
Torrington, Connecticut:
+33.5%
State:
+90.0%
Median per capita income in Torrington in 2022:
Torrington:
$22,554
State:
$28,507
Change in median per capita income between 2000 and 2022:
Torrington, Connecticut:
+93.0%
Connecticut:
+117.2%
Income statistics for American Indian and Alaska Native residents
Median household income in Torrington, CT in 2022:
Torrington:
$21,383
Connecticut:
$41,848
Change in median household income between 2000 and 2022:
Torrington, Connecticut:
+44.3%
State:
+12.9%
Number of households with income < $10k:
Torrington:
0.0% (0)
Connecticut:
10.2% (340)
Number of households with income $10k - 20k:
Torrington:
0.0% (0)
Connecticut:
8.5% (283)
Number of households with income $20k - 30k:
Torrington:
71.1% (32)
Connecticut:
9.4% (314)
Number of households with income $30k - 40k:
Torrington:
0.0% (0)
State:
10.1% (337)
Number of households with income $40k - 50k:
Torrington:
26.7% (12)
Connecticut:
13.4% (447)
Number of households with income $50k - 60k:
Torrington:
0.0% (0)
State:
3.1% (104)
Number of households with income $60k - 75k:
Torrington:
0.0% (0)
State:
5.6% (188)
Number of households with income $75k - 100k:
Torrington:
2.2% (1)
Connecticut:
13.4% (447)
Number of households with income $100k - 125k:
Torrington:
0.0% (0)
Connecticut:
9.5% (317)
Number of households with income $125k - 150k:
Torrington:
0.0% (0)
State:
3.9% (131)
Number of households with income $150k - 200k:
Torrington:
0.0% (0)
Connecticut:
6.3% (212)
Number of households with income > $200k:
Torrington:
0.0% (0)
State:
6.8% (228)
Aggregate household income in Torrington in 2022: $1,059,911
Median per capita income in Torrington in 2022:
Torrington:
$12,498
State:
$25,355
Change in median per capita income between 2000 and 2022:
Torrington, Connecticut:
+39.8%
State:
+39.4%
Income statistics for Multirace residents
Median household income in Torrington, CT in 2022:
Torrington:
$78,908
State:
$77,277
Change in median household income between 2000 and 2022:
Torrington, Connecticut:
+124.2%
State:
+113.6%
Number of households with income < $10k:
Torrington:
8.9% (115)
State:
6.0% (7,457)
Number of households with income $10k - 20k:
Torrington:
2.3% (30)
Connecticut:
8.1% (10,139)
Number of households with income $20k - 30k:
Torrington:
6.8% (87)
State:
7.0% (8,702)
Number of households with income $30k - 40k:
Torrington:
7.1% (91)
Connecticut:
6.9% (8,546)
Number of households with income $40k - 50k:
Torrington:
6.8% (88)
Connecticut:
7.0% (8,712)
Number of households with income $50k - 60k:
Torrington:
0.0% (0)
Connecticut:
5.9% (7,331)
Number of households with income $60k - 75k:
Torrington:
16.9% (218)
Connecticut:
8.5% (10,634)
Number of households with income $75k - 100k:
Torrington:
24.0% (309)
Connecticut:
14.1% (17,600)
Number of households with income $100k - 125k:
Torrington:
8.6% (111)
Connecticut:
9.9% (12,383)
Number of households with income $125k - 150k:
Torrington:
10.8% (139)
State:
7.2% (8,921)
Number of households with income $150k - 200k:
Torrington:
2.3% (29)
Connecticut:
8.8% (10,922)
Number of households with income > $200k:
Torrington:
5.5% (71)
State:
10.6% (13,247)
Aggregate household income in Torrington in 2022: $105,357,274
Median family income in Torrington in 2022:
Torrington:
$70,554
State:
$84,255
Number of families with income $10k - 20k:
Torrington:
3.0% (28)
State:
4.8% (4,079)
Number of families with income $20k - 30k:
Torrington:
8.8% (81)
Connecticut:
6.9% (5,812)
Number of families with income $30k - 40k:
Torrington:
8.5% (79)
Connecticut:
6.8% (5,759)
Number of families with income $40k - 50k:
Torrington:
9.1% (84)
State:
6.9% (5,792)
Number of families with income $60k - 75k:
Torrington:
30.3% (281)
State:
7.8% (6,550)
Number of families with income $75k - 100k:
Torrington:
4.0% (37)
Connecticut:
14.5% (12,236)
Number of families with income $100k - 125k:
Torrington:
10.8% (100)
Connecticut:
9.2% (7,787)
Number of families with income $125k - 150k:
Torrington:
16.3% (151)
State:
8.9% (7,503)
Number of families with income $150k - 200k:
Torrington:
1.2% (11)
State:
9.3% (7,818)
Number of families with income > $200k:
Torrington:
7.9% (73)
State:
13.7% (11,603)
Median per capita income in Torrington in 2022:
Torrington:
$28,011
Connecticut:
$32,794
Change in median per capita income between 2000 and 2022:
Torrington, Connecticut:
+93.2%
State:
+117.2%
Income statistics for other residents
Median household income in Torrington, CT in 2022:
Torrington:
$67,909
Connecticut:
$59,588
Number of households with income < $10k:
Torrington:
0.0% (0)
State:
9.0% (8,596)
Number of households with income $10k - 20k:
Torrington:
19.6% (149)
State:
10.2% (9,773)
Number of households with income $20k - 30k:
Torrington:
11.9% (90)
State:
9.1% (8,691)
Number of households with income $30k - 40k:
Torrington:
4.6% (35)
State:
7.8% (7,447)
Number of households with income $40k - 50k:
Torrington:
3.0% (23)
State:
8.2% (7,860)
Number of households with income $50k - 60k:
Torrington:
7.2% (55)
State:
6.0% (5,757)
Number of households with income $60k - 75k:
Torrington:
15.2% (115)
Connecticut:
9.3% (8,942)
Number of households with income $75k - 100k:
Torrington:
23.1% (175)
Connecticut:
14.3% (13,700)
Number of households with income $100k - 125k:
Torrington:
6.9% (52)
State:
7.2% (6,906)
Number of households with income $125k - 150k:
Torrington:
0.0% (0)
State:
6.5% (6,215)
Number of households with income $150k - 200k:
Torrington:
6.6% (50)
State:
6.1% (5,865)
Number of households with income > $200k:
Torrington:
2.0% (15)
State:
6.3% (6,065)
Aggregate household income in Torrington in 2022: $54,092,486
Median family income in Torrington in 2022:
Torrington:
$80,591
Connecticut:
$67,610
Number of families with income $10k - 20k:
Torrington:
7.8% (42)
Connecticut:
7.5% (4,961)
Number of families with income $20k - 30k:
Torrington:
12.6% (68)
Connecticut:
8.7% (5,752)
Number of families with income $30k - 40k:
Torrington:
5.1% (27)
Connecticut:
9.1% (5,996)
Number of families with income $50k - 60k:
Torrington:
6.4% (34)
Connecticut:
5.9% (3,868)
Number of families with income $60k - 75k:
Torrington:
15.2% (82)
State:
9.4% (6,232)
Number of families with income $75k - 100k:
Torrington:
31.0% (167)
State:
15.7% (10,362)
Number of families with income $100k - 125k:
Torrington:
8.4% (45)
Connecticut:
6.8% (4,502)
Number of families with income $125k - 150k:
Torrington:
8.8% (47)
State:
9.0% (5,971)
Number of families with income $150k - 200k:
Torrington:
2.2% (12)
State:
6.6% (4,339)
Number of families with income > $200k:
Torrington:
2.6% (14)
Connecticut:
7.1% (4,717)
Median per capita income in Torrington in 2022:
Torrington:
$29,363
Connecticut:
$29,353
Discuss Torrington, Connecticut (CT) on our hugely popular Connecticut forum.