The median household income in Tioga, TX in 2022 was $73,532, which was about the same as the median annual income of $72,284 across the entire state of Texas. Compared to the median income of $37,153 in 2000 this represents an increase of 49.5%. The per capita income in 2022 was $38,233, which means an increase of 54.6% compared to 2000 when it was $17,373.
Whole page based on the data from 2000 / 2022 when the population of Tioga, Texas was 754 / 1,132
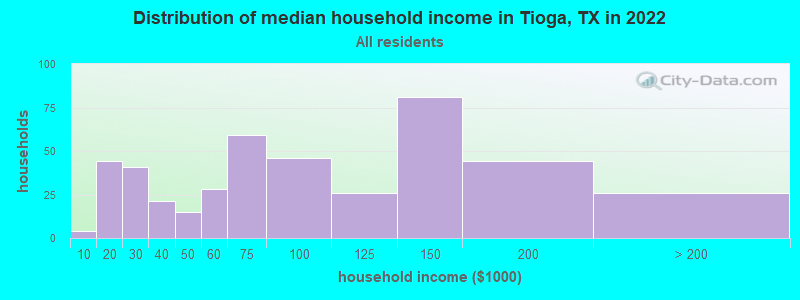
Income statistics for all residents
Median household income in Tioga, TX in 2022:
Tioga:
$73,533
State:
$72,284
Change in median household income between 2000 and 2022:
Tioga, Texas:
+97.9%
Texas:
+81.0%
Number of households with income < $10k:
Tioga:
0.9% (4)
State:
5.5% (611,011)
Number of households with income $10k - 20k:
Tioga:
10.1% (44)
Texas:
6.7% (743,157)
Number of households with income $20k - 30k:
Tioga:
9.4% (41)
State:
7.2% (803,381)
Number of households with income $30k - 40k:
Tioga:
4.8% (21)
State:
7.8% (866,080)
Number of households with income $40k - 50k:
Tioga:
3.4% (15)
State:
7.3% (810,440)
Number of households with income $50k - 60k:
Tioga:
6.4% (28)
State:
7.2% (799,783)
Number of households with income $60k - 75k:
Tioga:
13.6% (59)
State:
9.9% (1,095,384)
Number of households with income $75k - 100k:
Tioga:
10.6% (46)
Texas:
12.8% (1,419,057)
Number of households with income $100k - 125k:
Tioga:
6.0% (26)
State:
9.5% (1,054,577)
Number of households with income $125k - 150k:
Tioga:
18.6% (81)
State:
6.7% (741,518)
Number of households with income $150k - 200k:
Tioga:
10.1% (44)
State:
8.7% (961,776)
Number of households with income > $200k:
Tioga:
6.0% (26)
State:
10.7% (1,181,544)
Aggregate household income in Tioga in 2022: $40,794,212
Median family income in Tioga in 2022:
Tioga:
$101,425
State:
$86,267
Number of families with income $10k - 20k:
Tioga:
8.2% (26)
Texas:
4.3% (324,514)
Number of families with income $20k - 30k:
Tioga:
5.8% (18)
State:
5.8% (430,949)
Number of families with income $30k - 40k:
Tioga:
1.5% (5)
State:
6.6% (493,535)
Number of families with income $40k - 50k:
Tioga:
1.9% (6)
Texas:
6.7% (499,663)
Number of families with income $50k - 60k:
Tioga:
3.1% (10)
Texas:
6.6% (492,203)
Number of families with income $60k - 75k:
Tioga:
13.0% (41)
State:
9.5% (710,229)
Number of families with income $75k - 100k:
Tioga:
14.9% (47)
Texas:
13.6% (1,015,480)
Number of families with income $100k - 125k:
Tioga:
8.9% (28)
Texas:
10.7% (797,961)
Number of families with income $125k - 150k:
Tioga:
22.8% (72)
State:
8.1% (602,985)
Number of families with income $150k - 200k:
Tioga:
11.0% (35)
State:
10.7% (804,459)
Number of families with income > $200k:
Tioga:
8.9% (28)
State:
13.5% (1,013,514)
Median non-family income in Tioga in 2022:
Tioga:
$43,226
State:
$45,999
Change in median non-family income between 2000 and 2022:
Tioga, Texas:
+68.1%
State:
+79.5%
Median per capita income in Tioga in 2022:
Tioga:
$38,233
State:
$38,123
Change in median per capita income between 2000 and 2022:
Tioga, Texas:
+120.1%
State:
+94.3%
Income statistics for White residents
Median household income in Tioga, TX in 2022:
Tioga:
$73,360
State:
$82,032
Change in median household income between 2000 and 2022:
Tioga, Texas:
+92.0%
State:
+91.0%
Number of households with income < $10k:
Tioga:
1.0% (4)
State:
4.7% (273,716)
Number of households with income $10k - 20k:
Tioga:
8.7% (34)
Texas:
5.5% (322,702)
Number of households with income $20k - 30k:
Tioga:
10.7% (42)
State:
6.2% (363,947)
Number of households with income $30k - 40k:
Tioga:
5.4% (21)
Texas:
6.8% (399,275)
Number of households with income $40k - 50k:
Tioga:
3.6% (14)
Texas:
6.5% (383,417)
Number of households with income $50k - 60k:
Tioga:
6.1% (24)
Texas:
6.6% (388,535)
Number of households with income $60k - 75k:
Tioga:
12.3% (48)
State:
9.7% (566,295)
Number of households with income $75k - 100k:
Tioga:
10.0% (39)
State:
13.0% (760,276)
Number of households with income $100k - 125k:
Tioga:
6.6% (26)
Texas:
10.2% (597,596)
Number of households with income $125k - 150k:
Tioga:
19.9% (78)
State:
7.4% (436,830)
Number of households with income $150k - 200k:
Tioga:
10.2% (40)
Texas:
9.9% (583,067)
Number of households with income > $200k:
Tioga:
5.4% (21)
Texas:
13.5% (792,647)
Aggregate household income in Tioga in 2022: $35,638,922
Median family income in Tioga in 2022:
Tioga:
$104,278
State:
$101,788
Number of families with income $10k - 20k:
Tioga:
9.4% (28)
State:
2.9% (113,421)
Number of families with income $20k - 30k:
Tioga:
7.1% (21)
State:
4.1% (157,688)
Number of families with income $30k - 40k:
Tioga:
1.1% (3)
State:
5.2% (198,847)
Number of families with income $40k - 50k:
Tioga:
2.2% (6)
Texas:
5.6% (216,490)
Number of families with income $50k - 60k:
Tioga:
2.7% (8)
State:
5.7% (220,689)
Number of families with income $60k - 75k:
Tioga:
11.3% (33)
State:
9.0% (346,106)
Number of families with income $75k - 100k:
Tioga:
13.4% (39)
State:
13.7% (527,363)
Number of families with income $100k - 125k:
Tioga:
10.1% (30)
State:
11.6% (448,411)
Number of families with income $125k - 150k:
Tioga:
24.5% (72)
Texas:
9.2% (355,798)
Number of families with income $150k - 200k:
Tioga:
10.5% (31)
State:
12.5% (480,185)
Number of families with income > $200k:
Tioga:
7.7% (23)
State:
17.6% (677,490)
Median non-family income in Tioga in 2022:
Tioga:
$49,089
State:
$50,587
Change in median non-family income between 2000 and 2022:
Tioga, Texas:
+83.3%
State:
+87.7%
Median per capita income in Tioga in 2022:
Tioga:
$36,716
Texas:
$47,740
Change in median per capita income between 2000 and 2022:
Tioga, Texas:
+106.2%
Texas:
+114.3%
Income statistics for Asian residents
Aggregate household income in Tioga in 2022: $874,169
Median per capita income in Tioga in 2022:
Tioga:
$9,414
State:
$48,626
Change in median per capita income between 2000 and 2022:: -31.8%
Tioga, Texas:
-31.8%
State:
+132.0%
Income statistics for Hispanic or Latino residents
Median household income in Tioga, TX in 2022:
Tioga:
$48,543
State:
$60,504
Change in median household income between 2000 and 2022:
Tioga, Texas:
+89.4%
State:
+102.5%
Number of households with income < $10k:
Tioga:
0.0% (0)
State:
5.8% (213,953)
Number of households with income $10k - 20k:
Tioga:
31.0% (9)
State:
8.0% (297,456)
Number of households with income $20k - 30k:
Tioga:
10.3% (3)
State:
9.2% (340,166)
Number of households with income $30k - 40k:
Tioga:
0.0% (0)
State:
9.5% (354,336)
Number of households with income $40k - 50k:
Tioga:
0.0% (0)
State:
8.8% (327,013)
Number of households with income $50k - 60k:
Tioga:
13.8% (4)
Texas:
8.3% (308,818)
Number of households with income $60k - 75k:
Tioga:
17.2% (5)
State:
10.9% (405,109)
Number of households with income $75k - 100k:
Tioga:
27.6% (8)
State:
13.8% (511,639)
Number of households with income $100k - 125k:
Tioga:
0.0% (0)
State:
8.6% (319,728)
Number of households with income $125k - 150k:
Tioga:
0.0% (0)
State:
5.7% (210,932)
Number of households with income $150k - 200k:
Tioga:
0.0% (0)
State:
6.4% (236,055)
Number of households with income > $200k:
Tioga:
0.0% (0)
State:
5.1% (189,259)
Aggregate household income in Tioga in 2022: $1,926,117
Median family income in Tioga in 2022:
Tioga:
$48,481
State:
$65,080
Number of families with income $10k - 20k:
Tioga:
35.2% (9)
State:
6.3% (174,531)
Number of families with income $50k - 60k:
Tioga:
15.6% (4)
Texas:
8.0% (223,566)
Number of families with income $60k - 75k:
Tioga:
20.3% (5)
State:
10.9% (302,688)
Number of families with income $75k - 100k:
Tioga:
29.0% (8)
State:
14.3% (398,554)
Median per capita income in Tioga in 2022:
Tioga:
$18,047
State:
$24,862
Change in median per capita income between 2000 and 2022:
Tioga, Texas:
+68.0%
Texas:
+130.8%
Income statistics for American Indian and Alaska Native residents
Median per capita income in Tioga in 2022:
Tioga:
$62,496
State:
$28,166
Income statistics for Multirace residents
Aggregate household income in Tioga in 2022: $1,174,621
Median per capita income in Tioga in 2022:
Tioga:
$49,015
State:
$26,785
Income statistics for other residents
Aggregate household income in Tioga in 2022: $1,471,460
Median per capita income in Tioga in 2022:
Tioga:
$49,424
State:
$23,899
Discuss Tioga, Texas (TX) on our hugely popular Texas forum.