The median household income in Tarlton, OH in 2022 was $73,578, which was 10.7% greater than the median annual income of $65,720 across the entire state of Ohio. Compared to the median income of $31,875 in 2000 this represents an increase of 56.7%. The per capita income in 2022 was $30,750, which means an increase of 56.5% compared to 2000 when it was $13,379.
Whole page based on the data from 2000 / 2022 when the population of Tarlton, Ohio was 298 / 266
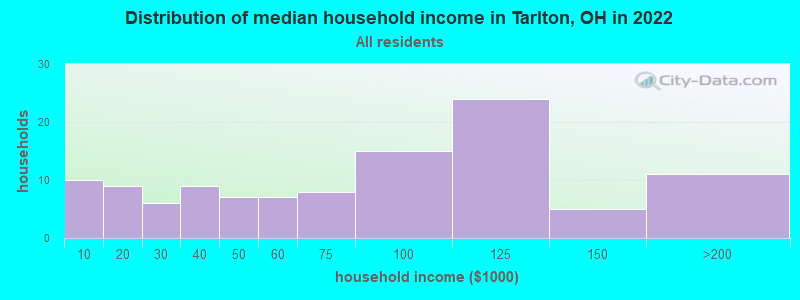
Income statistics for all residents
Median household income in Tarlton, OH in 2022:
Tarlton:
$73,578
State:
$65,720
Change in median household income between 2000 and 2022:
Tarlton, Ohio:
+130.8%
State:
+60.5%
Number of households with income < $10k:
Tarlton:
9.0% (10)
State:
5.9% (286,511)
Number of households with income $10k - 20k:
Tarlton:
8.1% (9)
State:
8.0% (392,234)
Number of households with income $20k - 30k:
Tarlton:
5.4% (6)
Ohio:
7.8% (380,130)
Number of households with income $30k - 40k:
Tarlton:
8.1% (9)
State:
8.3% (405,713)
Number of households with income $40k - 50k:
Tarlton:
6.3% (7)
State:
8.0% (388,158)
Number of households with income $50k - 60k:
Tarlton:
6.3% (7)
State:
7.7% (378,045)
Number of households with income $60k - 75k:
Tarlton:
7.2% (8)
State:
10.0% (488,380)
Number of households with income $75k - 100k:
Tarlton:
13.5% (15)
State:
13.2% (643,774)
Number of households with income $100k - 125k:
Tarlton:
21.6% (24)
State:
9.6% (467,137)
Number of households with income $125k - 150k:
Tarlton:
4.5% (5)
Ohio:
6.4% (314,382)
Number of households with income $150k - 200k:
Tarlton:
9.9% (11)
Ohio:
7.4% (359,847)
Number of households with income > $200k:
Tarlton:
0.0% (0)
Ohio:
7.7% (373,895)
Aggregate household income in Tarlton in 2022: $8,303,407
Median family income in Tarlton in 2022:
Tarlton:
$96,618
State:
$86,001
Number of families with income < $10k:
Tarlton:
7.2% (6)
State:
3.6% (107,748)
Number of families with income $20k - 30k:
Tarlton:
6.2% (5)
State:
4.9% (147,509)
Number of families with income $30k - 40k:
Tarlton:
2.6% (2)
Ohio:
6.3% (189,350)
Number of families with income $40k - 50k:
Tarlton:
2.6% (2)
Ohio:
6.8% (201,952)
Number of families with income $50k - 60k:
Tarlton:
8.1% (6)
State:
7.2% (216,119)
Number of families with income $60k - 75k:
Tarlton:
5.2% (4)
State:
10.0% (298,584)
Number of families with income $75k - 100k:
Tarlton:
19.5% (15)
State:
15.1% (449,004)
Number of families with income $100k - 125k:
Tarlton:
28.0% (22)
State:
12.0% (357,739)
Number of families with income $125k - 150k:
Tarlton:
6.3% (5)
State:
8.7% (258,363)
Number of families with income $150k - 200k:
Tarlton:
14.4% (11)
Ohio:
10.4% (308,871)
Median income for families with 0 earners:
Tarlton:
$0
Ohio:
$47,302
Median income for families with 1 earner:
Tarlton:
$0
State:
$59,181
Median income for families with 2 earners:
Tarlton:
$101,155
State:
$112,030
Median income for families with 3+ earners:
Tarlton:
$0
State:
$140,567
Median non-family income in Tarlton in 2022:
Tarlton:
$29,809
Ohio:
$40,164
Change in median non-family income between 2000 and 2022:
Tarlton, Ohio:
+78.9%
State:
+67.3%
Median per capita income in Tarlton in 2022:
Tarlton:
$30,751
Ohio:
$37,932
Change in median per capita income between 2000 and 2022:
Tarlton, Ohio:
+129.8%
Ohio:
+80.6%
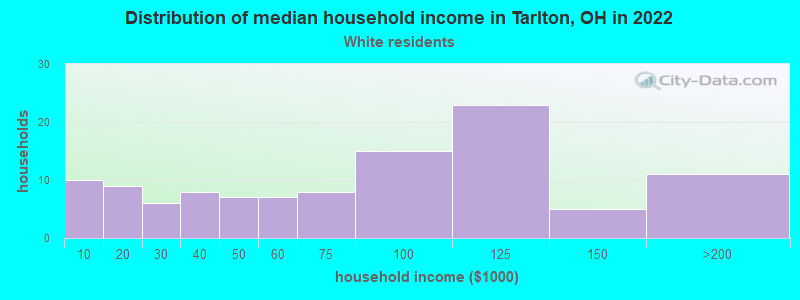
Income statistics for White residents
Median household income in Tarlton, OH in 2022:
Tarlton:
$76,935
Ohio:
$70,749
Change in median household income between 2000 and 2022:
Tarlton, Ohio:
+141.4%
State:
+65.2%
Number of households with income < $10k:
Tarlton:
9.2% (10)
State:
4.6% (178,598)
Number of households with income $10k - 20k:
Tarlton:
8.3% (9)
State:
7.2% (279,908)
Number of households with income $20k - 30k:
Tarlton:
5.5% (6)
State:
7.3% (285,935)
Number of households with income $30k - 40k:
Tarlton:
7.3% (8)
State:
8.0% (310,871)
Number of households with income $40k - 50k:
Tarlton:
6.4% (7)
State:
7.8% (303,221)
Number of households with income $50k - 60k:
Tarlton:
6.4% (7)
State:
7.7% (297,864)
Number of households with income $60k - 75k:
Tarlton:
7.3% (8)
State:
10.2% (395,379)
Number of households with income $75k - 100k:
Tarlton:
13.8% (15)
Ohio:
13.8% (538,093)
Number of households with income $100k - 125k:
Tarlton:
21.1% (23)
Ohio:
10.1% (394,658)
Number of households with income $125k - 150k:
Tarlton:
4.6% (5)
Ohio:
7.0% (272,471)
Number of households with income $150k - 200k:
Tarlton:
10.1% (11)
State:
8.0% (312,939)
Number of households with income > $200k:
Tarlton:
0.0% (0)
State:
8.3% (321,654)
Aggregate household income in Tarlton in 2022: $8,095,439
Median family income in Tarlton in 2022:
Tarlton:
$96,839
State:
$91,556
Number of families with income < $10k:
Tarlton:
7.2% (5)
State:
2.6% (62,772)
Number of families with income $20k - 30k:
Tarlton:
6.4% (5)
Ohio:
4.3% (102,470)
Number of families with income $30k - 40k:
Tarlton:
2.5% (2)
State:
5.8% (139,122)
Number of families with income $40k - 50k:
Tarlton:
2.6% (2)
State:
6.4% (152,812)
Number of families with income $50k - 60k:
Tarlton:
7.9% (6)
Ohio:
7.0% (167,384)
Number of families with income $60k - 75k:
Tarlton:
5.2% (4)
State:
10.2% (245,177)
Number of families with income $75k - 100k:
Tarlton:
19.5% (15)
State:
15.6% (375,564)
Number of families with income $100k - 125k:
Tarlton:
28.0% (21)
Ohio:
12.6% (303,754)
Number of families with income $125k - 150k:
Tarlton:
6.3% (5)
Ohio:
9.3% (224,334)
Number of families with income $150k - 200k:
Tarlton:
14.4% (11)
State:
11.2% (268,546)
Median non-family income in Tarlton in 2022:
Tarlton:
$29,105
Ohio:
$42,037
Change in median non-family income between 2000 and 2022:
Tarlton, Ohio:
+74.6%
State:
+68.0%
Median per capita income in Tarlton in 2022:
Tarlton:
$30,824
Ohio:
$40,927
Change in median per capita income between 2000 and 2022:
Tarlton, Ohio:
+126.4%
Ohio:
+85.3%
Discuss Tarlton, Ohio (OH) on our hugely popular Ohio forum.