Sterling, Connecticut (CT) income map, earnings map, and wages data
The median household income in Sterling, CT in 2022 was $83,197, which was 6.3% less than the median annual income of $88,429 across the entire state of Connecticut. Compared to the median income of $49,167 in 2000 this represents an increase of 40.9%. The per capita income in 2022 was $35,998, which means an increase of 45.3% compared to 2000 when it was $19,679.
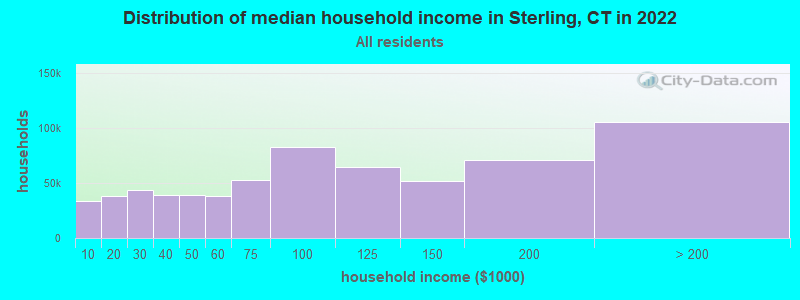
Income statistics for all residents
Median household income in Sterling, CT in 2022:| Sterling: | $83,197 |
| Connecticut: | $88,429 |
Change in median household income between 2000 and 2022:| Sterling, Connecticut: | +69.2% |
| State: | +64.0% |
Number of households with income < $10k:| Sterling: | 5.2% (33,888) |
| State: | 5.1% (72,746) |
Number of households with income $10k - 20k:| Sterling: | 5.8% (38,214) |
| State: | 5.7% (81,643) |
Number of households with income $20k - 30k:| Sterling: | 6.6% (43,255) |
| State: | 6.5% (92,844) |
Number of households with income $30k - 40k:| Sterling: | 5.9% (38,818) |
| State: | 5.9% (83,934) |
Number of households with income $40k - 50k:| Sterling: | 5.9% (38,568) |
| Connecticut: | 5.8% (83,025) |
Number of households with income $50k - 60k:| Sterling: | 5.8% (37,819) |
| State: | 5.7% (81,788) |
Number of households with income $60k - 75k:| Sterling: | 8.1% (52,989) |
| Connecticut: | 8.1% (115,651) |
Number of households with income $75k - 100k:| Sterling: | 12.6% (82,758) |
| Connecticut: | 12.6% (180,173) |
Number of households with income $100k - 125k:| Sterling: | 9.8% (64,426) |
| Connecticut: | 9.9% (141,231) |
Number of households with income $125k - 150k:| Sterling: | 7.8% (51,450) |
| Connecticut: | 7.9% (112,826) |
Number of households with income $150k - 200k:| Sterling: | 10.7% (70,380) |
| State: | 10.8% (154,641) |
Number of households with income > $200k:| Sterling: | 16.0% (105,143) |
| State: | 16.3% (233,133) |
Aggregate household income in Sterling in 2022: $2,555,828,239
Median family income in Sterling in 2022:| Sterling: | $93,232 |
| Connecticut: | $115,183 |
Median non-family income in Sterling in 2022:| Sterling: | $58,050 |
| Connecticut: | $50,964 |
Change in median non-family income between 2000 and 2022:| Sterling, Connecticut: | +71.5% |
| State: | +65.1% |
Median per capita income in Sterling in 2022:| Sterling: | $35,999 |
| State: | $51,581 |
Change in median per capita income between 2000 and 2022:| Sterling, Connecticut: | +82.9% |
| State: | +79.3% |
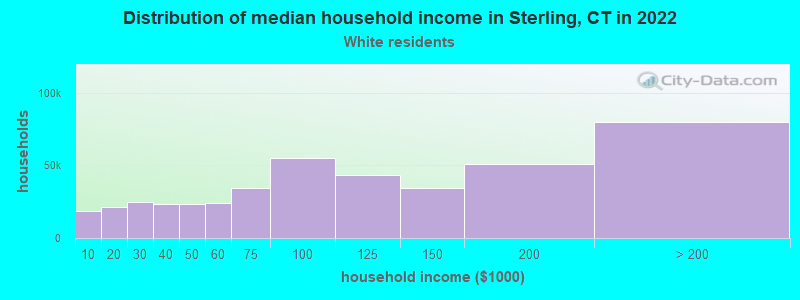
Income statistics for White residents
Median household income in Sterling, CT in 2022:| Sterling: | $83,707 |
| State: | $96,890 |
Change in median household income between 2000 and 2022:| Sterling, Connecticut: | +69.4% |
| State: | +68.5% |
Number of households with income < $10k:| Sterling: | 4.2% (18,308) |
| State: | 4.2% (42,265) |
Number of households with income $10k - 20k:| Sterling: | 4.9% (21,049) |
| Connecticut: | 4.8% (48,323) |
Number of households with income $20k - 30k:| Sterling: | 5.8% (25,033) |
| State: | 5.7% (57,716) |
Number of households with income $30k - 40k:| Sterling: | 5.4% (23,172) |
| State: | 5.3% (53,827) |
Number of households with income $40k - 50k:| Sterling: | 5.3% (23,076) |
| State: | 5.3% (53,301) |
Number of households with income $50k - 60k:| Sterling: | 5.6% (24,015) |
| Connecticut: | 5.5% (55,690) |
Number of households with income $60k - 75k:| Sterling: | 7.9% (34,319) |
| State: | 8.0% (80,329) |
Number of households with income $75k - 100k:| Sterling: | 12.7% (54,992) |
| Connecticut: | 12.7% (128,070) |
Number of households with income $100k - 125k:| Sterling: | 10.0% (43,182) |
| State: | 10.0% (101,210) |
Number of households with income $125k - 150k:| Sterling: | 8.0% (34,667) |
| Connecticut: | 8.0% (81,250) |
Number of households with income $150k - 200k:| Sterling: | 11.8% (50,975) |
| State: | 11.8% (119,527) |
Number of households with income > $200k:| Sterling: | 18.4% (79,799) |
| State: | 18.6% (187,875) |
Aggregate household income in Sterling in 2022: $1,878,584,047
Median family income in Sterling in 2022:| Sterling: | $96,878 |
| Connecticut: | $128,955 |
Number of families with income < $10k:| Sterling: | 2.1% (9) |
| State: | 1.9% (11,537) |
Number of families with income $10k - 20k:| Sterling: | 5.7% (25) |
| State: | 1.8% (11,289) |
Number of families with income $20k - 30k:| Sterling: | 8.0% (35) |
| Connecticut: | 3.0% (18,506) |
Number of families with income $30k - 40k:| Sterling: | 8.8% (38) |
| State: | 2.9% (18,160) |
Number of families with income $40k - 50k:| Sterling: | 9.7% (42) |
| Connecticut: | 3.9% (24,550) |
Number of families with income $50k - 60k:| Sterling: | 7.3% (31) |
| State: | 4.3% (26,723) |
Number of families with income $60k - 75k:| Sterling: | 16.0% (69) |
| Connecticut: | 7.1% (44,075) |
Number of families with income $75k - 100k:| Sterling: | 18.7% (80) |
| State: | 12.5% (77,679) |
Number of families with income $100k - 125k:| Sterling: | 9.5% (41) |
| State: | 11.1% (69,086) |
Number of families with income $125k - 150k:| Sterling: | 2.7% (12) |
| Connecticut: | 9.6% (59,616) |
Number of families with income $150k - 200k:| Sterling: | 11.5% (50) |
| State: | 15.7% (97,890) |
Median non-family income in Sterling in 2022:| Sterling: | $58,976 |
| State: | $54,067 |
Change in median non-family income between 2000 and 2022:| Sterling, Connecticut: | +73.7% |
| State: | +68.7% |
Median per capita income in Sterling in 2022:| Sterling: | $37,542 |
| Connecticut: | $59,916 |
Change in median per capita income between 2000 and 2022:| Sterling, Connecticut: | +92.1% |
| Connecticut: | +90.2% |
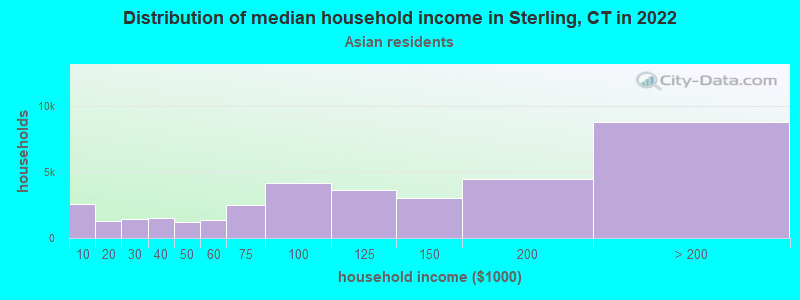
Income statistics for Asian residents
Median household income in Sterling, CT in 2022:| Sterling: | $77,470 |
| State: | $110,568 |
Change in median household income between 2000 and 2022:| Sterling, Connecticut: | +110.1% |
| State: | +79.5% |
Number of households with income < $10k:| Sterling: | 7.1% (2,542) |
| State: | 7.1% (4,245) |
Number of households with income $10k - 20k:| Sterling: | 3.5% (1,250) |
| State: | 3.5% (2,087) |
Number of households with income $20k - 30k:| Sterling: | 4.1% (1,475) |
| Connecticut: | 4.1% (2,464) |
Number of households with income $30k - 40k:| Sterling: | 4.1% (1,484) |
| State: | 4.1% (2,478) |
Number of households with income $40k - 50k:| Sterling: | 3.3% (1,188) |
| State: | 3.3% (1,983) |
Number of households with income $50k - 60k:| Sterling: | 3.9% (1,394) |
| State: | 3.9% (2,328) |
Number of households with income $60k - 75k:| Sterling: | 7.0% (2,532) |
| State: | 7.0% (4,228) |
Number of households with income $75k - 100k:| Sterling: | 11.5% (4,138) |
| State: | 11.5% (6,911) |
Number of households with income $100k - 125k:| Sterling: | 10.2% (3,669) |
| Connecticut: | 10.2% (6,127) |
Number of households with income $125k - 150k:| Sterling: | 8.5% (3,041) |
| State: | 8.5% (5,079) |
Number of households with income $150k - 200k:| Sterling: | 12.4% (4,451) |
| State: | 12.4% (7,434) |
Number of households with income > $200k:| Sterling: | 24.4% (8,778) |
| Connecticut: | 24.4% (14,661) |
Aggregate household income in Sterling in 2022: $4,429,145
Median family income in Sterling in 2022:| Sterling: | $76,630 |
| State: | $134,548 |
Number of families with income $30k - 40k:| Sterling: | 20.0% (7) |
| State: | 3.8% (1,652) |
Number of families with income > $200k:| Sterling: | 80.0% (27) |
| Connecticut: | 30.8% (13,522) |
Median per capita income in Sterling in 2022:| Sterling: | $97,340 |
| State: | $55,295 |
Change in median per capita income between 2000 and 2022:| Sterling, Connecticut: | +103.6% |
| State: | +97.8% |
Income statistics for Hispanic or Latino residents
Number of households with income < $10k:| Sterling: | 8.7% (11,394) |
| State: | 8.7% (18,584) |
Number of households with income $10k - 20k:| Sterling: | 9.1% (11,793) |
| State: | 9.1% (19,235) |
Number of households with income $20k - 30k:| Sterling: | 8.9% (11,642) |
| Connecticut: | 8.9% (18,989) |
Number of households with income $30k - 40k:| Sterling: | 7.5% (9,789) |
| State: | 7.5% (15,967) |
Number of households with income $40k - 50k:| Sterling: | 8.7% (11,322) |
| Connecticut: | 8.7% (18,466) |
Number of households with income $50k - 60k:| Sterling: | 6.9% (9,017) |
| State: | 6.9% (14,706) |
Number of households with income $60k - 75k:| Sterling: | 8.9% (11,581) |
| State: | 8.9% (18,888) |
Number of households with income $75k - 100k:| Sterling: | 13.5% (17,578) |
| State: | 13.5% (28,669) |
Number of households with income $100k - 125k:| Sterling: | 8.2% (10,689) |
| Connecticut: | 8.2% (17,434) |
Number of households with income $125k - 150k:| Sterling: | 6.5% (8,432) |
| State: | 6.5% (13,752) |
Number of households with income $150k - 200k:| Sterling: | 6.6% (8,654) |
| State: | 6.6% (14,114) |
Number of households with income > $200k:| Sterling: | 6.4% (8,357) |
| Connecticut: | 6.4% (13,630) |
Median per capita income in Sterling in 2022:| Sterling: | $14,509 |
| State: | $28,507 |
Change in median per capita income between 2000 and 2022:| Sterling, Connecticut: | +80.3% |
| State: | +117.2% |
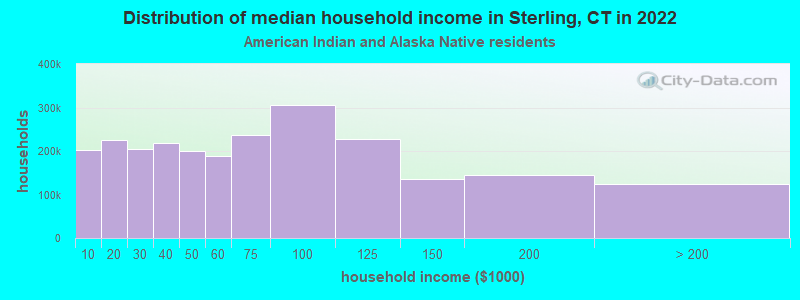
Income statistics for American Indian and Alaska Native residents
Median household income in Sterling, CT in 2022:| Sterling: | $80,416 |
| Connecticut: | $41,848 |
Change in median household income between 2000 and 2022:| Sterling, Connecticut: | +12.9% |
| Connecticut: | +12.9% |
Number of households with income < $10k:| Sterling: | 8.4% (202,603) |
| State: | 10.2% (340) |
Number of households with income $10k - 20k:| Sterling: | 9.4% (226,101) |
| State: | 8.5% (283) |
Number of households with income $20k - 30k:| Sterling: | 8.5% (204,510) |
| State: | 9.4% (314) |
Number of households with income $30k - 40k:| Sterling: | 9.1% (219,108) |
| State: | 10.1% (337) |
Number of households with income $40k - 50k:| Sterling: | 8.3% (200,980) |
| State: | 13.4% (447) |
Number of households with income $50k - 60k:| Sterling: | 7.8% (189,508) |
| Connecticut: | 3.1% (104) |
Number of households with income $60k - 75k:| Sterling: | 9.8% (236,213) |
| Connecticut: | 5.6% (188) |
Number of households with income $75k - 100k:| Sterling: | 12.6% (304,913) |
| State: | 13.4% (447) |
Number of households with income $100k - 125k:| Sterling: | 9.4% (228,014) |
| Connecticut: | 9.5% (317) |
Number of households with income $125k - 150k:| Sterling: | 5.6% (136,511) |
| Connecticut: | 3.9% (131) |
Number of households with income $150k - 200k:| Sterling: | 6.0% (143,909) |
| State: | 6.3% (212) |
Number of households with income > $200k:| Sterling: | 5.2% (124,561) |
| Connecticut: | 6.8% (228) |
Aggregate household income in Sterling in 2022: $356,761
Median family income in Sterling in 2022:| Sterling: | $97,358 |
| State: | $57,217 |
Median per capita income in Sterling in 2022:| Sterling: | $27,436 |
| State: | $25,355 |
Change in median per capita income between 2000 and 2022:| Sterling, Connecticut: | +45.9% |
| Connecticut: | +39.4% |
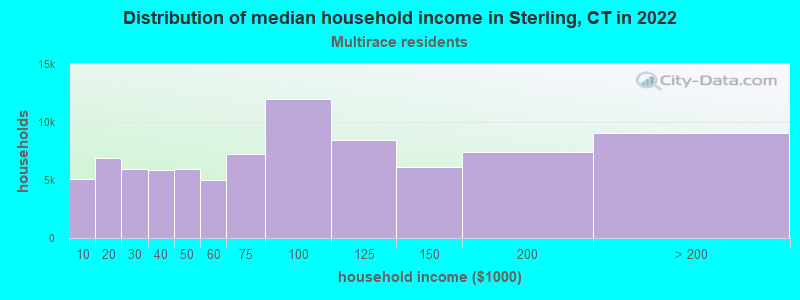
Income statistics for Multirace residents
Median household income in Sterling, CT in 2022:| Sterling: | $54,176 |
| State: | $77,277 |
Change in median household income between 2000 and 2022:| Sterling, Connecticut: | +119.4% |
| State: | +113.6% |
Number of households with income < $10k:| Sterling: | 6.0% (5,088) |
| Connecticut: | 6.0% (7,457) |
Number of households with income $10k - 20k:| Sterling: | 8.1% (6,917) |
| Connecticut: | 8.1% (10,139) |
Number of households with income $20k - 30k:| Sterling: | 7.0% (5,937) |
| State: | 7.0% (8,702) |
Number of households with income $30k - 40k:| Sterling: | 6.9% (5,830) |
| Connecticut: | 6.9% (8,546) |
Number of households with income $40k - 50k:| Sterling: | 7.0% (5,943) |
| State: | 7.0% (8,712) |
Number of households with income $50k - 60k:| Sterling: | 5.9% (5,002) |
| State: | 5.9% (7,331) |
Number of households with income $60k - 75k:| Sterling: | 8.5% (7,255) |
| Connecticut: | 8.5% (10,634) |
Number of households with income $75k - 100k:| Sterling: | 14.1% (12,008) |
| Connecticut: | 14.1% (17,600) |
Number of households with income $100k - 125k:| Sterling: | 9.9% (8,448) |
| State: | 9.9% (12,383) |
Number of households with income $125k - 150k:| Sterling: | 7.2% (6,086) |
| State: | 7.2% (8,921) |
Number of households with income $150k - 200k:| Sterling: | 8.8% (7,452) |
| State: | 8.8% (10,922) |
Number of households with income > $200k:| Sterling: | 10.6% (9,038) |
| Connecticut: | 10.6% (13,247) |
Aggregate household income in Sterling in 2022: $9,922,532
Median family income in Sterling in 2022:| Sterling: | $134,406 |
| State: | $84,255 |
Number of families with income $20k - 30k:| Sterling: | 17.5% (10) |
| Connecticut: | 6.9% (5,812) |
Number of families with income $100k - 125k:| Sterling: | 82.5% (47) |
| State: | 9.2% (7,787) |
Median non-family income in Sterling in 2022:| Sterling: | $13,012 |
| State: | $44,462 |
Change in median non-family income between 2000 and 2022:| Sterling, Connecticut: | +81.0% |
| State: | +97.6% |
Median per capita income in Sterling in 2022:| Sterling: | $39,352 |
| State: | $32,794 |
Change in median per capita income between 2000 and 2022:| Sterling, Connecticut: | +95.5% |
| State: | +117.2% |
Income statistics for other residents
Number of households with income < $10k:| Sterling: | 6.7% (1) |
| State: | 9.0% (8,596) |
Number of households with income $10k - 20k:| Sterling: | 6.7% (1) |
| Connecticut: | 10.2% (9,773) |
Number of households with income $20k - 30k:| Sterling: | 13.3% (2) |
| State: | 9.1% (8,691) |
Number of households with income $30k - 40k:| Sterling: | 13.3% (2) |
| State: | 7.8% (7,447) |
Number of households with income $40k - 50k:| Sterling: | 6.7% (1) |
| State: | 8.2% (7,860) |
Number of households with income $50k - 60k:| Sterling: | 6.7% (1) |
| State: | 6.0% (5,757) |
Number of households with income $60k - 75k:| Sterling: | 6.7% (1) |
| Connecticut: | 9.3% (8,942) |
Number of households with income $75k - 100k:| Sterling: | 13.3% (2) |
| State: | 14.3% (13,700) |
Number of households with income $100k - 125k:| Sterling: | 6.7% (1) |
| State: | 7.2% (6,906) |
Number of households with income $125k - 150k:| Sterling: | 6.7% (1) |
| Connecticut: | 6.5% (6,215) |
Number of households with income $150k - 200k:| Sterling: | 6.7% (1) |
| State: | 6.1% (5,865) |
Number of households with income > $200k:| Sterling: | 6.7% (1) |
| State: | 6.3% (6,065) |
Aggregate household income in Sterling in 2022: $1,988,208
Median family income in Sterling in 2022:| Sterling: | $67,557 |
| Connecticut: | $67,610 |
Median per capita income in Sterling in 2022:| Sterling: | $36,350 |
| State: | $29,353 |