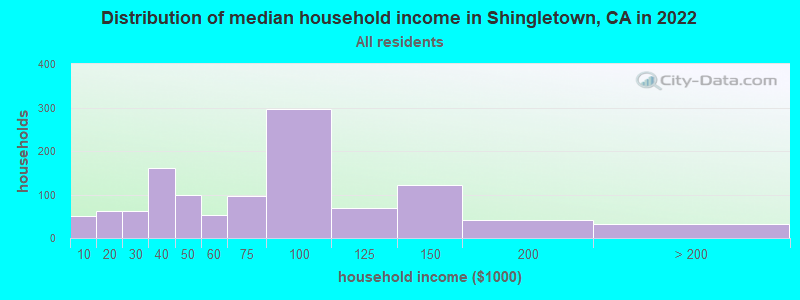
The median household income in Shingletown, CA in 2022 was $71,151, which was 28.7% less than the median annual income of $91,551 across the entire state of California. Compared to the median income of $32,813 in 2000 this represents an increase of 53.9%. The per capita income in 2022 was $38,517, which means an increase of 57.7% compared to 2000 when it was $16,303.
Whole page based on the data from 2000 / 2022 when the population of Shingletown, California was 2,222 / 2,237
Income statistics for all residents
Median household income in Shingletown, CA in 2022:
Shingletown:
$71,151
California:
$91,551
Change in median household income between 2000 and 2022:
Shingletown, California:
+116.8%
State:
+92.8%
Number of households with income < $10k:
Shingletown:
4.5% (51)
State:
4.8% (654,370)
Number of households with income $10k - 20k:
Shingletown:
5.5% (63)
California:
5.8% (789,493)
Number of households with income $20k - 30k:
Shingletown:
5.3% (61)
California:
5.7% (778,318)
Number of households with income $30k - 40k:
Shingletown:
14.0% (160)
State:
5.8% (783,170)
Number of households with income $40k - 50k:
Shingletown:
8.6% (98)
State:
5.8% (781,352)
Number of households with income $50k - 60k:
Shingletown:
4.5% (52)
State:
5.6% (760,175)
Number of households with income $60k - 75k:
Shingletown:
8.5% (97)
State:
8.2% (1,104,699)
Number of households with income $75k - 100k:
Shingletown:
25.9% (297)
State:
12.0% (1,627,633)
Number of households with income $100k - 125k:
Shingletown:
6.1% (70)
State:
10.0% (1,358,619)
Number of households with income $125k - 150k:
Shingletown:
10.7% (122)
State:
7.6% (1,027,455)
Number of households with income $150k - 200k:
Shingletown:
3.7% (42)
State:
10.6% (1,439,811)
Number of households with income > $200k:
Shingletown:
2.8% (32)
California:
18.0% (2,445,491)
Aggregate household income in Shingletown in 2022: $85,178,949
Median family income in Shingletown in 2022:
Shingletown:
$86,656
California:
$104,823
Number of families with income $10k - 20k:
Shingletown:
2.9% (18)
State:
3.5% (322,064)
Number of families with income $30k - 40k:
Shingletown:
7.2% (45)
California:
5.2% (478,213)
Number of families with income $40k - 50k:
Shingletown:
7.6% (47)
California:
5.6% (511,647)
Number of families with income $50k - 60k:
Shingletown:
6.4% (40)
California:
5.5% (498,926)
Number of families with income $60k - 75k:
Shingletown:
10.3% (64)
California:
8.0% (731,094)
Number of families with income $75k - 100k:
Shingletown:
42.2% (263)
State:
12.2% (1,115,621)
Number of families with income $100k - 125k:
Shingletown:
8.5% (53)
California:
10.5% (959,600)
Number of families with income $125k - 150k:
Shingletown:
7.0% (44)
State:
8.4% (768,725)
Number of families with income $150k - 200k:
Shingletown:
3.0% (19)
California:
11.9% (1,087,239)
Number of families with income > $200k:
Shingletown:
4.9% (31)
California:
21.5% (1,963,769)
Median non-family income in Shingletown in 2022:
Shingletown:
$35,422
State:
$59,348
Change in median non-family income between 2000 and 2022:
Shingletown, California:
+73.9%
California:
+85.3%
Median per capita income in Shingletown in 2022:
Shingletown:
$38,517
California:
$46,661
Change in median per capita income between 2000 and 2022:
Shingletown, California:
+136.3%
State:
+105.5%
Income statistics for White residents
Median household income in Shingletown, CA in 2022:
Shingletown:
$72,592
California:
$100,917
Change in median household income between 2000 and 2022:
Shingletown, California:
+125.9%
State:
+96.8%
Number of households with income < $10k:
Shingletown:
4.5% (44)
California:
4.4% (284,109)
Number of households with income $10k - 20k:
Shingletown:
5.5% (54)
California:
5.3% (340,330)
Number of households with income $20k - 30k:
Shingletown:
6.6% (64)
California:
5.3% (343,145)
Number of households with income $30k - 40k:
Shingletown:
13.8% (135)
State:
5.1% (330,146)
Number of households with income $40k - 50k:
Shingletown:
7.8% (76)
California:
5.2% (335,310)
Number of households with income $50k - 60k:
Shingletown:
5.2% (51)
State:
5.1% (326,299)
Number of households with income $60k - 75k:
Shingletown:
4.9% (48)
State:
7.6% (487,640)
Number of households with income $75k - 100k:
Shingletown:
25.8% (252)
California:
11.5% (736,578)
Number of households with income $100k - 125k:
Shingletown:
7.1% (69)
California:
10.1% (648,782)
Number of households with income $125k - 150k:
Shingletown:
11.6% (113)
State:
7.8% (499,671)
Number of households with income $150k - 200k:
Shingletown:
3.9% (38)
State:
11.4% (729,603)
Number of households with income > $200k:
Shingletown:
3.2% (31)
California:
21.2% (1,364,246)
Aggregate household income in Shingletown in 2022: $75,404,570
Median family income in Shingletown in 2022:
Shingletown:
$86,593
California:
$125,379
Number of families with income $10k - 20k:
Shingletown:
3.1% (16)
State:
2.5% (97,716)
Number of families with income $30k - 40k:
Shingletown:
8.9% (45)
State:
3.9% (152,947)
Number of families with income $40k - 50k:
Shingletown:
3.7% (19)
State:
4.3% (169,197)
Number of families with income $50k - 60k:
Shingletown:
7.0% (35)
State:
4.5% (176,192)
Number of families with income $60k - 75k:
Shingletown:
3.6% (18)
State:
7.0% (274,752)
Number of families with income $75k - 100k:
Shingletown:
47.0% (236)
State:
11.3% (445,632)
Number of families with income $100k - 125k:
Shingletown:
10.3% (52)
California:
10.7% (423,630)
Number of families with income $125k - 150k:
Shingletown:
7.1% (35)
State:
9.1% (357,408)
Number of families with income $150k - 200k:
Shingletown:
3.4% (17)
California:
13.5% (532,693)
Number of families with income > $200k:
Shingletown:
5.9% (30)
California:
27.6% (1,086,948)
Median non-family income in Shingletown in 2022:
Shingletown:
$38,546
State:
$62,819
Change in median non-family income between 2000 and 2022:
Shingletown, California:
+89.2%
State:
+84.4%
Median per capita income in Shingletown in 2022:
Shingletown:
$39,892
State:
$61,706
Change in median per capita income between 2000 and 2022:
Shingletown, California:
+149.5%
State:
+122.7%
Income statistics for Black or African American residents
Median per capita income in Shingletown in 2022:
Shingletown:
$13,493
California:
$36,708
Change in median per capita income between 2000 and 2022:
Shingletown, California:
+22.7%
State:
+110.4%
Income statistics for Asian residents
Median per capita income in Shingletown in 2022:
Shingletown:
$13,077
State:
$58,824
Income statistics for Hispanic or Latino residents
Number of households with income < $10k:
Shingletown:
0.0% (0)
State:
4.3% (183,294)
Number of households with income $10k - 20k:
Shingletown:
0.0% (0)
California:
6.0% (253,903)
Number of households with income $20k - 30k:
Shingletown:
0.0% (0)
State:
6.8% (286,386)
Number of households with income $30k - 40k:
Shingletown:
0.0% (0)
State:
7.4% (313,728)
Number of households with income $40k - 50k:
Shingletown:
0.0% (0)
State:
7.4% (313,199)
Number of households with income $50k - 60k:
Shingletown:
0.0% (0)
California:
7.2% (305,366)
Number of households with income $60k - 75k:
Shingletown:
32.7% (16)
State:
10.3% (434,937)
Number of households with income $75k - 100k:
Shingletown:
67.3% (33)
State:
14.4% (607,302)
Number of households with income $100k - 125k:
Shingletown:
0.0% (0)
State:
10.6% (447,424)
Number of households with income $125k - 150k:
Shingletown:
0.0% (0)
California:
7.5% (316,022)
Number of households with income $150k - 200k:
Shingletown:
0.0% (0)
State:
9.2% (386,269)
Number of households with income > $200k:
Shingletown:
0.0% (0)
State:
8.8% (372,651)
Aggregate household income in Shingletown in 2022: $2,260,600
Median per capita income in Shingletown in 2022:
Shingletown:
$43,767
State:
$27,240
Income statistics for American Indian and Alaska Native residents
Number of households with income < $10k:
Shingletown:
0.0% (0)
California:
5.4% (8,471)
Number of households with income $10k - 20k:
Shingletown:
58.8% (10)
State:
6.0% (9,381)
Number of households with income $20k - 30k:
Shingletown:
0.0% (0)
State:
5.5% (8,668)
Number of households with income $30k - 40k:
Shingletown:
0.0% (0)
California:
8.3% (13,030)
Number of households with income $40k - 50k:
Shingletown:
0.0% (0)
State:
6.9% (10,908)
Number of households with income $50k - 60k:
Shingletown:
0.0% (0)
State:
7.1% (11,198)
Number of households with income $60k - 75k:
Shingletown:
0.0% (0)
State:
9.6% (15,190)
Number of households with income $75k - 100k:
Shingletown:
0.0% (0)
State:
14.1% (22,274)
Number of households with income $100k - 125k:
Shingletown:
0.0% (0)
State:
11.2% (17,643)
Number of households with income $125k - 150k:
Shingletown:
41.2% (7)
California:
8.3% (13,117)
Number of households with income $150k - 200k:
Shingletown:
0.0% (0)
State:
8.8% (13,853)
Number of households with income > $200k:
Shingletown:
0.0% (0)
California:
8.8% (13,925)
Aggregate household income in Shingletown in 2022: $1,900,926
Median per capita income in Shingletown in 2022:
Shingletown:
$20,596
State:
$30,289
Change in median per capita income between 2000 and 2022:: -64.5%
Shingletown, California:
-64.5%
State:
+98.9%
Income statistics for Multirace residents
Median household income in Shingletown, CA in 2022:
Shingletown:
$72,124
California:
$83,153
Change in median household income between 2000 and 2022:
Shingletown, California:
+35.3%
State:
+106.0%
Number of households with income < $10k:
Shingletown:
0.0% (0)
State:
4.2% (85,299)
Number of households with income $10k - 20k:
Shingletown:
0.0% (0)
State:
6.1% (122,966)
Number of households with income $20k - 30k:
Shingletown:
0.0% (0)
State:
6.4% (129,328)
Number of households with income $30k - 40k:
Shingletown:
0.0% (0)
California:
6.4% (130,070)
Number of households with income $40k - 50k:
Shingletown:
21.7% (36)
State:
6.5% (131,254)
Number of households with income $50k - 60k:
Shingletown:
0.0% (0)
State:
6.5% (132,382)
Number of households with income $60k - 75k:
Shingletown:
34.9% (58)
State:
9.4% (191,472)
Number of households with income $75k - 100k:
Shingletown:
43.4% (72)
California:
13.3% (269,691)
Number of households with income $100k - 125k:
Shingletown:
0.0% (0)
California:
10.2% (207,286)
Number of households with income $125k - 150k:
Shingletown:
0.0% (0)
California:
7.8% (158,259)
Number of households with income $150k - 200k:
Shingletown:
0.0% (0)
State:
10.3% (209,227)
Number of households with income > $200k:
Shingletown:
0.0% (0)
State:
13.0% (263,210)
Aggregate household income in Shingletown in 2022: $9,996,377
Median family income in Shingletown in 2022:
Shingletown:
$71,505
State:
$87,642
Number of families with income $40k - 50k:
Shingletown:
36.8% (54)
State:
6.8% (100,085)
Number of families with income $60k - 75k:
Shingletown:
37.0% (54)
State:
9.5% (140,131)
Number of families with income $75k - 100k:
Shingletown:
26.2% (38)
State:
13.8% (203,439)
Median per capita income in Shingletown in 2022:
Shingletown:
$34,865
California:
$32,124
Discuss Shingletown, California (CA) on our hugely popular California forum.