The median household income in Sherwood Shores, TX in 2022 was $31,014, which was 133.1% less than the median annual income of $72,284 across the entire state of Texas. Compared to the median income of $37,178 in 2000 this represents a decrease of 19.9%. The per capita income in 2022 was $39,673, which means an increase of 52.5% compared to 2000 when it was $18,862.
Whole page based on the data from 2000 / 2022 when the population of Sherwood Shores, Texas was 1,190 / 919
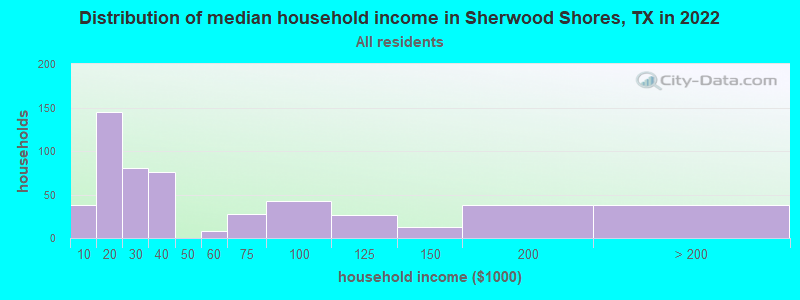
Income statistics for all residents
Median household income in Sherwood Shores, TX in 2022:
Sherwood Shores:
$31,014
State:
$72,284
Change in median household income between 2000 and 2022:: -16.6%
Sherwood Shores, Texas:
-16.6%
State:
+81.0%
Number of households with income < $10k:
Sherwood Shores:
7.1% (38)
State:
5.5% (611,011)
Number of households with income $10k - 20k:
Sherwood Shores:
27.3% (145)
State:
6.7% (743,157)
Number of households with income $20k - 30k:
Sherwood Shores:
15.0% (80)
Texas:
7.2% (803,381)
Number of households with income $30k - 40k:
Sherwood Shores:
14.3% (76)
State:
7.8% (866,080)
Number of households with income $40k - 50k:
Sherwood Shores:
0.0% (0)
State:
7.3% (810,440)
Number of households with income $50k - 60k:
Sherwood Shores:
1.5% (8)
State:
7.2% (799,783)
Number of households with income $60k - 75k:
Sherwood Shores:
5.3% (28)
Texas:
9.9% (1,095,384)
Number of households with income $75k - 100k:
Sherwood Shores:
7.9% (42)
State:
12.8% (1,419,057)
Number of households with income $100k - 125k:
Sherwood Shores:
4.9% (26)
State:
9.5% (1,054,577)
Number of households with income $125k - 150k:
Sherwood Shores:
2.4% (13)
State:
6.7% (741,518)
Number of households with income $150k - 200k:
Sherwood Shores:
7.1% (38)
Texas:
8.7% (961,776)
Number of households with income > $200k:
Sherwood Shores:
7.1% (38)
State:
10.7% (1,181,544)
Aggregate household income in Sherwood Shores in 2022: $34,996,975
Median family income in Sherwood Shores in 2022:
Sherwood Shores:
$71,146
State:
$86,267
Number of families with income < $10k:
Sherwood Shores:
1.7% (5)
State:
4.0% (297,884)
Number of families with income $10k - 20k:
Sherwood Shores:
32.2% (90)
Texas:
4.3% (324,514)
Number of families with income $20k - 30k:
Sherwood Shores:
2.7% (8)
State:
5.8% (430,949)
Number of families with income $30k - 40k:
Sherwood Shores:
10.5% (29)
State:
6.6% (493,535)
Number of families with income $60k - 75k:
Sherwood Shores:
9.9% (27)
State:
9.5% (710,229)
Number of families with income $75k - 100k:
Sherwood Shores:
9.7% (27)
Texas:
13.6% (1,015,480)
Number of families with income $100k - 125k:
Sherwood Shores:
10.5% (29)
State:
10.7% (797,961)
Number of families with income $125k - 150k:
Sherwood Shores:
4.9% (14)
State:
8.1% (602,985)
Number of families with income $150k - 200k:
Sherwood Shores:
8.2% (23)
Texas:
10.7% (804,459)
Number of families with income > $200k:
Sherwood Shores:
9.7% (27)
State:
13.5% (1,013,514)
Median non-family income in Sherwood Shores in 2022:
Sherwood Shores:
$23,261
Texas:
$45,999
Change in median non-family income between 2000 and 2022:
Sherwood Shores, Texas:
+17.3%
State:
+79.5%
Median per capita income in Sherwood Shores in 2022:
Sherwood Shores:
$39,674
Texas:
$38,123
Change in median per capita income between 2000 and 2022:
Sherwood Shores, Texas:
+110.3%
State:
+94.3%
Income statistics for White residents
Median household income in Sherwood Shores, TX in 2022:
Sherwood Shores:
$33,689
State:
$82,032
Change in median household income between 2000 and 2022:: -11.7%
Sherwood Shores, Texas:
-11.7%
Texas:
+91.0%
Number of households with income < $10k:
Sherwood Shores:
8.8% (39)
State:
4.7% (273,716)
Number of households with income $10k - 20k:
Sherwood Shores:
17.8% (79)
State:
5.5% (322,702)
Number of households with income $20k - 30k:
Sherwood Shores:
17.6% (78)
State:
6.2% (363,947)
Number of households with income $30k - 40k:
Sherwood Shores:
14.6% (65)
State:
6.8% (399,275)
Number of households with income $40k - 50k:
Sherwood Shores:
0.0% (0)
Texas:
6.5% (383,417)
Number of households with income $50k - 60k:
Sherwood Shores:
1.6% (7)
State:
6.6% (388,535)
Number of households with income $60k - 75k:
Sherwood Shores:
5.6% (25)
State:
9.7% (566,295)
Number of households with income $75k - 100k:
Sherwood Shores:
9.9% (44)
State:
13.0% (760,276)
Number of households with income $100k - 125k:
Sherwood Shores:
6.1% (27)
Texas:
10.2% (597,596)
Number of households with income $125k - 150k:
Sherwood Shores:
2.9% (13)
Texas:
7.4% (436,830)
Number of households with income $150k - 200k:
Sherwood Shores:
8.1% (36)
Texas:
9.9% (583,067)
Number of households with income > $200k:
Sherwood Shores:
7.0% (31)
State:
13.5% (792,647)
Aggregate household income in Sherwood Shores in 2022: $31,284,660
Median family income in Sherwood Shores in 2022:
Sherwood Shores:
$86,628
State:
$101,788
Number of families with income < $10k:
Sherwood Shores:
2.1% (4)
State:
2.8% (108,142)
Number of families with income $10k - 20k:
Sherwood Shores:
17.6% (37)
State:
2.9% (113,421)
Number of families with income $20k - 30k:
Sherwood Shores:
4.0% (8)
State:
4.1% (157,688)
Number of families with income $30k - 40k:
Sherwood Shores:
9.5% (20)
State:
5.2% (198,847)
Number of families with income $60k - 75k:
Sherwood Shores:
11.9% (25)
Texas:
9.0% (346,106)
Number of families with income $75k - 100k:
Sherwood Shores:
13.3% (28)
Texas:
13.7% (527,363)
Number of families with income $100k - 125k:
Sherwood Shores:
14.5% (31)
State:
11.6% (448,411)
Number of families with income $125k - 150k:
Sherwood Shores:
6.7% (14)
State:
9.2% (355,798)
Number of families with income $150k - 200k:
Sherwood Shores:
10.2% (22)
Texas:
12.5% (480,185)
Number of families with income > $200k:
Sherwood Shores:
10.2% (22)
State:
17.6% (677,490)
Median non-family income in Sherwood Shores in 2022:
Sherwood Shores:
$23,773
State:
$50,587
Change in median non-family income between 2000 and 2022:
Sherwood Shores, Texas:
+18.8%
State:
+87.7%
Median per capita income in Sherwood Shores in 2022:
Sherwood Shores:
$42,208
State:
$47,740
Change in median per capita income between 2000 and 2022:
Sherwood Shores, Texas:
+113.2%
State:
+114.3%
Income statistics for Asian residents
Number of households with income < $10k:
Sherwood Shores:
0.0% (0)
State:
5.2% (29,885)
Number of households with income $10k - 20k:
Sherwood Shores:
100.0% (48)
State:
4.7% (27,044)
Number of households with income $20k - 30k:
Sherwood Shores:
0.0% (0)
Texas:
4.1% (23,363)
Number of households with income $30k - 40k:
Sherwood Shores:
0.0% (0)
Texas:
4.1% (23,309)
Number of households with income $40k - 50k:
Sherwood Shores:
0.0% (0)
Texas:
5.2% (29,826)
Number of households with income $50k - 60k:
Sherwood Shores:
0.0% (0)
Texas:
4.7% (26,512)
Number of households with income $60k - 75k:
Sherwood Shores:
0.0% (0)
State:
6.5% (36,905)
Number of households with income $75k - 100k:
Sherwood Shores:
0.0% (0)
Texas:
11.3% (64,350)
Number of households with income $100k - 125k:
Sherwood Shores:
0.0% (0)
State:
11.4% (64,714)
Number of households with income $125k - 150k:
Sherwood Shores:
0.0% (0)
State:
9.3% (52,719)
Number of households with income $150k - 200k:
Sherwood Shores:
0.0% (0)
State:
12.5% (70,953)
Number of households with income > $200k:
Sherwood Shores:
0.0% (0)
State:
21.1% (120,260)
Aggregate household income in Sherwood Shores in 2022: $50,362,200
Median per capita income in Sherwood Shores in 2022:
Sherwood Shores:
$21,413
State:
$48,626
Change in median per capita income between 2000 and 2022:: -10.5%
Sherwood Shores, Texas:
-10.5%
Texas:
+132.0%
Income statistics for Hispanic or Latino residents
Aggregate household income in Sherwood Shores in 2022: $656,802,000
Median per capita income in Sherwood Shores in 2022:
Sherwood Shores:
$15,849
State:
$24,862
Change in median per capita income between 2000 and 2022:
Sherwood Shores, Texas:
+36.3%
Texas:
+130.8%
Income statistics for Multirace residents
Number of households with income < $10k:
Sherwood Shores:
0.0% (0)
Texas:
5.5% (122,324)
Number of households with income $10k - 20k:
Sherwood Shores:
0.0% (0)
State:
8.2% (182,232)
Number of households with income $20k - 30k:
Sherwood Shores:
0.0% (0)
Texas:
8.5% (189,456)
Number of households with income $30k - 40k:
Sherwood Shores:
100.0% (16)
Texas:
8.9% (197,499)
Number of households with income $40k - 50k:
Sherwood Shores:
0.0% (0)
Texas:
8.7% (191,735)
Number of households with income $50k - 60k:
Sherwood Shores:
0.0% (0)
State:
8.0% (177,535)
Number of households with income $60k - 75k:
Sherwood Shores:
0.0% (0)
State:
10.5% (232,479)
Number of households with income $75k - 100k:
Sherwood Shores:
0.0% (0)
State:
13.1% (290,448)
Number of households with income $100k - 125k:
Sherwood Shores:
0.0% (0)
State:
8.6% (191,595)
Number of households with income $125k - 150k:
Sherwood Shores:
0.0% (0)
Texas:
6.0% (133,361)
Number of households with income $150k - 200k:
Sherwood Shores:
0.0% (0)
State:
7.2% (159,195)
Number of households with income > $200k:
Sherwood Shores:
0.0% (0)
State:
6.7% (148,064)
Aggregate household income in Sherwood Shores in 2022: $582,420,200
Median per capita income in Sherwood Shores in 2022:
Sherwood Shores:
$43,376
State:
$26,785
Income statistics for other residents
Median per capita income in Sherwood Shores in 2022:
Sherwood Shores:
$21,007
State:
$23,899
Change in median per capita income between 2000 and 2022:
Sherwood Shores, Texas:
+119.7%
Texas:
+135.2%
Discuss Sherwood Shores, Texas (TX) on our hugely popular Texas forum.