The median household income in Ratamosa, TX in 2022 was $68,670, which was 5.3% less than the median annual income of $72,284 across the entire state of Texas. Compared to the median income of $85,000 in 2000 this represents a decrease of 23.8%. The per capita income in 2022 was $30,991, which means an increase of 28.0% compared to 2000 when it was $22,302.
Whole page based on the data from 2000 / 2022 when the population of Ratamosa, Texas was 218 / 137
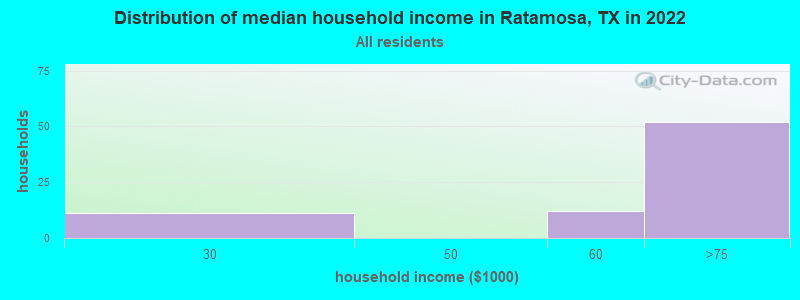
Income statistics for all residents
Median household income in Ratamosa, TX in 2022:
Ratamosa:
$68,671
State:
$72,284
Change in median household income between 2000 and 2022:: -19.2%
Ratamosa, Texas:
-19.2%
State:
+81.0%
Number of households with income < $10k:
Ratamosa:
0.0% (0)
Texas:
5.5% (611,011)
Number of households with income $10k - 20k:
Ratamosa:
0.0% (0)
State:
6.7% (743,157)
Number of households with income $20k - 30k:
Ratamosa:
14.7% (11)
State:
7.2% (803,381)
Number of households with income $30k - 40k:
Ratamosa:
0.0% (0)
Texas:
7.8% (866,080)
Number of households with income $40k - 50k:
Ratamosa:
0.0% (0)
State:
7.3% (810,440)
Number of households with income $50k - 60k:
Ratamosa:
16.0% (12)
Texas:
7.2% (799,783)
Number of households with income $60k - 75k:
Ratamosa:
69.3% (52)
State:
9.9% (1,095,384)
Number of households with income $75k - 100k:
Ratamosa:
0.0% (0)
Texas:
12.8% (1,419,057)
Number of households with income $100k - 125k:
Ratamosa:
0.0% (0)
Texas:
9.5% (1,054,577)
Number of households with income $125k - 150k:
Ratamosa:
0.0% (0)
State:
6.7% (741,518)
Number of households with income $150k - 200k:
Ratamosa:
0.0% (0)
Texas:
8.7% (961,776)
Number of households with income > $200k:
Ratamosa:
0.0% (0)
State:
10.7% (1,181,544)
Aggregate household income in Ratamosa in 2022: $4,441,981
Median per capita income in Ratamosa in 2022:
Ratamosa:
$30,992
State:
$38,123
Change in median per capita income between 2000 and 2022:
Ratamosa, Texas:
+39.0%
State:
+94.3%
Income statistics for White residents
Median household income in Ratamosa, TX in 2022:
Ratamosa:
$76,406
State:
$82,032
Change in median household income between 2000 and 2022:: -19.1%
Ratamosa, Texas:
-19.1%
State:
+91.0%
Number of households with income < $10k:
Ratamosa:
0.0% (0)
Texas:
4.7% (273,716)
Number of households with income $10k - 20k:
Ratamosa:
0.0% (0)
Texas:
5.5% (322,702)
Number of households with income $20k - 30k:
Ratamosa:
12.5% (5)
State:
6.2% (363,947)
Number of households with income $30k - 40k:
Ratamosa:
0.0% (0)
State:
6.8% (399,275)
Number of households with income $40k - 50k:
Ratamosa:
0.0% (0)
Texas:
6.5% (383,417)
Number of households with income $50k - 60k:
Ratamosa:
17.5% (7)
State:
6.6% (388,535)
Number of households with income $60k - 75k:
Ratamosa:
70.0% (28)
Texas:
9.7% (566,295)
Number of households with income $75k - 100k:
Ratamosa:
0.0% (0)
Texas:
13.0% (760,276)
Number of households with income $100k - 125k:
Ratamosa:
0.0% (0)
Texas:
10.2% (597,596)
Number of households with income $125k - 150k:
Ratamosa:
0.0% (0)
Texas:
7.4% (436,830)
Number of households with income $150k - 200k:
Ratamosa:
0.0% (0)
State:
9.9% (583,067)
Number of households with income > $200k:
Ratamosa:
0.0% (0)
State:
13.5% (792,647)
Aggregate household income in Ratamosa in 2022: $2,737,085
Median per capita income in Ratamosa in 2022:
Ratamosa:
$36,973
State:
$47,740
Change in median per capita income between 2000 and 2022:
Ratamosa, Texas:
+39.4%
State:
+114.3%
Income statistics for Hispanic or Latino residents
Number of households with income < $10k:
Ratamosa:
0.0% (0)
State:
5.8% (213,953)
Number of households with income $10k - 20k:
Ratamosa:
0.0% (0)
Texas:
8.0% (297,456)
Number of households with income $20k - 30k:
Ratamosa:
0.0% (0)
State:
9.2% (340,166)
Number of households with income $30k - 40k:
Ratamosa:
0.0% (0)
Texas:
9.5% (354,336)
Number of households with income $40k - 50k:
Ratamosa:
0.0% (0)
State:
8.8% (327,013)
Number of households with income $50k - 60k:
Ratamosa:
100.0% (13)
State:
8.3% (308,818)
Number of households with income $60k - 75k:
Ratamosa:
0.0% (0)
State:
10.9% (405,109)
Number of households with income $75k - 100k:
Ratamosa:
0.0% (0)
Texas:
13.8% (511,639)
Number of households with income $100k - 125k:
Ratamosa:
0.0% (0)
Texas:
8.6% (319,728)
Number of households with income $125k - 150k:
Ratamosa:
0.0% (0)
Texas:
5.7% (210,932)
Number of households with income $150k - 200k:
Ratamosa:
0.0% (0)
State:
6.4% (236,055)
Number of households with income > $200k:
Ratamosa:
0.0% (0)
Texas:
5.1% (189,259)
Aggregate household income in Ratamosa in 2022: $4,916,857
Median per capita income in Ratamosa in 2022:
Ratamosa:
$25,288
State:
$24,862
Change in median per capita income between 2000 and 2022:
Ratamosa, Texas:
+128.2%
State:
+130.8%
Discuss Ratamosa, Texas (TX) on our hugely popular Texas forum.