Port Gamble Tribal Comunity, Washington (WA) income map, earnings map, and wages data
The median household income in Port Gamble Tribal Comunity, WA in 2022 was $78,094, which was 16.9% less than the median annual income of $91,306 across the entire state of Washington. Compared to the median income of $46,840 in 2000 this represents an increase of 40.0%. The per capita income in 2022 was $36,662, which means an increase of 39.1% compared to 2000 when it was $22,317.
Whole page based on the data from 2000 / 2022 when the population of Port Gamble Tribal Comunity, Washington was 916 / 857
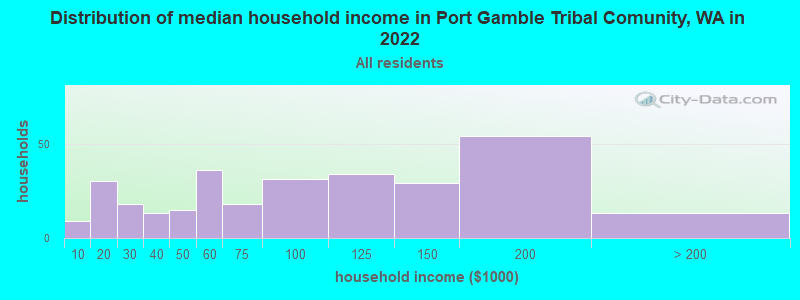
Income statistics for all residents
Median household income in Port Gamble Tribal Comunity, WA in 2022:| Port Gamble Tribal Comunity: | $78,094 |
| State: | $91,306 |
Change in median household income between 2000 and 2022:| Port Gamble Tribal Comunity, Washington: | +66.7% |
| State: | +99.5% |
Number of households with income < $10k:| Port Gamble Tribal Comunity: | 3.0% (9) |
| Washington: | 4.5% (139,331) |
Number of households with income $10k - 20k:| Port Gamble Tribal Comunity: | 10.0% (30) |
| Washington: | 5.0% (154,508) |
Number of households with income $20k - 30k:| Port Gamble Tribal Comunity: | 6.0% (18) |
| State: | 5.4% (166,555) |
Number of households with income $30k - 40k:| Port Gamble Tribal Comunity: | 4.3% (13) |
| State: | 5.5% (170,324) |
Number of households with income $40k - 50k:| Port Gamble Tribal Comunity: | 5.0% (15) |
| Washington: | 6.0% (183,941) |
Number of households with income $50k - 60k:| Port Gamble Tribal Comunity: | 12.0% (36) |
| State: | 6.1% (187,395) |
Number of households with income $60k - 75k:| Port Gamble Tribal Comunity: | 6.0% (18) |
| State: | 8.7% (266,771) |
Number of households with income $75k - 100k:| Port Gamble Tribal Comunity: | 10.3% (31) |
| State: | 13.1% (404,672) |
Number of households with income $100k - 125k:| Port Gamble Tribal Comunity: | 11.3% (34) |
| State: | 11.0% (337,911) |
Number of households with income $125k - 150k:| Port Gamble Tribal Comunity: | 9.7% (29) |
| State: | 8.0% (244,934) |
Number of households with income $150k - 200k:| Port Gamble Tribal Comunity: | 18.0% (54) |
| Washington: | 10.5% (323,812) |
Number of households with income > $200k:| Port Gamble Tribal Comunity: | 4.3% (13) |
| State: | 16.2% (499,799) |
Aggregate household income in Port Gamble Tribal Comunity in 2022: $32,825,772
Median family income in Port Gamble Tribal Comunity in 2022:| Port Gamble Tribal Comunity: | $70,729 |
| Washington: | $109,192 |
Number of families with income < $10k:| Port Gamble Tribal Comunity: | 4.8% (11) |
| State: | 2.9% (55,953) |
Number of families with income $10k - 20k:| Port Gamble Tribal Comunity: | 10.9% (26) |
| Washington: | 2.6% (50,138) |
Number of families with income $20k - 30k:| Port Gamble Tribal Comunity: | 4.7% (11) |
| State: | 3.2% (61,974) |
Number of families with income $30k - 40k:| Port Gamble Tribal Comunity: | 3.5% (8) |
| State: | 4.1% (80,240) |
Number of families with income $40k - 50k:| Port Gamble Tribal Comunity: | 5.7% (14) |
| State: | 4.9% (94,310) |
Number of families with income $50k - 60k:| Port Gamble Tribal Comunity: | 14.0% (34) |
| State: | 5.3% (101,674) |
Number of families with income $60k - 75k:| Port Gamble Tribal Comunity: | 6.6% (16) |
| State: | 8.2% (158,348) |
Number of families with income $75k - 100k:| Port Gamble Tribal Comunity: | 17.1% (41) |
| Washington: | 13.8% (267,812) |
Number of families with income $100k - 125k:| Port Gamble Tribal Comunity: | 12.9% (31) |
| State: | 12.4% (240,213) |
Number of families with income $125k - 150k:| Port Gamble Tribal Comunity: | 12.4% (30) |
| State: | 9.3% (180,011) |
Number of families with income $150k - 200k:| Port Gamble Tribal Comunity: | 2.8% (7) |
| Washington: | 13.0% (250,874) |
Number of families with income > $200k:| Port Gamble Tribal Comunity: | 4.7% (11) |
| State: | 20.4% (393,898) |
Median per capita income in Port Gamble Tribal Comunity in 2022:| Port Gamble Tribal Comunity: | $36,662 |
| State: | $50,764 |
Change in median per capita income between 2000 and 2022:| Port Gamble Tribal Comunity, Washington: | +64.3% |
| State: | +121.0% |
Income statistics for White residents
Median household income in Port Gamble Tribal Comunity, WA in 2022:| Port Gamble Tribal Comunity: | $151,818 |
| Washington: | $91,916 |
Number of households with income < $10k:| Port Gamble Tribal Comunity: | 0.0% (0) |
| Washington: | 4.3% (95,850) |
Number of households with income $10k - 20k:| Port Gamble Tribal Comunity: | 0.0% (0) |
| Washington: | 4.8% (106,421) |
Number of households with income $20k - 30k:| Port Gamble Tribal Comunity: | 5.7% (6) |
| Washington: | 5.5% (122,860) |
Number of households with income $30k - 40k:| Port Gamble Tribal Comunity: | 1.9% (2) |
| Washington: | 5.4% (119,627) |
Number of households with income $40k - 50k:| Port Gamble Tribal Comunity: | 2.8% (3) |
| Washington: | 5.9% (132,276) |
Number of households with income $50k - 60k:| Port Gamble Tribal Comunity: | 19.8% (21) |
| State: | 6.1% (136,212) |
Number of households with income $60k - 75k:| Port Gamble Tribal Comunity: | 0.0% (0) |
| State: | 8.8% (196,086) |
Number of households with income $75k - 100k:| Port Gamble Tribal Comunity: | 6.6% (7) |
| State: | 13.4% (299,192) |
Number of households with income $100k - 125k:| Port Gamble Tribal Comunity: | 4.7% (5) |
| State: | 11.3% (252,209) |
Number of households with income $125k - 150k:| Port Gamble Tribal Comunity: | 10.4% (11) |
| State: | 7.9% (175,962) |
Number of households with income $150k - 200k:| Port Gamble Tribal Comunity: | 41.5% (44) |
| Washington: | 10.7% (239,156) |
Number of households with income > $200k:| Port Gamble Tribal Comunity: | 6.6% (7) |
| State: | 16.1% (359,917) |
Aggregate household income in Port Gamble Tribal Comunity in 2022: $15,646,538
Median family income in Port Gamble Tribal Comunity in 2022:| Port Gamble Tribal Comunity: | $83,901 |
| State: | $112,511 |
Number of families with income $20k - 30k:| Port Gamble Tribal Comunity: | 7.5% (6) |
| State: | 2.9% (39,288) |
Number of families with income $30k - 40k:| Port Gamble Tribal Comunity: | 2.5% (2) |
| State: | 3.6% (50,190) |
Number of families with income $40k - 50k:| Port Gamble Tribal Comunity: | 3.8% (3) |
| State: | 4.6% (63,009) |
Number of families with income $50k - 60k:| Port Gamble Tribal Comunity: | 26.1% (20) |
| State: | 5.0% (69,270) |
Number of families with income $75k - 100k:| Port Gamble Tribal Comunity: | 28.4% (22) |
| State: | 14.1% (194,214) |
Number of families with income $100k - 125k:| Port Gamble Tribal Comunity: | 6.8% (5) |
| State: | 13.2% (182,184) |
Number of families with income $125k - 150k:| Port Gamble Tribal Comunity: | 16.1% (13) |
| Washington: | 9.5% (130,928) |
Number of families with income > $200k:| Port Gamble Tribal Comunity: | 8.8% (7) |
| State: | 20.8% (285,982) |
Median per capita income in Port Gamble Tribal Comunity in 2022:| Port Gamble Tribal Comunity: | $59,422 |
| State: | $55,212 |
Change in median per capita income between 2000 and 2022:| Port Gamble Tribal Comunity, Washington: | +149.7% |
| Washington: | +123.8% |
Income statistics for Black or African American residents
Median per capita income in Port Gamble Tribal Comunity in 2022:| Port Gamble Tribal Comunity: | $50,529 |
| State: | $38,209 |
Income statistics for Asian residents
Median per capita income in Port Gamble Tribal Comunity in 2022:| Port Gamble Tribal Comunity: | $26,609 |
| State: | $67,666 |
Change in median per capita income between 2000 and 2022:| Port Gamble Tribal Comunity, Washington: | +44.9% |
| State: | +236.0% |
Income statistics for Hispanic or Latino residents
Aggregate household income in Port Gamble Tribal Comunity in 2022: $791,105,600
Median per capita income in Port Gamble Tribal Comunity in 2022:| Port Gamble Tribal Comunity: | $13,248 |
| Washington: | $28,252 |
Change in median per capita income between 2000 and 2022:| Port Gamble Tribal Comunity, Washington: | +1.6% |
| State: | +150.2% |
Income statistics for American Indian and Alaska Native residents
Median household income in Port Gamble Tribal Comunity, WA in 2022:| Port Gamble Tribal Comunity: | $61,957 |
| State: | $71,255 |
Change in median household income between 2000 and 2022:| Port Gamble Tribal Comunity, Washington: | +72.0% |
| State: | +118.1% |
Number of households with income < $10k:| Port Gamble Tribal Comunity: | 3.0% (5) |
| Washington: | 5.9% (1,768) |
Number of households with income $10k - 20k:| Port Gamble Tribal Comunity: | 14.2% (24) |
| State: | 8.9% (2,694) |
Number of households with income $20k - 30k:| Port Gamble Tribal Comunity: | 3.0% (5) |
| Washington: | 8.0% (2,412) |
Number of households with income $30k - 40k:| Port Gamble Tribal Comunity: | 6.5% (11) |
| State: | 7.7% (2,327) |
Number of households with income $40k - 50k:| Port Gamble Tribal Comunity: | 7.1% (12) |
| Washington: | 5.8% (1,755) |
Number of households with income $50k - 60k:| Port Gamble Tribal Comunity: | 10.7% (18) |
| Washington: | 7.5% (2,259) |
Number of households with income $60k - 75k:| Port Gamble Tribal Comunity: | 10.1% (17) |
| State: | 8.8% (2,669) |
Number of households with income $75k - 100k:| Port Gamble Tribal Comunity: | 10.7% (18) |
| State: | 12.8% (3,861) |
Number of households with income $100k - 125k:| Port Gamble Tribal Comunity: | 14.2% (24) |
| State: | 12.0% (3,618) |
Number of households with income $125k - 150k:| Port Gamble Tribal Comunity: | 13.6% (23) |
| State: | 8.6% (2,580) |
Number of households with income $150k - 200k:| Port Gamble Tribal Comunity: | 4.1% (7) |
| State: | 5.9% (1,774) |
Number of households with income > $200k:| Port Gamble Tribal Comunity: | 3.0% (5) |
| State: | 8.1% (2,447) |
Aggregate household income in Port Gamble Tribal Comunity in 2022: $14,201,862
Median family income in Port Gamble Tribal Comunity in 2022:| Port Gamble Tribal Comunity: | $102,049 |
| State: | $79,010 |
Number of families with income < $10k:| Port Gamble Tribal Comunity: | 5.6% (8) |
| Washington: | 5.2% (1,047) |
Number of families with income $10k - 20k:| Port Gamble Tribal Comunity: | 10.8% (15) |
| State: | 5.2% (1,056) |
Number of families with income $20k - 30k:| Port Gamble Tribal Comunity: | 1.3% (2) |
| Washington: | 6.2% (1,258) |
Number of families with income $30k - 40k:| Port Gamble Tribal Comunity: | 4.9% (7) |
| Washington: | 5.9% (1,190) |
Number of families with income $40k - 50k:| Port Gamble Tribal Comunity: | 5.0% (7) |
| State: | 4.6% (927) |
Number of families with income $50k - 60k:| Port Gamble Tribal Comunity: | 14.5% (20) |
| State: | 9.7% (1,973) |
Number of families with income $60k - 75k:| Port Gamble Tribal Comunity: | 11.7% (16) |
| State: | 10.5% (2,124) |
Number of families with income $75k - 100k:| Port Gamble Tribal Comunity: | 10.5% (14) |
| Washington: | 13.1% (2,669) |
Number of families with income $100k - 125k:| Port Gamble Tribal Comunity: | 14.3% (20) |
| Washington: | 13.7% (2,784) |
Number of families with income $125k - 150k:| Port Gamble Tribal Comunity: | 15.2% (21) |
| State: | 9.8% (2,000) |
Number of families with income $150k - 200k:| Port Gamble Tribal Comunity: | 3.1% (4) |
| State: | 7.8% (1,584) |
Number of families with income > $200k:| Port Gamble Tribal Comunity: | 3.2% (4) |
| Washington: | 8.4% (1,698) |
Median non-family income in Port Gamble Tribal Comunity in 2022:| Port Gamble Tribal Comunity: | $45,295 |
| State: | $35,591 |
Change in median non-family income between 2000 and 2022:| Port Gamble Tribal Comunity, Washington: | +77.8% |
| Washington: | +61.8% |
Median per capita income in Port Gamble Tribal Comunity in 2022:| Port Gamble Tribal Comunity: | $24,209 |
| Washington: | $27,053 |
Change in median per capita income between 2000 and 2022:| Port Gamble Tribal Comunity, Washington: | +59.6% |
| State: | +98.6% |
Income statistics for Multirace residents
Number of households with income < $10k:| Port Gamble Tribal Comunity: | 0.0% (0) |
| Washington: | 4.3% (12,040) |
Number of households with income $10k - 20k:| Port Gamble Tribal Comunity: | 28.1% (9) |
| State: | 6.6% (18,437) |
Number of households with income $20k - 30k:| Port Gamble Tribal Comunity: | 28.1% (9) |
| Washington: | 5.2% (14,559) |
Number of households with income $30k - 40k:| Port Gamble Tribal Comunity: | 6.2% (2) |
| State: | 6.7% (18,491) |
Number of households with income $40k - 50k:| Port Gamble Tribal Comunity: | 0.0% (0) |
| State: | 6.3% (17,459) |
Number of households with income $50k - 60k:| Port Gamble Tribal Comunity: | 0.0% (0) |
| State: | 6.9% (19,086) |
Number of households with income $60k - 75k:| Port Gamble Tribal Comunity: | 0.0% (0) |
| Washington: | 9.1% (25,310) |
Number of households with income $75k - 100k:| Port Gamble Tribal Comunity: | 21.9% (7) |
| State: | 13.5% (37,493) |
Number of households with income $100k - 125k:| Port Gamble Tribal Comunity: | 6.2% (2) |
| State: | 10.7% (29,626) |
Number of households with income $125k - 150k:| Port Gamble Tribal Comunity: | 0.0% (0) |
| Washington: | 8.6% (23,899) |
Number of households with income $150k - 200k:| Port Gamble Tribal Comunity: | 3.1% (1) |
| State: | 10.2% (28,214) |
Number of households with income > $200k:| Port Gamble Tribal Comunity: | 6.2% (2) |
| State: | 11.9% (32,947) |
Aggregate household income in Port Gamble Tribal Comunity in 2022: $1,571,199
Median family income in Port Gamble Tribal Comunity in 2022:| Port Gamble Tribal Comunity: | $73,615 |
| State: | $95,629 |
Number of families with income $20k - 30k:| Port Gamble Tribal Comunity: | 12.1% (2) |
| State: | 4.4% (7,775) |
Number of families with income $75k - 100k:| Port Gamble Tribal Comunity: | 37.6% (5) |
| State: | 13.6% (23,984) |
Number of families with income $100k - 125k:| Port Gamble Tribal Comunity: | 19.2% (3) |
| State: | 10.4% (18,288) |
Number of families with income $150k - 200k:| Port Gamble Tribal Comunity: | 31.1% (4) |
| Washington: | 11.9% (20,852) |
Median per capita income in Port Gamble Tribal Comunity in 2022:| Port Gamble Tribal Comunity: | $18,001 |
| State: | $32,496 |
Change in median per capita income between 2000 and 2022:| Port Gamble Tribal Comunity, Washington: | +72.3% |
| Washington: | +156.8% |
Income statistics for other residents
Median per capita income in Port Gamble Tribal Comunity in 2022:| Port Gamble Tribal Comunity: | $52,062 |
| Washington: | $27,542 |