North Lynbrook, New York (NY) income map, earnings map, and wages data

Data:
The per capita income in 2022 was $39,629, which means an increase of 21.9% compared to 2000 when it was $30,951.
Whole page based on the data from 2000 / 2022 when the population of North Lynbrook, New York was 742 / 468
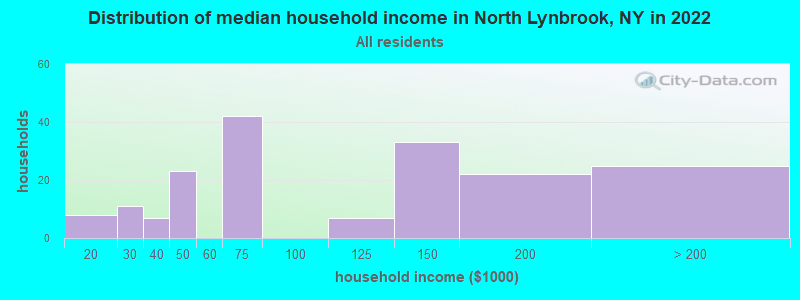
Income statistics for all residents
Number of households with income < $10k:| North Lynbrook: | 0.0% (0) |
| New York: | 6.8% (527,598) |
Number of households with income $10k - 20k:| North Lynbrook: | 4.5% (8) |
| State: | 7.4% (574,940) |
Number of households with income $20k - 30k:| North Lynbrook: | 6.2% (11) |
| State: | 6.7% (517,718) |
Number of households with income $30k - 40k:| North Lynbrook: | 3.9% (7) |
| New York: | 6.5% (506,674) |
Number of households with income $40k - 50k:| North Lynbrook: | 12.9% (23) |
| State: | 6.1% (470,439) |
Number of households with income $50k - 60k:| North Lynbrook: | 0.0% (0) |
| State: | 5.8% (454,042) |
Number of households with income $60k - 75k:| North Lynbrook: | 23.6% (42) |
| State: | 8.5% (657,508) |
Number of households with income $75k - 100k:| North Lynbrook: | 0.0% (0) |
| State: | 11.6% (899,824) |
Number of households with income $100k - 125k:| North Lynbrook: | 3.9% (7) |
| New York: | 9.3% (723,825) |
Number of households with income $125k - 150k:| North Lynbrook: | 18.5% (33) |
| State: | 7.1% (552,420) |
Number of households with income $150k - 200k:| North Lynbrook: | 12.4% (22) |
| State: | 9.4% (727,051) |
Number of households with income > $200k:| North Lynbrook: | 14.0% (25) |
| State: | 15.0% (1,162,269) |
Aggregate household income in North Lynbrook in 2022: $18,480,906
Median family income in North Lynbrook in 2022:| North Lynbrook: | $131,355 |
| State: | $99,066 |
Number of families with income $30k - 40k:| North Lynbrook: | 4.3% (7) |
| State: | 5.5% (259,233) |
Number of families with income $40k - 50k:| North Lynbrook: | 13.4% (21) |
| State: | 5.5% (259,113) |
Number of families with income $60k - 75k:| North Lynbrook: | 25.9% (40) |
| State: | 8.2% (388,624) |
Number of families with income $100k - 125k:| North Lynbrook: | 4.9% (7) |
| New York: | 10.6% (500,579) |
Number of families with income $125k - 150k:| North Lynbrook: | 21.1% (32) |
| State: | 8.5% (400,594) |
Number of families with income $150k - 200k:| North Lynbrook: | 14.5% (22) |
| State: | 11.6% (551,650) |
Number of families with income > $200k:| North Lynbrook: | 15.9% (24) |
| State: | 18.9% (895,998) |
Median per capita income in North Lynbrook in 2022:| North Lynbrook: | $39,629 |
| New York: | $47,421 |
Change in median per capita income between 2000 and 2022:| North Lynbrook, New York: | +28.0% |
| State: | +102.7% |
Income statistics for White residents
Number of households with income < $10k:| North Lynbrook: | 0.0% (0) |
| New York: | 4.8% (225,550) |
Number of households with income $10k - 20k:| North Lynbrook: | 6.1% (8) |
| State: | 6.1% (289,425) |
Number of households with income $20k - 30k:| North Lynbrook: | 7.6% (10) |
| State: | 5.9% (280,254) |
Number of households with income $30k - 40k:| North Lynbrook: | 4.5% (6) |
| State: | 6.1% (288,263) |
Number of households with income $40k - 50k:| North Lynbrook: | 18.2% (24) |
| State: | 5.9% (278,079) |
Number of households with income $50k - 60k:| North Lynbrook: | 0.0% (0) |
| State: | 5.7% (267,554) |
Number of households with income $60k - 75k:| North Lynbrook: | 30.3% (40) |
| State: | 8.4% (398,344) |
Number of households with income $75k - 100k:| North Lynbrook: | 0.0% (0) |
| State: | 11.8% (554,841) |
Number of households with income $100k - 125k:| North Lynbrook: | 5.3% (7) |
| State: | 10.0% (469,794) |
Number of households with income $125k - 150k:| North Lynbrook: | 0.0% (0) |
| New York: | 7.6% (360,467) |
Number of households with income $150k - 200k:| North Lynbrook: | 10.6% (14) |
| State: | 10.1% (477,078) |
Number of households with income > $200k:| North Lynbrook: | 17.4% (23) |
| State: | 17.6% (829,233) |
Aggregate household income in North Lynbrook in 2022: $12,375,141
Median per capita income in North Lynbrook in 2022:| North Lynbrook: | $42,378 |
| New York: | $57,640 |
Change in median per capita income between 2000 and 2022:| North Lynbrook, New York: | +28.1% |
| State: | +111.6% |
Income statistics for Black or African American residents
Number of households with income < $10k:| North Lynbrook: | 0.0% (0) |
| New York: | 12.0% (128,500) |
Number of households with income $10k - 20k:| North Lynbrook: | 0.0% (0) |
| State: | 10.0% (107,541) |
Number of households with income $20k - 30k:| North Lynbrook: | 0.0% (0) |
| State: | 8.4% (90,192) |
Number of households with income $30k - 40k:| North Lynbrook: | 0.0% (0) |
| New York: | 7.4% (79,579) |
Number of households with income $40k - 50k:| North Lynbrook: | 0.0% (0) |
| State: | 6.8% (72,491) |
Number of households with income $50k - 60k:| North Lynbrook: | 0.0% (0) |
| New York: | 6.7% (71,309) |
Number of households with income $60k - 75k:| North Lynbrook: | 0.0% (0) |
| State: | 8.9% (95,050) |
Number of households with income $75k - 100k:| North Lynbrook: | 0.0% (0) |
| State: | 11.5% (123,569) |
Number of households with income $100k - 125k:| North Lynbrook: | 0.0% (0) |
| State: | 8.1% (86,632) |
Number of households with income $125k - 150k:| North Lynbrook: | 100.0% (22) |
| State: | 6.0% (64,788) |
Number of households with income $150k - 200k:| North Lynbrook: | 0.0% (0) |
| New York: | 7.2% (76,644) |
Number of households with income > $200k:| North Lynbrook: | 0.0% (0) |
| New York: | 7.0% (75,062) |
Aggregate household income in North Lynbrook in 2022: $1,021,180
Median per capita income in North Lynbrook in 2022:| North Lynbrook: | $18,173 |
| State: | $31,947 |
Change in median per capita income between 2000 and 2022:| North Lynbrook, New York: | +116.3% |
| State: | +106.1% |
Income statistics for Asian residents
Aggregate household income in North Lynbrook in 2022: $3,607,158
Median per capita income in North Lynbrook in 2022:| North Lynbrook: | $32,396 |
| State: | $46,726 |
Change in median per capita income between 2000 and 2022:| North Lynbrook, New York: | +6.4% |
| New York: | +126.6% |
Income statistics for Hispanic or Latino residents
Number of households with income < $10k:| North Lynbrook: | 0.0% (0) |
| State: | 9.9% (127,185) |
Number of households with income $10k - 20k:| North Lynbrook: | 0.0% (0) |
| State: | 10.7% (136,699) |
Number of households with income $20k - 30k:| North Lynbrook: | 0.0% (0) |
| State: | 8.1% (102,991) |
Number of households with income $30k - 40k:| North Lynbrook: | 0.0% (0) |
| New York: | 7.8% (100,149) |
Number of households with income $40k - 50k:| North Lynbrook: | 0.0% (0) |
| New York: | 6.9% (87,760) |
Number of households with income $50k - 60k:| North Lynbrook: | 0.0% (0) |
| State: | 6.3% (80,968) |
Number of households with income $60k - 75k:| North Lynbrook: | 0.0% (0) |
| State: | 8.7% (110,631) |
Number of households with income $75k - 100k:| North Lynbrook: | 0.0% (0) |
| New York: | 11.2% (142,787) |
Number of households with income $100k - 125k:| North Lynbrook: | 0.0% (0) |
| State: | 8.2% (104,850) |
Number of households with income $125k - 150k:| North Lynbrook: | 100.0% (14) |
| State: | 6.3% (80,274) |
Number of households with income $150k - 200k:| North Lynbrook: | 0.0% (0) |
| State: | 7.4% (95,117) |
Number of households with income > $200k:| North Lynbrook: | 0.0% (0) |
| New York: | 8.6% (109,514) |
Aggregate household income in North Lynbrook in 2022: $7,173,556
Median per capita income in North Lynbrook in 2022:| North Lynbrook: | $18,555 |
| State: | $29,761 |
Change in median per capita income between 2000 and 2022:| North Lynbrook, New York: | +23.7% |
| State: | +132.7% |
Income statistics for other residents
Number of households with income < $10k:| North Lynbrook: | 0.0% (0) |
| State: | 10.3% (69,252) |
Number of households with income $10k - 20k:| North Lynbrook: | 0.0% (0) |
| New York: | 11.0% (73,890) |
Number of households with income $20k - 30k:| North Lynbrook: | 0.0% (0) |
| State: | 8.8% (59,096) |
Number of households with income $30k - 40k:| North Lynbrook: | 0.0% (0) |
| New York: | 8.1% (54,418) |
Number of households with income $40k - 50k:| North Lynbrook: | 0.0% (0) |
| State: | 7.3% (49,042) |
Number of households with income $50k - 60k:| North Lynbrook: | 0.0% (0) |
| State: | 6.5% (43,945) |
Number of households with income $60k - 75k:| North Lynbrook: | 0.0% (0) |
| New York: | 9.5% (64,087) |
Number of households with income $75k - 100k:| North Lynbrook: | 0.0% (0) |
| New York: | 10.9% (73,094) |
Number of households with income $100k - 125k:| North Lynbrook: | 0.0% (0) |
| State: | 7.9% (53,055) |
Number of households with income $125k - 150k:| North Lynbrook: | 100.0% (15) |
| New York: | 5.9% (39,446) |
Number of households with income $150k - 200k:| North Lynbrook: | 0.0% (0) |
| State: | 7.2% (48,653) |
Number of households with income > $200k:| North Lynbrook: | 0.0% (0) |
| State: | 6.6% (44,703) |
Aggregate household income in North Lynbrook in 2022: $881,008
Median per capita income in North Lynbrook in 2022:| North Lynbrook: | $29,955 |
| State: | $26,975 |
Change in median per capita income between 2000 and 2022:| North Lynbrook, New York: | +149.6% |
| State: | +144.6% |