New Canaan, Connecticut (CT) income map, earnings map, and wages data
The median household income in New Canaan, CT in 2022 was $239,924, which was 63.1% greater than the median annual income of $88,429 across the entire state of Connecticut. Compared to the median income of $141,788 in 2000 this represents an increase of 40.9%. The per capita income in 2022 was $150,091, which means an increase of 45.3% compared to 2000 when it was $82,049.
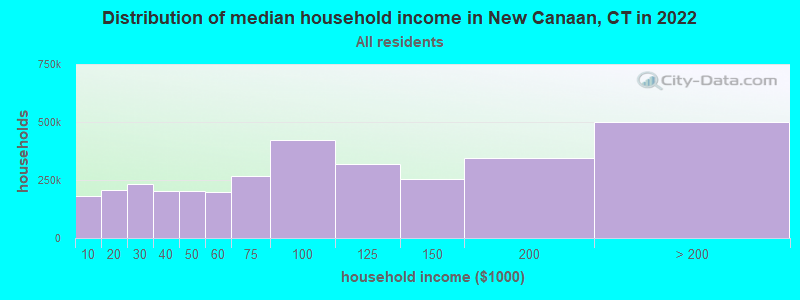
Income statistics for all residents
Median household income in New Canaan, CT in 2022:| New Canaan: | $239,925 |
| State: | $88,429 |
Change in median household income between 2000 and 2022:| New Canaan, Connecticut: | +69.2% |
| Connecticut: | +64.0% |
Number of households with income < $10k:| New Canaan: | 5.2% (97,726) |
| Connecticut: | 5.1% (72,746) |
Number of households with income $10k - 20k:| New Canaan: | 5.8% (110,200) |
| State: | 5.7% (81,643) |
Number of households with income $20k - 30k:| New Canaan: | 6.6% (124,736) |
| State: | 6.5% (92,844) |
Number of households with income $30k - 40k:| New Canaan: | 5.9% (111,943) |
| State: | 5.9% (83,934) |
Number of households with income $40k - 50k:| New Canaan: | 5.9% (111,225) |
| Connecticut: | 5.8% (83,025) |
Number of households with income $50k - 60k:| New Canaan: | 5.8% (109,063) |
| State: | 5.7% (81,788) |
Number of households with income $60k - 75k:| New Canaan: | 8.1% (152,811) |
| State: | 8.1% (115,651) |
Number of households with income $75k - 100k:| New Canaan: | 12.6% (238,657) |
| State: | 12.6% (180,173) |
Number of households with income $100k - 125k:| New Canaan: | 9.8% (185,792) |
| Connecticut: | 9.9% (141,231) |
Number of households with income $125k - 150k:| New Canaan: | 7.8% (148,373) |
| State: | 7.9% (112,826) |
Number of households with income $150k - 200k:| New Canaan: | 10.7% (202,962) |
| State: | 10.8% (154,641) |
Number of households with income > $200k:| New Canaan: | 16.0% (303,212) |
| Connecticut: | 16.3% (233,133) |
Aggregate household income in New Canaan in 2022: $68,677,455,498
Median family income in New Canaan in 2022:| New Canaan: | $313,140 |
| State: | $115,183 |
Median non-family income in New Canaan in 2022:| New Canaan: | $109,594 |
| State: | $50,964 |
Change in median non-family income between 2000 and 2022:| New Canaan, Connecticut: | +71.5% |
| State: | +65.1% |
Median per capita income in New Canaan in 2022:| New Canaan: | $150,092 |
| State: | $51,581 |
Change in median per capita income between 2000 and 2022:| New Canaan, Connecticut: | +82.9% |
| Connecticut: | +79.3% |
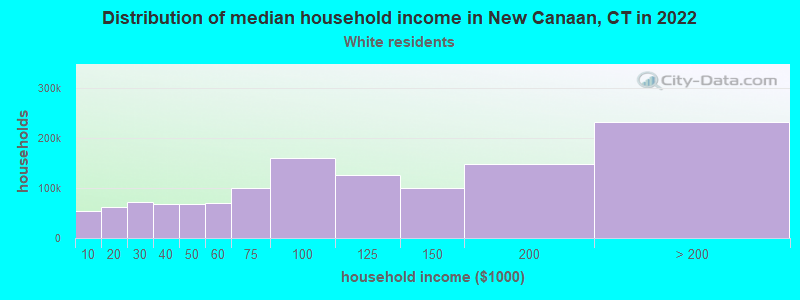
Income statistics for White residents
Median household income in New Canaan, CT in 2022:| New Canaan: | $242,883 |
| State: | $96,890 |
Change in median household income between 2000 and 2022:| New Canaan, Connecticut: | +69.4% |
| Connecticut: | +68.5% |
Number of households with income < $10k:| New Canaan: | 4.2% (53,124) |
| State: | 4.2% (42,265) |
Number of households with income $10k - 20k:| New Canaan: | 4.9% (61,077) |
| State: | 4.8% (48,323) |
Number of households with income $20k - 30k:| New Canaan: | 5.8% (72,636) |
| Connecticut: | 5.7% (57,716) |
Number of households with income $30k - 40k:| New Canaan: | 5.4% (67,235) |
| State: | 5.3% (53,827) |
Number of households with income $40k - 50k:| New Canaan: | 5.3% (66,957) |
| Connecticut: | 5.3% (53,301) |
Number of households with income $50k - 60k:| New Canaan: | 5.6% (69,682) |
| State: | 5.5% (55,690) |
Number of households with income $60k - 75k:| New Canaan: | 7.9% (99,579) |
| Connecticut: | 8.0% (80,329) |
Number of households with income $75k - 100k:| New Canaan: | 12.7% (159,563) |
| State: | 12.7% (128,070) |
Number of households with income $100k - 125k:| New Canaan: | 10.0% (125,295) |
| Connecticut: | 10.0% (101,210) |
Number of households with income $125k - 150k:| New Canaan: | 8.0% (100,591) |
| State: | 8.0% (81,250) |
Number of households with income $150k - 200k:| New Canaan: | 11.8% (147,908) |
| State: | 11.8% (119,527) |
Number of households with income > $200k:| New Canaan: | 18.4% (231,544) |
| State: | 18.6% (187,875) |
Aggregate household income in New Canaan in 2022: $51,016,375,170
Median family income in New Canaan in 2022:| New Canaan: | $328,381 |
| State: | $128,955 |
Number of families with income < $10k:| New Canaan: | 0.2% (24) |
| Connecticut: | 1.9% (11,537) |
Number of families with income $10k - 20k:| New Canaan: | 0.3% (36) |
| State: | 1.8% (11,289) |
Number of families with income $20k - 30k:| New Canaan: | 0.3% (39) |
| Connecticut: | 3.0% (18,506) |
Number of families with income $30k - 40k:| New Canaan: | 0.4% (52) |
| State: | 2.9% (18,160) |
Number of families with income $40k - 50k:| New Canaan: | 0.6% (70) |
| Connecticut: | 3.9% (24,550) |
Number of families with income $50k - 60k:| New Canaan: | 0.7% (85) |
| State: | 4.3% (26,723) |
Number of families with income $60k - 75k:| New Canaan: | 1.3% (157) |
| State: | 7.1% (44,075) |
Number of families with income $75k - 100k:| New Canaan: | 2.1% (245) |
| State: | 12.5% (77,679) |
Number of families with income $100k - 125k:| New Canaan: | 2.9% (337) |
| State: | 11.1% (69,086) |
Number of families with income $125k - 150k:| New Canaan: | 4.3% (509) |
| State: | 9.6% (59,616) |
Number of families with income $150k - 200k:| New Canaan: | 13.2% (1,552) |
| State: | 15.7% (97,890) |
Number of families with income > $200k:| New Canaan: | 73.6% (8,677) |
| State: | 26.3% (163,417) |
Median non-family income in New Canaan in 2022:| New Canaan: | $109,175 |
| Connecticut: | $54,067 |
Change in median non-family income between 2000 and 2022:| New Canaan, Connecticut: | +73.7% |
| State: | +68.7% |
Median per capita income in New Canaan in 2022:| New Canaan: | $159,243 |
| State: | $59,916 |
Change in median per capita income between 2000 and 2022:| New Canaan, Connecticut: | +92.1% |
| State: | +90.2% |
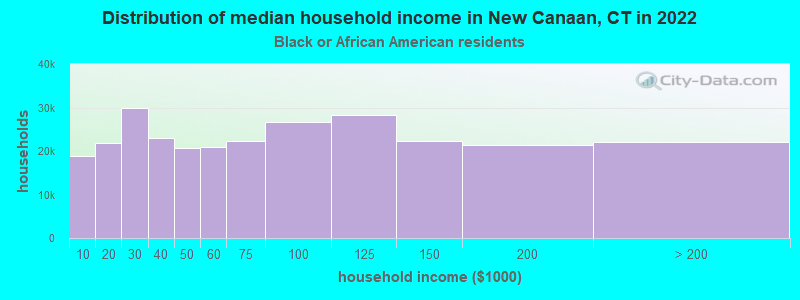
Income statistics for Black or African American residents
Median household income in New Canaan, CT in 2022:| New Canaan: | $112,399 |
| State: | $61,803 |
Change in median household income between 2000 and 2022:| New Canaan, Connecticut: | +60.9% |
| State: | +76.1% |
Number of households with income < $10k:| New Canaan: | 6.8% (18,892) |
| Connecticut: | 6.8% (9,494) |
Number of households with income $10k - 20k:| New Canaan: | 7.9% (21,895) |
| State: | 7.9% (11,003) |
Number of households with income $20k - 30k:| New Canaan: | 10.8% (29,938) |
| State: | 10.8% (15,045) |
Number of households with income $30k - 40k:| New Canaan: | 8.2% (22,886) |
| State: | 8.2% (11,501) |
Number of households with income $40k - 50k:| New Canaan: | 7.4% (20,726) |
| Connecticut: | 7.4% (10,416) |
Number of households with income $50k - 60k:| New Canaan: | 7.5% (20,961) |
| Connecticut: | 7.5% (10,534) |
Number of households with income $60k - 75k:| New Canaan: | 8.0% (22,374) |
| State: | 8.0% (11,244) |
Number of households with income $75k - 100k:| New Canaan: | 9.6% (26,605) |
| State: | 9.6% (13,370) |
Number of households with income $100k - 125k:| New Canaan: | 10.2% (28,344) |
| Connecticut: | 10.2% (14,244) |
Number of households with income $125k - 150k:| New Canaan: | 8.0% (22,378) |
| Connecticut: | 8.0% (11,246) |
Number of households with income $150k - 200k:| New Canaan: | 7.7% (21,346) |
| Connecticut: | 7.7% (10,727) |
Number of households with income > $200k:| New Canaan: | 7.9% (22,060) |
| State: | 7.9% (11,086) |
Aggregate household income in New Canaan in 2022: $23,738,159
Median family income in New Canaan in 2022:| New Canaan: | $150,801 |
| Connecticut: | $87,228 |
Number of families with income $30k - 40k:| New Canaan: | 37.9% (9) |
| State: | 7.7% (6,445) |
Number of families with income $60k - 75k:| New Canaan: | 62.1% (15) |
| State: | 8.2% (6,861) |
Median non-family income in New Canaan in 2022:| New Canaan: | $138,849 |
| State: | $38,608 |
Change in median non-family income between 2000 and 2022:| New Canaan, Connecticut: | +77.0% |
| State: | +77.0% |
Median per capita income in New Canaan in 2022:| New Canaan: | $41,817 |
| Connecticut: | $36,289 |
Change in median per capita income between 2000 and 2022:| New Canaan, Connecticut: | +115.2% |
| State: | +117.5% |
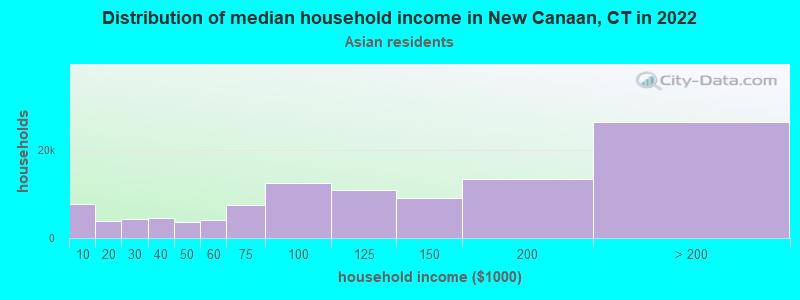
Income statistics for Asian residents
Median household income in New Canaan, CT in 2022:| New Canaan: | $233,949 |
| State: | $110,568 |
Change in median household income between 2000 and 2022:| New Canaan, Connecticut: | +110.1% |
| Connecticut: | +79.5% |
Number of households with income < $10k:| New Canaan: | 7.1% (7,676) |
| State: | 7.1% (4,245) |
Number of households with income $10k - 20k:| New Canaan: | 3.5% (3,774) |
| Connecticut: | 3.5% (2,087) |
Number of households with income $20k - 30k:| New Canaan: | 4.1% (4,455) |
| State: | 4.1% (2,464) |
Number of households with income $30k - 40k:| New Canaan: | 4.1% (4,481) |
| Connecticut: | 4.1% (2,478) |
Number of households with income $40k - 50k:| New Canaan: | 3.3% (3,585) |
| Connecticut: | 3.3% (1,983) |
Number of households with income $50k - 60k:| New Canaan: | 3.9% (4,209) |
| State: | 3.9% (2,328) |
Number of households with income $60k - 75k:| New Canaan: | 7.0% (7,645) |
| Connecticut: | 7.0% (4,228) |
Number of households with income $75k - 100k:| New Canaan: | 11.5% (12,496) |
| State: | 11.5% (6,911) |
Number of households with income $100k - 125k:| New Canaan: | 10.2% (11,078) |
| State: | 10.2% (6,127) |
Number of households with income $125k - 150k:| New Canaan: | 8.5% (9,184) |
| State: | 8.5% (5,079) |
Number of households with income $150k - 200k:| New Canaan: | 12.4% (13,442) |
| Connecticut: | 12.4% (7,434) |
Number of households with income > $200k:| New Canaan: | 24.4% (26,509) |
| State: | 24.4% (14,661) |
Aggregate household income in New Canaan in 2022: $67,699,847
Median family income in New Canaan in 2022:| New Canaan: | $270,923 |
| State: | $134,548 |
Number of families with income < $10k:| New Canaan: | 6.3% (24) |
| Connecticut: | 4.3% (1,875) |
Number of families with income $30k - 40k:| New Canaan: | 5.5% (21) |
| State: | 3.8% (1,652) |
Number of families with income $75k - 100k:| New Canaan: | 4.9% (19) |
| Connecticut: | 11.0% (4,844) |
Number of families with income $100k - 125k:| New Canaan: | 5.3% (20) |
| State: | 10.5% (4,621) |
Number of families with income $125k - 150k:| New Canaan: | 8.3% (32) |
| State: | 8.2% (3,588) |
Number of families with income $150k - 200k:| New Canaan: | 32.4% (124) |
| State: | 14.2% (6,237) |
Number of families with income > $200k:| New Canaan: | 37.3% (143) |
| State: | 30.8% (13,522) |
Median non-family income in New Canaan in 2022:| New Canaan: | $65,254 |
| State: | $63,785 |
Change in median non-family income between 2000 and 2022:| New Canaan, Connecticut: | +148.6% |
| Connecticut: | +77.9% |
Median per capita income in New Canaan in 2022:| New Canaan: | $87,832 |
| Connecticut: | $55,295 |
Change in median per capita income between 2000 and 2022:| New Canaan, Connecticut: | +103.6% |
| State: | +97.8% |
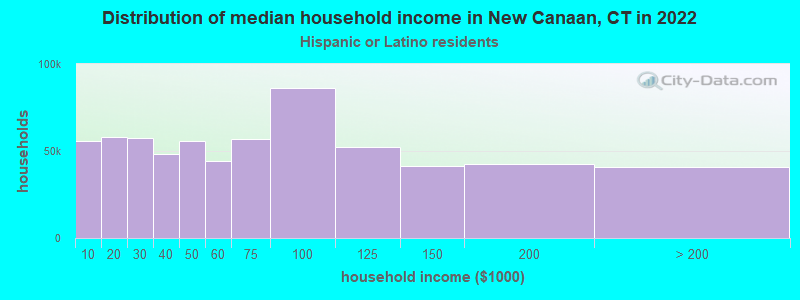
Income statistics for Hispanic or Latino residents
Median household income in New Canaan, CT in 2022:| New Canaan: | $162,093 |
| Connecticut: | $60,275 |
Change in median household income between 2000 and 2022:| New Canaan, Connecticut: | +67.8% |
| Connecticut: | +87.9% |
Number of households with income < $10k:| New Canaan: | 8.7% (55,970) |
| State: | 8.7% (18,584) |
Number of households with income $10k - 20k:| New Canaan: | 9.1% (57,931) |
| State: | 9.1% (19,235) |
Number of households with income $20k - 30k:| New Canaan: | 8.9% (57,191) |
| State: | 8.9% (18,989) |
Number of households with income $30k - 40k:| New Canaan: | 7.5% (48,089) |
| State: | 7.5% (15,967) |
Number of households with income $40k - 50k:| New Canaan: | 8.7% (55,615) |
| Connecticut: | 8.7% (18,466) |
Number of households with income $50k - 60k:| New Canaan: | 6.9% (44,291) |
| Connecticut: | 6.9% (14,706) |
Number of households with income $60k - 75k:| New Canaan: | 8.9% (56,886) |
| State: | 8.9% (18,888) |
Number of households with income $75k - 100k:| New Canaan: | 13.5% (86,344) |
| State: | 13.5% (28,669) |
Number of households with income $100k - 125k:| New Canaan: | 8.2% (52,507) |
| Connecticut: | 8.2% (17,434) |
Number of households with income $125k - 150k:| New Canaan: | 6.5% (41,418) |
| Connecticut: | 6.5% (13,752) |
Number of households with income $150k - 200k:| New Canaan: | 6.6% (42,508) |
| State: | 6.6% (14,114) |
Number of households with income > $200k:| New Canaan: | 6.4% (41,050) |
| State: | 6.4% (13,630) |
Aggregate household income in New Canaan in 2022: $149,754,774
Median family income in New Canaan in 2022:| New Canaan: | $164,041 |
| State: | $68,336 |
Number of families with income < $10k:| New Canaan: | 1.2% (12) |
| Connecticut: | 5.2% (7,456) |
Number of families with income $10k - 20k:| New Canaan: | 2.8% (30) |
| State: | 6.0% (8,616) |
Number of families with income $20k - 30k:| New Canaan: | 2.9% (31) |
| State: | 8.9% (12,680) |
Number of families with income $30k - 40k:| New Canaan: | 2.8% (30) |
| State: | 8.5% (12,090) |
Number of families with income $40k - 50k:| New Canaan: | 3.2% (34) |
| Connecticut: | 8.8% (12,624) |
Number of families with income $50k - 60k:| New Canaan: | 3.8% (40) |
| Connecticut: | 8.4% (11,924) |
Number of families with income $60k - 75k:| New Canaan: | 3.9% (41) |
| State: | 8.9% (12,677) |
Number of families with income $75k - 100k:| New Canaan: | 5.8% (62) |
| Connecticut: | 14.3% (20,457) |
Number of families with income $100k - 125k:| New Canaan: | 5.1% (54) |
| State: | 8.2% (11,720) |
Number of families with income $125k - 150k:| New Canaan: | 8.9% (94) |
| Connecticut: | 8.2% (11,729) |
Number of families with income $150k - 200k:| New Canaan: | 13.7% (144) |
| State: | 7.1% (10,096) |
Number of families with income > $200k:| New Canaan: | 45.9% (484) |
| State: | 7.4% (10,622) |
Median non-family income in New Canaan in 2022:| New Canaan: | $347,771 |
| Connecticut: | $36,714 |
Change in median non-family income between 2000 and 2022:| New Canaan, Connecticut: | +73.9% |
| State: | +90.0% |
Median per capita income in New Canaan in 2022:| New Canaan: | $76,047 |
| Connecticut: | $28,507 |
Change in median per capita income between 2000 and 2022:| New Canaan, Connecticut: | +80.3% |
| State: | +117.2% |
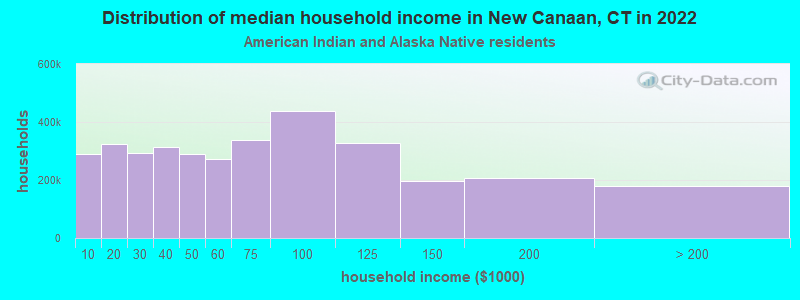
Income statistics for American Indian and Alaska Native residents
Median household income in New Canaan, CT in 2022:| New Canaan: | $115,420 |
| State: | $41,848 |
Change in median household income between 2000 and 2022:| New Canaan, Connecticut: | +12.9% |
| Connecticut: | +12.9% |
Number of households with income < $10k:| New Canaan: | 8.4% (290,794) |
| Connecticut: | 10.2% (340) |
Number of households with income $10k - 20k:| New Canaan: | 9.4% (324,518) |
| State: | 8.5% (283) |
Number of households with income $20k - 30k:| New Canaan: | 8.5% (293,531) |
| State: | 9.4% (314) |
Number of households with income $30k - 40k:| New Canaan: | 9.1% (314,482) |
| Connecticut: | 10.1% (337) |
Number of households with income $40k - 50k:| New Canaan: | 8.3% (288,464) |
| Connecticut: | 13.4% (447) |
Number of households with income $50k - 60k:| New Canaan: | 7.8% (271,998) |
| State: | 3.1% (104) |
Number of households with income $60k - 75k:| New Canaan: | 9.8% (339,033) |
| State: | 5.6% (188) |
Number of households with income $75k - 100k:| New Canaan: | 12.6% (437,637) |
| State: | 13.4% (447) |
Number of households with income $100k - 125k:| New Canaan: | 9.4% (327,266) |
| State: | 9.5% (317) |
Number of households with income $125k - 150k:| New Canaan: | 5.6% (195,932) |
| State: | 3.9% (131) |
Number of households with income $150k - 200k:| New Canaan: | 6.0% (206,550) |
| State: | 6.3% (212) |
Number of households with income > $200k:| New Canaan: | 5.2% (178,781) |
| State: | 6.8% (228) |
Aggregate household income in New Canaan in 2022: $863,616
Median family income in New Canaan in 2022:| New Canaan: | $139,737 |
| State: | $57,217 |
Number of families with income $100k - 125k:| New Canaan: | 100.0% (25) |
| Connecticut: | 7.9% (159) |
Median per capita income in New Canaan in 2022:| New Canaan: | $86,279 |
| State: | $25,355 |
Change in median per capita income between 2000 and 2022:| New Canaan, Connecticut: | +45.9% |
| State: | +39.4% |
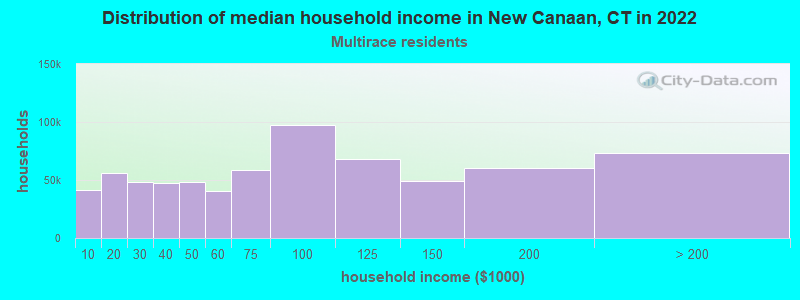
Income statistics for Multirace residents
Median household income in New Canaan, CT in 2022:| New Canaan: | $438,888 |
| State: | $77,277 |
Change in median household income between 2000 and 2022:| New Canaan, Connecticut: | +119.4% |
| State: | +113.6% |
Number of households with income < $10k:| New Canaan: | 6.0% (41,215) |
| State: | 6.0% (7,457) |
Number of households with income $10k - 20k:| New Canaan: | 8.1% (56,038) |
| State: | 8.1% (10,139) |
Number of households with income $20k - 30k:| New Canaan: | 7.0% (48,097) |
| Connecticut: | 7.0% (8,702) |
Number of households with income $30k - 40k:| New Canaan: | 6.9% (47,234) |
| Connecticut: | 6.9% (8,546) |
Number of households with income $40k - 50k:| New Canaan: | 7.0% (48,152) |
| State: | 7.0% (8,712) |
Number of households with income $50k - 60k:| New Canaan: | 5.9% (40,519) |
| State: | 5.9% (7,331) |
Number of households with income $60k - 75k:| New Canaan: | 8.5% (58,774) |
| State: | 8.5% (10,634) |
Number of households with income $75k - 100k:| New Canaan: | 14.1% (97,276) |
| Connecticut: | 14.1% (17,600) |
Number of households with income $100k - 125k:| New Canaan: | 9.9% (68,441) |
| State: | 9.9% (12,383) |
Number of households with income $125k - 150k:| New Canaan: | 7.2% (49,307) |
| Connecticut: | 7.2% (8,921) |
Number of households with income $150k - 200k:| New Canaan: | 8.8% (60,366) |
| Connecticut: | 8.8% (10,922) |
Number of households with income > $200k:| New Canaan: | 10.6% (73,217) |
| State: | 10.6% (13,247) |
Aggregate household income in New Canaan in 2022: $297,489,699
Median non-family income in New Canaan in 2022:| New Canaan: | $362,047 |
| State: | $44,462 |
Change in median non-family income between 2000 and 2022:| New Canaan, Connecticut: | +81.0% |
| State: | +97.6% |
Median per capita income in New Canaan in 2022:| New Canaan: | $360,610 |
| State: | $32,794 |
Change in median per capita income between 2000 and 2022:| New Canaan, Connecticut: | +95.5% |
| Connecticut: | +117.2% |
Income statistics for other residents
Number of households with income < $10k:| New Canaan: | 9.0% (1,619) |
| Connecticut: | 9.0% (8,596) |
Number of households with income $10k - 20k:| New Canaan: | 10.2% (1,841) |
| Connecticut: | 10.2% (9,773) |
Number of households with income $20k - 30k:| New Canaan: | 9.1% (1,637) |
| State: | 9.1% (8,691) |
Number of households with income $30k - 40k:| New Canaan: | 7.8% (1,402) |
| State: | 7.8% (7,447) |
Number of households with income $40k - 50k:| New Canaan: | 8.2% (1,480) |
| State: | 8.2% (7,860) |
Number of households with income $50k - 60k:| New Canaan: | 6.0% (1,084) |
| State: | 6.0% (5,757) |
Number of households with income $60k - 75k:| New Canaan: | 9.3% (1,684) |
| State: | 9.3% (8,942) |
Number of households with income $75k - 100k:| New Canaan: | 14.3% (2,580) |
| Connecticut: | 14.3% (13,700) |
Number of households with income $100k - 125k:| New Canaan: | 7.2% (1,301) |
| State: | 7.2% (6,906) |
Number of households with income $125k - 150k:| New Canaan: | 6.5% (1,170) |
| Connecticut: | 6.5% (6,215) |
Number of households with income $150k - 200k:| New Canaan: | 6.1% (1,104) |
| Connecticut: | 6.1% (5,865) |
Number of households with income > $200k:| New Canaan: | 6.3% (1,142) |
| Connecticut: | 6.3% (6,065) |
Median per capita income in New Canaan in 2022:| New Canaan: | $5,457 |
| Connecticut: | $29,353 |