Nesmith, South Carolina (SC) income map, earnings map, and wages data
The median household income in Nesmith, SC in 2022 was $41,130, which was 55.9% less than the median annual income of $64,115 across the entire state of South Carolina. Compared to the median income of $24,543 in 2000 this represents an increase of 40.3%. The per capita income in 2022 was $20,821, which means an increase of 47.7% compared to 2000 when it was $10,886.
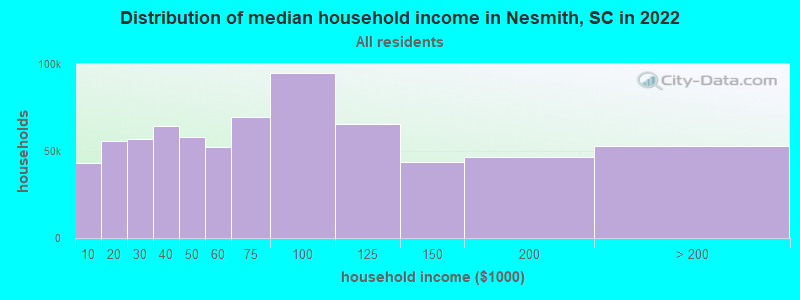
Income statistics for all residents
Median household income in Nesmith, SC in 2022:| Nesmith: | $41,131 |
| South Carolina: | $64,115 |
Change in median household income between 2000 and 2022:| Nesmith, South Carolina: | +67.6% |
| South Carolina: | +72.9% |
Number of households with income < $10k:| Nesmith: | 6.1% (43,188) |
| State: | 6.1% (130,922) |
Number of households with income $10k - 20k:| Nesmith: | 7.9% (55,886) |
| South Carolina: | 7.9% (168,918) |
Number of households with income $20k - 30k:| Nesmith: | 8.0% (56,614) |
| State: | 8.0% (171,564) |
Number of households with income $30k - 40k:| Nesmith: | 9.2% (64,538) |
| South Carolina: | 9.2% (195,662) |
Number of households with income $40k - 50k:| Nesmith: | 8.3% (58,135) |
| South Carolina: | 8.2% (176,179) |
Number of households with income $50k - 60k:| Nesmith: | 7.4% (52,404) |
| State: | 7.5% (159,159) |
Number of households with income $60k - 75k:| Nesmith: | 9.9% (69,759) |
| South Carolina: | 9.9% (211,862) |
Number of households with income $75k - 100k:| Nesmith: | 13.5% (94,666) |
| South Carolina: | 13.5% (287,601) |
Number of households with income $100k - 125k:| Nesmith: | 9.3% (65,542) |
| South Carolina: | 9.3% (199,068) |
Number of households with income $125k - 150k:| Nesmith: | 6.2% (43,859) |
| South Carolina: | 6.2% (133,330) |
Number of households with income $150k - 200k:| Nesmith: | 6.6% (46,464) |
| South Carolina: | 6.6% (141,363) |
Number of households with income > $200k:| Nesmith: | 7.5% (52,653) |
| South Carolina: | 7.5% (160,452) |
Aggregate household income in Nesmith in 2022: $1,756,480,617
Median family income in Nesmith in 2022:| Nesmith: | $52,969 |
| State: | $79,886 |
Median non-family income in Nesmith in 2022:| Nesmith: | $19,842 |
| State: | $38,426 |
Change in median non-family income between 2000 and 2022:| Nesmith, South Carolina: | +73.7% |
| State: | +78.7% |
Median per capita income in Nesmith in 2022:| Nesmith: | $20,821 |
| State: | $36,675 |
Change in median per capita income between 2000 and 2022:| Nesmith, South Carolina: | +91.3% |
| State: | +95.1% |
Income statistics for White residents
Median household income in Nesmith, SC in 2022:| Nesmith: | $49,756 |
| State: | $73,516 |
Change in median household income between 2000 and 2022:| Nesmith, South Carolina: | +68.8% |
| State: | +74.8% |
Number of households with income < $10k:| Nesmith: | 4.8% (23,817) |
| South Carolina: | 4.8% (68,379) |
Number of households with income $10k - 20k:| Nesmith: | 6.0% (29,734) |
| State: | 5.9% (85,105) |
Number of households with income $20k - 30k:| Nesmith: | 7.1% (35,222) |
| State: | 7.1% (101,178) |
Number of households with income $30k - 40k:| Nesmith: | 8.1% (40,015) |
| State: | 8.0% (114,877) |
Number of households with income $40k - 50k:| Nesmith: | 7.9% (39,227) |
| State: | 7.9% (112,749) |
Number of households with income $50k - 60k:| Nesmith: | 7.1% (35,368) |
| State: | 7.1% (101,835) |
Number of households with income $60k - 75k:| Nesmith: | 10.2% (50,579) |
| State: | 10.2% (145,879) |
Number of households with income $75k - 100k:| Nesmith: | 13.9% (69,301) |
| State: | 14.0% (200,068) |
Number of households with income $100k - 125k:| Nesmith: | 10.4% (51,519) |
| State: | 10.4% (148,542) |
Number of households with income $125k - 150k:| Nesmith: | 7.3% (36,387) |
| South Carolina: | 7.3% (105,118) |
Number of households with income $150k - 200k:| Nesmith: | 8.0% (39,593) |
| State: | 8.0% (114,506) |
Number of households with income > $200k:| Nesmith: | 9.3% (46,035) |
| State: | 9.3% (133,550) |
Aggregate household income in Nesmith in 2022: $642,349,676
Median family income in Nesmith in 2022:| Nesmith: | $74,984 |
| South Carolina: | $90,709 |
Number of families with income < $10k:| Nesmith: | 5.1% (17) |
| State: | 2.4% (22,376) |
Number of families with income $10k - 20k:| Nesmith: | 9.6% (33) |
| South Carolina: | 3.0% (28,325) |
Number of families with income $20k - 30k:| Nesmith: | 7.0% (24) |
| State: | 4.4% (42,131) |
Number of families with income $30k - 40k:| Nesmith: | 6.0% (21) |
| South Carolina: | 6.1% (57,510) |
Number of families with income $40k - 50k:| Nesmith: | 6.3% (22) |
| State: | 7.0% (66,712) |
Number of families with income $50k - 60k:| Nesmith: | 10.8% (37) |
| State: | 6.6% (62,489) |
Number of families with income $60k - 75k:| Nesmith: | 14.7% (51) |
| State: | 10.0% (94,724) |
Number of families with income $75k - 100k:| Nesmith: | 14.6% (50) |
| South Carolina: | 15.5% (147,207) |
Number of families with income $100k - 125k:| Nesmith: | 3.9% (13) |
| State: | 12.5% (118,160) |
Number of families with income $125k - 150k:| Nesmith: | 22.1% (76) |
| State: | 9.5% (90,395) |
Median non-family income in Nesmith in 2022:| Nesmith: | $18,029 |
| State: | $42,596 |
Change in median non-family income between 2000 and 2022:| Nesmith, South Carolina: | +71.5% |
| South Carolina: | +74.9% |
Median per capita income in Nesmith in 2022:| Nesmith: | $28,148 |
| State: | $42,728 |
Change in median per capita income between 2000 and 2022:| Nesmith, South Carolina: | +89.1% |
| State: | +93.4% |
Income statistics for Black or African American residents
Median household income in Nesmith, SC in 2022:| Nesmith: | $40,144 |
| State: | $44,187 |
Change in median household income between 2000 and 2022:| Nesmith, South Carolina: | +73.2% |
| South Carolina: | +76.5% |
Number of households with income < $10k:| Nesmith: | 10.0% (24,215) |
| State: | 10.0% (52,303) |
Number of households with income $10k - 20k:| Nesmith: | 13.4% (32,375) |
| State: | 13.4% (69,913) |
Number of households with income $20k - 30k:| Nesmith: | 10.4% (25,103) |
| State: | 10.4% (54,216) |
Number of households with income $30k - 40k:| Nesmith: | 12.0% (29,038) |
| South Carolina: | 12.0% (62,722) |
Number of households with income $40k - 50k:| Nesmith: | 9.2% (22,120) |
| State: | 9.2% (47,773) |
Number of households with income $50k - 60k:| Nesmith: | 8.3% (19,945) |
| State: | 8.3% (43,083) |
Number of households with income $60k - 75k:| Nesmith: | 9.3% (22,519) |
| State: | 9.3% (48,640) |
Number of households with income $75k - 100k:| Nesmith: | 12.2% (29,500) |
| State: | 12.2% (63,723) |
Number of households with income $100k - 125k:| Nesmith: | 6.4% (15,331) |
| South Carolina: | 6.4% (33,117) |
Number of households with income $125k - 150k:| Nesmith: | 3.2% (7,622) |
| South Carolina: | 3.2% (16,465) |
Number of households with income $150k - 200k:| Nesmith: | 3.2% (7,718) |
| South Carolina: | 3.2% (16,672) |
Number of households with income > $200k:| Nesmith: | 2.3% (5,654) |
| State: | 2.3% (12,213) |
Aggregate household income in Nesmith in 2022: $147,568,683
Median family income in Nesmith in 2022:| Nesmith: | $47,322 |
| South Carolina: | $54,267 |
Number of families with income < $10k:| Nesmith: | 8.1% (38) |
| State: | 7.3% (23,752) |
Number of families with income $10k - 20k:| Nesmith: | 14.2% (66) |
| South Carolina: | 8.5% (27,789) |
Number of families with income $20k - 30k:| Nesmith: | 15.1% (70) |
| South Carolina: | 9.4% (30,766) |
Number of families with income $30k - 40k:| Nesmith: | 13.3% (62) |
| South Carolina: | 11.6% (37,651) |
Number of families with income $40k - 50k:| Nesmith: | 17.7% (83) |
| State: | 9.5% (30,858) |
Number of families with income $50k - 60k:| Nesmith: | 10.7% (50) |
| South Carolina: | 8.7% (28,419) |
Number of families with income $60k - 75k:| Nesmith: | 10.5% (49) |
| State: | 9.6% (31,402) |
Number of families with income $75k - 100k:| Nesmith: | 10.3% (48) |
| South Carolina: | 15.2% (49,441) |
Median non-family income in Nesmith in 2022:| Nesmith: | $25,137 |
| State: | $28,585 |
Change in median non-family income between 2000 and 2022:| Nesmith, South Carolina: | +93.4% |
| South Carolina: | +100.5% |
Median per capita income in Nesmith in 2022:| Nesmith: | $17,910 |
| South Carolina: | $24,863 |
Change in median per capita income between 2000 and 2022:| Nesmith, South Carolina: | +106.0% |
| State: | +111.1% |
Income statistics for American Indian and Alaska Native residents
Number of households with income < $10k:| Nesmith: | 6.0% (391) |
| South Carolina: | 6.0% (394) |
Number of households with income $10k - 20k:| Nesmith: | 15.2% (986) |
| State: | 15.2% (994) |
Number of households with income $20k - 30k:| Nesmith: | 6.9% (450) |
| State: | 6.9% (454) |
Number of households with income $30k - 40k:| Nesmith: | 10.8% (700) |
| South Carolina: | 10.8% (705) |
Number of households with income $40k - 50k:| Nesmith: | 8.5% (551) |
| State: | 8.5% (555) |
Number of households with income $50k - 60k:| Nesmith: | 9.2% (596) |
| State: | 9.2% (601) |
Number of households with income $60k - 75k:| Nesmith: | 5.8% (377) |
| State: | 5.8% (380) |
Number of households with income $75k - 100k:| Nesmith: | 10.7% (692) |
| South Carolina: | 10.7% (697) |
Number of households with income $100k - 125k:| Nesmith: | 12.6% (816) |
| State: | 12.6% (822) |
Number of households with income $125k - 150k:| Nesmith: | 3.5% (226) |
| South Carolina: | 3.5% (228) |
Number of households with income $150k - 200k:| Nesmith: | 3.6% (232) |
| State: | 3.6% (234) |
Number of households with income > $200k:| Nesmith: | 7.3% (473) |
| State: | 7.3% (477) |
Median per capita income in Nesmith in 2022:| Nesmith: | $26,940 |
| South Carolina: | $26,654 |
Change in median per capita income between 2000 and 2022:| Nesmith, South Carolina: | +77.1% |
| State: | +73.9% |
Income statistics for Multirace residents
Median household income in Nesmith, SC in 2022:| Nesmith: | $12,531 |
| State: | $61,314 |
Change in median household income between 2000 and 2022:| Nesmith, South Carolina: | +100.5% |
| South Carolina: | +94.4% |
Number of households with income < $10k:| Nesmith: | 6.9% (687) |
| State: | 6.9% (6,974) |
Number of households with income $10k - 20k:| Nesmith: | 8.1% (805) |
| South Carolina: | 8.0% (8,052) |
Number of households with income $20k - 30k:| Nesmith: | 9.8% (979) |
| State: | 9.9% (9,972) |
Number of households with income $30k - 40k:| Nesmith: | 10.0% (997) |
| State: | 10.0% (10,121) |
Number of households with income $40k - 50k:| Nesmith: | 8.1% (811) |
| South Carolina: | 8.1% (8,188) |
Number of households with income $50k - 60k:| Nesmith: | 6.4% (637) |
| South Carolina: | 6.5% (6,530) |
Number of households with income $60k - 75k:| Nesmith: | 8.9% (890) |
| State: | 8.9% (9,021) |
Number of households with income $75k - 100k:| Nesmith: | 13.6% (1,356) |
| South Carolina: | 13.4% (13,544) |
Number of households with income $100k - 125k:| Nesmith: | 9.9% (985) |
| State: | 9.8% (9,916) |
Number of households with income $125k - 150k:| Nesmith: | 6.5% (650) |
| State: | 6.6% (6,657) |
Number of households with income $150k - 200k:| Nesmith: | 5.8% (579) |
| State: | 5.9% (5,979) |
Number of households with income > $200k:| Nesmith: | 6.1% (613) |
| South Carolina: | 6.2% (6,266) |
Aggregate household income in Nesmith in 2022: $763,004
Median family income in Nesmith in 2022:| Nesmith: | $13,016 |
| State: | $72,647 |
Number of families with income < $10k:| Nesmith: | 100.0% (19) |
| State: | 4.6% (3,104) |
Median per capita income in Nesmith in 2022:| Nesmith: | $5,635 |
| State: | $26,391 |
Change in median per capita income between 2000 and 2022:| Nesmith, South Carolina: | +125.9% |
| South Carolina: | +120.8% |