The median household income in Mystic, CT in 2022 was $124,345, which was 28.9% greater than the median annual income of $88,429 across the entire state of Connecticut. Compared to the median income of $62,236 in 2000 this represents an increase of 49.9%. The per capita income in 2022 was $71,837, which means an increase of 53.5% compared to 2000 when it was $33,376.
Whole page based on the data from 2000 / 2022 when the population of Mystic, Connecticut was 4,001 / 4,435
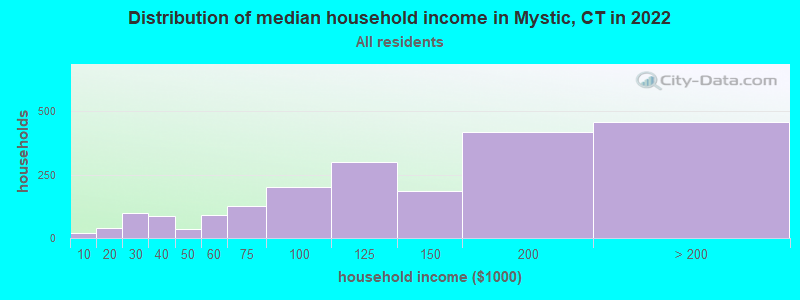
Income statistics for all residents
Median household income in Mystic, CT in 2022:
Mystic:
$124,345
Connecticut:
$88,429
Change in median household income between 2000 and 2022:
Mystic, Connecticut:
+99.8%
State:
+64.0%
Number of households with income < $10k:
Mystic:
0.9% (19)
Connecticut:
5.1% (72,746)
Number of households with income $10k - 20k:
Mystic:
1.9% (38)
Connecticut:
5.7% (81,643)
Number of households with income $20k - 30k:
Mystic:
4.7% (97)
Connecticut:
6.5% (92,844)
Number of households with income $30k - 40k:
Mystic:
4.1% (85)
State:
5.9% (83,934)
Number of households with income $40k - 50k:
Mystic:
1.8% (36)
Connecticut:
5.8% (83,025)
Number of households with income $50k - 60k:
Mystic:
4.5% (92)
Connecticut:
5.7% (81,788)
Number of households with income $60k - 75k:
Mystic:
6.1% (125)
State:
8.1% (115,651)
Number of households with income $75k - 100k:
Mystic:
9.9% (203)
Connecticut:
12.6% (180,173)
Number of households with income $100k - 125k:
Mystic:
14.6% (299)
State:
9.9% (141,231)
Number of households with income $125k - 150k:
Mystic:
9.0% (184)
State:
7.9% (112,826)
Number of households with income $150k - 200k:
Mystic:
20.3% (417)
State:
10.8% (154,641)
Number of households with income > $200k:
Mystic:
22.3% (458)
State:
16.3% (233,133)
Aggregate household income in Mystic in 2022: $317,462,908
Median family income in Mystic in 2022:
Mystic:
$172,916
Connecticut:
$115,183
Number of families with income < $10k:
Mystic:
0.4% (4)
Connecticut:
2.6% (23,251)
Number of families with income $20k - 30k:
Mystic:
1.4% (17)
State:
4.1% (36,835)
Number of families with income $30k - 40k:
Mystic:
0.5% (6)
State:
4.2% (38,052)
Number of families with income $40k - 50k:
Mystic:
1.6% (19)
Connecticut:
4.8% (43,104)
Number of families with income $50k - 60k:
Mystic:
1.7% (21)
Connecticut:
4.8% (43,284)
Number of families with income $60k - 75k:
Mystic:
3.6% (43)
State:
7.4% (66,521)
Number of families with income $75k - 100k:
Mystic:
8.1% (96)
State:
12.9% (116,232)
Number of families with income $100k - 125k:
Mystic:
13.9% (164)
State:
10.6% (95,504)
Number of families with income $125k - 150k:
Mystic:
8.0% (94)
State:
9.5% (86,149)
Number of families with income $150k - 200k:
Mystic:
28.2% (333)
Connecticut:
14.0% (125,908)
Number of families with income > $200k:
Mystic:
32.7% (387)
State:
22.4% (202,515)
Median non-family income in Mystic in 2022:
Mystic:
$90,542
State:
$50,964
Change in median non-family income between 2000 and 2022:
Mystic, Connecticut:
+96.9%
State:
+65.1%
Median per capita income in Mystic in 2022:
Mystic:
$71,837
Connecticut:
$51,581
Change in median per capita income between 2000 and 2022:
Mystic, Connecticut:
+115.2%
State:
+79.3%
Income statistics for White residents
Median household income in Mystic, CT in 2022:
Mystic:
$122,924
State:
$96,890
Change in median household income between 2000 and 2022:
Mystic, Connecticut:
+96.4%
State:
+68.5%
Number of households with income < $10k:
Mystic:
1.1% (19)
State:
4.2% (42,265)
Number of households with income $10k - 20k:
Mystic:
1.0% (18)
Connecticut:
4.8% (48,323)
Number of households with income $20k - 30k:
Mystic:
5.1% (89)
State:
5.7% (57,716)
Number of households with income $30k - 40k:
Mystic:
4.7% (81)
State:
5.3% (53,827)
Number of households with income $40k - 50k:
Mystic:
2.0% (34)
Connecticut:
5.3% (53,301)
Number of households with income $50k - 60k:
Mystic:
4.9% (85)
State:
5.5% (55,690)
Number of households with income $60k - 75k:
Mystic:
6.8% (118)
Connecticut:
8.0% (80,329)
Number of households with income $75k - 100k:
Mystic:
10.0% (174)
State:
12.7% (128,070)
Number of households with income $100k - 125k:
Mystic:
14.3% (249)
State:
10.0% (101,210)
Number of households with income $125k - 150k:
Mystic:
9.6% (167)
Connecticut:
8.0% (81,250)
Number of households with income $150k - 200k:
Mystic:
22.5% (392)
Connecticut:
11.8% (119,527)
Number of households with income > $200k:
Mystic:
18.0% (313)
State:
18.6% (187,875)
Aggregate household income in Mystic in 2022: $256,278,900
Median family income in Mystic in 2022:
Mystic:
$174,904
State:
$128,955
Number of families with income < $10k:
Mystic:
0.4% (4)
State:
1.9% (11,537)
Number of families with income $20k - 30k:
Mystic:
1.7% (17)
Connecticut:
3.0% (18,506)
Number of families with income $30k - 40k:
Mystic:
0.5% (5)
State:
2.9% (18,160)
Number of families with income $40k - 50k:
Mystic:
1.8% (17)
State:
3.9% (24,550)
Number of families with income $50k - 60k:
Mystic:
2.0% (19)
State:
4.3% (26,723)
Number of families with income $60k - 75k:
Mystic:
4.2% (41)
Connecticut:
7.1% (44,075)
Number of families with income $75k - 100k:
Mystic:
7.4% (72)
State:
12.5% (77,679)
Number of families with income $100k - 125k:
Mystic:
15.5% (151)
State:
11.1% (69,086)
Number of families with income $125k - 150k:
Mystic:
8.5% (83)
Connecticut:
9.6% (59,616)
Number of families with income $150k - 200k:
Mystic:
33.0% (322)
State:
15.7% (97,890)
Number of families with income > $200k:
Mystic:
25.0% (244)
State:
26.3% (163,417)
Median non-family income in Mystic in 2022:
Mystic:
$87,940
State:
$54,067
Change in median non-family income between 2000 and 2022:
Mystic, Connecticut:
+90.1%
State:
+68.7%
Median per capita income in Mystic in 2022:
Mystic:
$76,562
Connecticut:
$59,916
Change in median per capita income between 2000 and 2022:
Mystic, Connecticut:
+126.8%
State:
+90.2%
Income statistics for Black or African American residents
Aggregate household income in Mystic in 2022: $6,459,113
Median per capita income in Mystic in 2022:
Mystic:
$91,083
Connecticut:
$36,289
Income statistics for Asian residents
Median household income in Mystic, CT in 2022:
Mystic:
$105,715
State:
$110,568
Change in median household income between 2000 and 2022:
Mystic, Connecticut:
+106.3%
State:
+79.5%
Number of households with income < $10k:
Mystic:
0.0% (0)
Connecticut:
7.1% (4,245)
Number of households with income $10k - 20k:
Mystic:
0.0% (0)
State:
3.5% (2,087)
Number of households with income $20k - 30k:
Mystic:
0.0% (0)
Connecticut:
4.1% (2,464)
Number of households with income $30k - 40k:
Mystic:
0.0% (0)
State:
4.1% (2,478)
Number of households with income $40k - 50k:
Mystic:
0.0% (0)
Connecticut:
3.3% (1,983)
Number of households with income $50k - 60k:
Mystic:
11.1% (4)
State:
3.9% (2,328)
Number of households with income $60k - 75k:
Mystic:
0.0% (0)
Connecticut:
7.0% (4,228)
Number of households with income $75k - 100k:
Mystic:
0.0% (0)
State:
11.5% (6,911)
Number of households with income $100k - 125k:
Mystic:
66.7% (24)
State:
10.2% (6,127)
Number of households with income $125k - 150k:
Mystic:
0.0% (0)
State:
8.5% (5,079)
Number of households with income $150k - 200k:
Mystic:
0.0% (0)
State:
12.4% (7,434)
Number of households with income > $200k:
Mystic:
22.2% (8)
Connecticut:
24.4% (14,661)
Aggregate household income in Mystic in 2022: $5,245,640
Median per capita income in Mystic in 2022:
Mystic:
$60,828
State:
$55,295
Change in median per capita income between 2000 and 2022:
Mystic, Connecticut:
+90.5%
Connecticut:
+97.8%
Income statistics for Hispanic or Latino residents
Aggregate household income in Mystic in 2022: $17,093,066
Median per capita income in Mystic in 2022:
Mystic:
$15,904
State:
$28,507
Change in median per capita income between 2000 and 2022:: -59.5%
Mystic, Connecticut:
-59.5%
Connecticut:
+117.2%
Income statistics for American Indian and Alaska Native residents
Number of households with income < $10k:
Mystic:
0.0% (0)
State:
10.2% (340)
Number of households with income $10k - 20k:
Mystic:
0.0% (0)
State:
8.5% (283)
Number of households with income $20k - 30k:
Mystic:
0.0% (0)
State:
9.4% (314)
Number of households with income $30k - 40k:
Mystic:
0.0% (0)
State:
10.1% (337)
Number of households with income $40k - 50k:
Mystic:
0.0% (0)
State:
13.4% (447)
Number of households with income $50k - 60k:
Mystic:
0.0% (0)
State:
3.1% (104)
Number of households with income $60k - 75k:
Mystic:
0.0% (0)
State:
5.6% (188)
Number of households with income $75k - 100k:
Mystic:
100.0% (20)
Connecticut:
13.4% (447)
Number of households with income $100k - 125k:
Mystic:
0.0% (0)
State:
9.5% (317)
Number of households with income $125k - 150k:
Mystic:
0.0% (0)
State:
3.9% (131)
Number of households with income $150k - 200k:
Mystic:
0.0% (0)
State:
6.3% (212)
Number of households with income > $200k:
Mystic:
0.0% (0)
State:
6.8% (228)
Median per capita income in Mystic in 2022:
Mystic:
$37,885
State:
$25,355
Change in median per capita income between 2000 and 2022:
Mystic, Connecticut:
+45.9%
Connecticut:
+39.4%
Income statistics for Multirace residents
Median household income in Mystic, CT in 2022:
Mystic:
$259,993
State:
$77,277
Number of households with income < $10k:
Mystic:
0.0% (0)
State:
6.0% (7,457)
Number of households with income $10k - 20k:
Mystic:
0.0% (0)
State:
8.1% (10,139)
Number of households with income $20k - 30k:
Mystic:
0.0% (0)
Connecticut:
7.0% (8,702)
Number of households with income $30k - 40k:
Mystic:
0.0% (0)
Connecticut:
6.9% (8,546)
Number of households with income $40k - 50k:
Mystic:
0.0% (0)
State:
7.0% (8,712)
Number of households with income $50k - 60k:
Mystic:
0.0% (0)
State:
5.9% (7,331)
Number of households with income $60k - 75k:
Mystic:
0.0% (0)
Connecticut:
8.5% (10,634)
Number of households with income $75k - 100k:
Mystic:
0.0% (0)
Connecticut:
14.1% (17,600)
Number of households with income $100k - 125k:
Mystic:
8.8% (16)
Connecticut:
9.9% (12,383)
Number of households with income $125k - 150k:
Mystic:
0.0% (0)
State:
7.2% (8,921)
Number of households with income $150k - 200k:
Mystic:
0.0% (0)
Connecticut:
8.8% (10,922)
Number of households with income > $200k:
Mystic:
91.2% (166)
State:
10.6% (13,247)
Aggregate household income in Mystic in 2022: $51,450,395
Median per capita income in Mystic in 2022:
Mystic:
$61,509
State:
$32,794
Income statistics for other residents
Number of households with income < $10k:
Mystic:
0.0% (0)
State:
9.0% (8,596)
Number of households with income $10k - 20k:
Mystic:
56.0% (14)
State:
10.2% (9,773)
Number of households with income $20k - 30k:
Mystic:
0.0% (0)
Connecticut:
9.1% (8,691)
Number of households with income $30k - 40k:
Mystic:
0.0% (0)
State:
7.8% (7,447)
Number of households with income $40k - 50k:
Mystic:
0.0% (0)
State:
8.2% (7,860)
Number of households with income $50k - 60k:
Mystic:
0.0% (0)
Connecticut:
6.0% (5,757)
Number of households with income $60k - 75k:
Mystic:
0.0% (0)
State:
9.3% (8,942)
Number of households with income $75k - 100k:
Mystic:
0.0% (0)
Connecticut:
14.3% (13,700)
Number of households with income $100k - 125k:
Mystic:
0.0% (0)
State:
7.2% (6,906)
Number of households with income $125k - 150k:
Mystic:
0.0% (0)
Connecticut:
6.5% (6,215)
Number of households with income $150k - 200k:
Mystic:
44.0% (11)
Connecticut:
6.1% (5,865)
Number of households with income > $200k:
Mystic:
0.0% (0)
State:
6.3% (6,065)
Aggregate household income in Mystic in 2022: $3,944,457
Median per capita income in Mystic in 2022:
Mystic:
$38,350
Connecticut:
$29,353
Change in median per capita income between 2000 and 2022:
Mystic, Connecticut:
+52.2%
State:
+165.8%
Discuss Mystic, Connecticut (CT) on our hugely popular Connecticut forum.