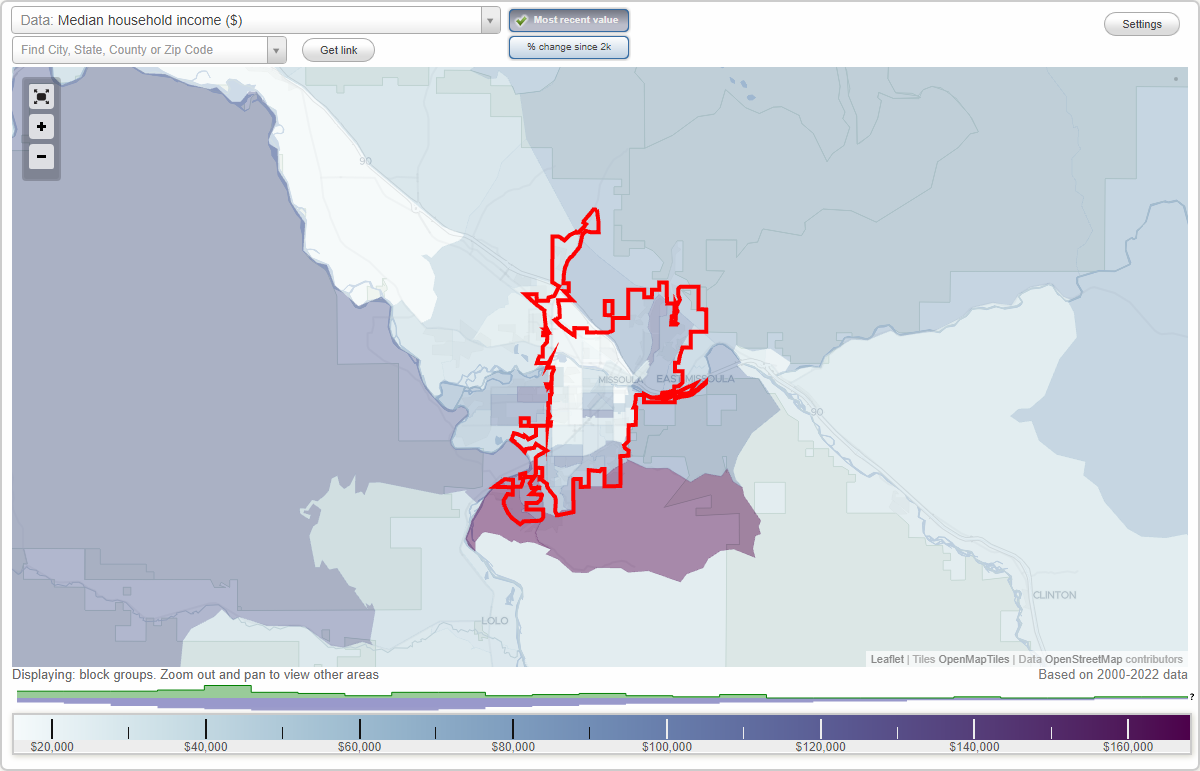
The median household income in Missoula, MT in 2022 was $59,590, which was 13.5% less than the median annual income of $67,631 across the entire state of Montana. Compared to the median income of $30,366 in 2000 this represents an increase of 49.0%. The per capita income in 2022 was $40,557, which means an increase of 57.7% compared to 2000 when it was $17,166.
Whole page based on the data from 2000 / 2022 when the population of Missoula, Montana was 57,053 / 76,960
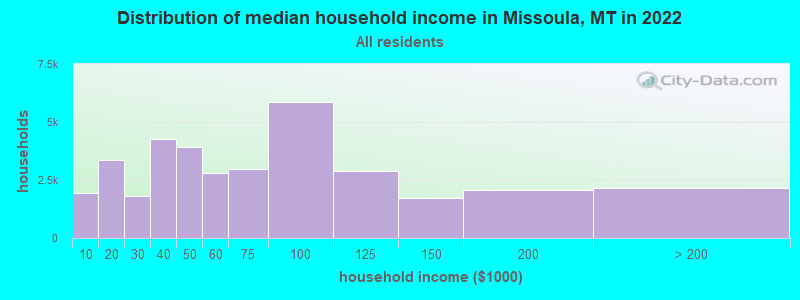
Income statistics for all residents
Median household income in Missoula, MT in 2022:
Missoula:
$59,590
Montana:
$67,631
Change in median household income between 2000 and 2022:
Missoula, Montana:
+96.2%
Montana:
+104.8%
Number of households with income < $10k:
Missoula:
5.4% (1,948)
State:
5.0% (23,231)
Number of households with income $10k - 20k:
Missoula:
9.4% (3,377)
State:
8.1% (37,478)
Number of households with income $20k - 30k:
Missoula:
5.0% (1,806)
Montana:
7.3% (33,880)
Number of households with income $30k - 40k:
Missoula:
12.0% (4,286)
Montana:
8.4% (38,912)
Number of households with income $40k - 50k:
Missoula:
11.0% (3,942)
State:
8.3% (38,441)
Number of households with income $50k - 60k:
Missoula:
7.8% (2,786)
State:
7.4% (34,172)
Number of households with income $60k - 75k:
Missoula:
8.3% (2,972)
State:
10.5% (48,783)
Number of households with income $75k - 100k:
Missoula:
16.3% (5,856)
State:
15.0% (69,571)
Number of households with income $100k - 125k:
Missoula:
8.1% (2,906)
Montana:
9.9% (45,889)
Number of households with income $125k - 150k:
Missoula:
4.8% (1,735)
State:
6.1% (28,538)
Number of households with income $150k - 200k:
Missoula:
5.7% (2,056)
State:
6.6% (30,552)
Number of households with income > $200k:
Missoula:
6.1% (2,170)
Montana:
7.5% (34,625)
Aggregate household income in Missoula in 2022: $3,012,932,000
Median family income in Missoula in 2022:
Missoula:
$83,866
State:
$83,580
Number of families with income < $10k:
Missoula:
1.1% (176)
State:
2.6% (7,229)
Number of families with income $10k - 20k:
Missoula:
2.3% (359)
Montana:
3.4% (9,550)
Number of families with income $20k - 30k:
Missoula:
2.7% (429)
State:
4.8% (13,650)
Number of families with income $30k - 40k:
Missoula:
8.9% (1,398)
State:
6.5% (18,237)
Number of families with income $40k - 50k:
Missoula:
4.1% (653)
State:
6.8% (19,174)
Number of families with income $50k - 60k:
Missoula:
11.3% (1,781)
State:
7.4% (20,843)
Number of families with income $60k - 75k:
Missoula:
10.5% (1,655)
State:
11.6% (32,619)
Number of families with income $75k - 100k:
Missoula:
18.2% (2,878)
Montana:
17.1% (48,328)
Number of families with income $100k - 125k:
Missoula:
13.0% (2,058)
State:
12.8% (36,048)
Number of families with income $125k - 150k:
Missoula:
7.2% (1,130)
State:
8.3% (23,444)
Number of families with income $150k - 200k:
Missoula:
10.7% (1,689)
State:
9.3% (26,290)
Number of families with income > $200k:
Missoula:
10.0% (1,583)
State:
9.5% (26,804)
Median non-family income in Missoula in 2022:
Missoula:
$42,833
Montana:
$40,582
Change in median non-family income between 2000 and 2022:
Missoula, Montana:
+120.2%
State:
+108.3%
Median per capita income in Missoula in 2022:
Missoula:
$40,557
State:
$38,329
Change in median per capita income between 2000 and 2022:
Missoula, Montana:
+136.3%
State:
+123.5%
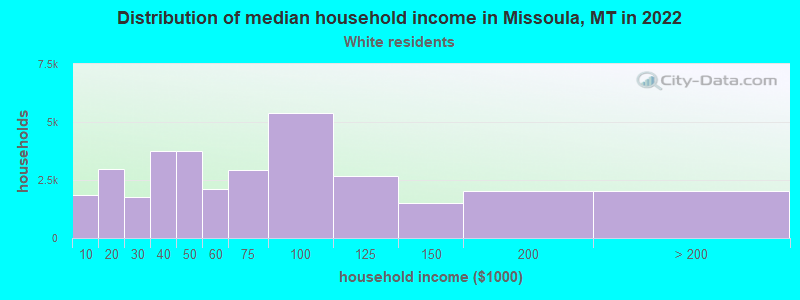
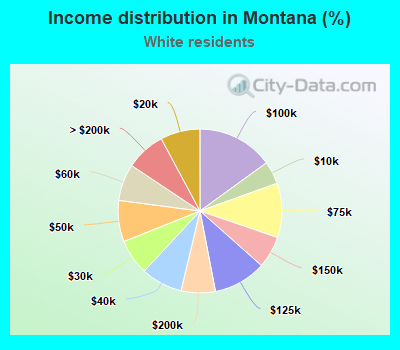
Income statistics for White residents
Median household income in Missoula, MT in 2022:
Missoula:
$62,096
Montana:
$69,744
Change in median household income between 2000 and 2022:
Missoula, Montana:
+100.3%
State:
+106.5%
Number of households with income < $10k:
Missoula:
5.6% (1,843)
State:
4.5% (18,406)
Number of households with income $10k - 20k:
Missoula:
9.1% (2,990)
State:
7.8% (32,061)
Number of households with income $20k - 30k:
Missoula:
5.3% (1,749)
Montana:
7.0% (28,825)
Number of households with income $30k - 40k:
Missoula:
11.5% (3,745)
State:
8.2% (33,552)
Number of households with income $40k - 50k:
Missoula:
11.5% (3,756)
State:
8.2% (33,446)
Number of households with income $50k - 60k:
Missoula:
6.4% (2,097)
Montana:
7.3% (29,753)
Number of households with income $60k - 75k:
Missoula:
8.9% (2,925)
State:
10.7% (44,051)
Number of households with income $75k - 100k:
Missoula:
16.4% (5,368)
State:
15.0% (61,580)
Number of households with income $100k - 125k:
Missoula:
8.1% (2,660)
State:
10.4% (42,636)
Number of households with income $125k - 150k:
Missoula:
4.6% (1,506)
State:
6.3% (25,938)
Number of households with income $150k - 200k:
Missoula:
6.2% (2,019)
Montana:
6.8% (27,704)
Number of households with income > $200k:
Missoula:
6.3% (2,044)
State:
7.8% (32,101)
Aggregate household income in Missoula in 2022: $2,797,369,300
Median family income in Missoula in 2022:
Missoula:
$87,249
Montana:
$86,163
Number of families with income < $10k:
Missoula:
0.8% (109)
State:
2.0% (4,963)
Number of families with income $10k - 20k:
Missoula:
1.0% (139)
State:
2.8% (7,063)
Number of families with income $20k - 30k:
Missoula:
3.1% (429)
Montana:
4.5% (11,218)
Number of families with income $30k - 40k:
Missoula:
7.3% (997)
State:
6.0% (14,834)
Number of families with income $40k - 50k:
Missoula:
4.3% (585)
Montana:
6.8% (16,997)
Number of families with income $50k - 60k:
Missoula:
10.1% (1,390)
State:
7.3% (18,007)
Number of families with income $60k - 75k:
Missoula:
11.7% (1,608)
Montana:
11.6% (28,681)
Number of families with income $75k - 100k:
Missoula:
17.7% (2,427)
State:
17.2% (42,622)
Number of families with income $100k - 125k:
Missoula:
14.4% (1,973)
Montana:
13.5% (33,620)
Number of families with income $125k - 150k:
Missoula:
6.6% (901)
State:
8.7% (21,654)
Number of families with income $150k - 200k:
Missoula:
12.3% (1,689)
State:
9.6% (23,873)
Number of families with income > $200k:
Missoula:
10.6% (1,457)
State:
10.0% (24,758)
Median non-family income in Missoula in 2022:
Missoula:
$43,167
State:
$41,403
Change in median non-family income between 2000 and 2022:
Missoula, Montana:
+118.9%
Montana:
+109.4%
Median per capita income in Missoula in 2022:
Missoula:
$40,899
State:
$40,453
Change in median per capita income between 2000 and 2022:
Missoula, Montana:
+130.9%
Montana:
+125.6%
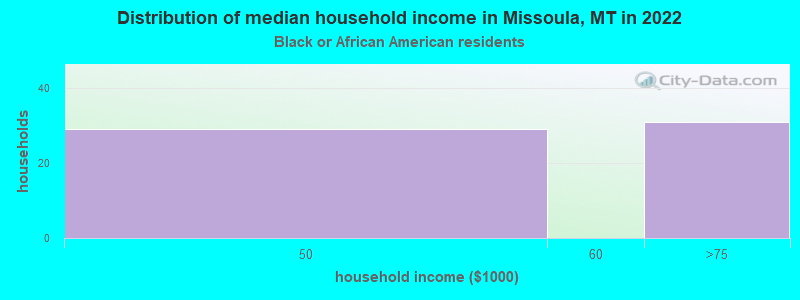
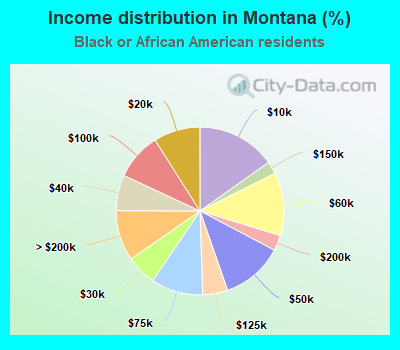
Income statistics for Black or African American residents
Number of households with income < $10k:
Missoula:
0.0% (0)
State:
15.2% (230)
Number of households with income $10k - 20k:
Missoula:
0.0% (0)
Montana:
9.0% (136)
Number of households with income $20k - 30k:
Missoula:
0.0% (0)
State:
5.9% (89)
Number of households with income $30k - 40k:
Missoula:
0.0% (0)
State:
6.9% (104)
Number of households with income $40k - 50k:
Missoula:
48.3% (29)
State:
12.0% (181)
Number of households with income $50k - 60k:
Missoula:
0.0% (0)
State:
12.2% (184)
Number of households with income $60k - 75k:
Missoula:
51.7% (31)
State:
10.0% (151)
Number of households with income $75k - 100k:
Missoula:
0.0% (0)
State:
9.1% (137)
Number of households with income $100k - 125k:
Missoula:
0.0% (0)
State:
4.8% (73)
Number of households with income $125k - 150k:
Missoula:
0.0% (0)
Montana:
2.4% (36)
Number of households with income $150k - 200k:
Missoula:
0.0% (0)
State:
3.0% (45)
Number of households with income > $200k:
Missoula:
0.0% (0)
State:
9.7% (147)
Aggregate household income in Missoula in 2022: $4,663,436
Median per capita income in Missoula in 2022:
Missoula:
$37,051
State:
$55,327
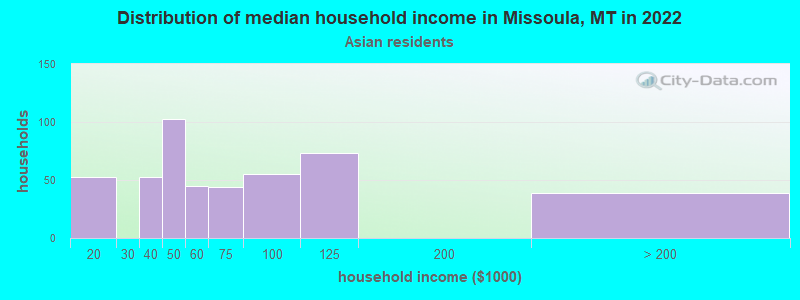
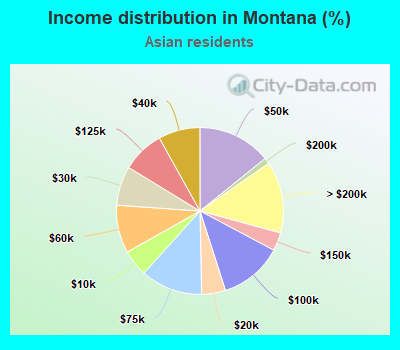
Income statistics for Asian residents
Median household income in Missoula, MT in 2022:
Missoula:
$83,101
State:
$56,041
Number of households with income < $10k:
Missoula:
0.0% (0)
State:
5.1% (160)
Number of households with income $10k - 20k:
Missoula:
11.4% (53)
Montana:
4.6% (144)
Number of households with income $20k - 30k:
Missoula:
0.0% (0)
State:
7.6% (237)
Number of households with income $30k - 40k:
Missoula:
11.4% (53)
State:
8.1% (251)
Number of households with income $40k - 50k:
Missoula:
22.2% (103)
State:
14.2% (442)
Number of households with income $50k - 60k:
Missoula:
9.7% (45)
Montana:
9.3% (289)
Number of households with income $60k - 75k:
Missoula:
9.5% (44)
Montana:
12.0% (373)
Number of households with income $75k - 100k:
Missoula:
11.8% (55)
State:
12.3% (382)
Number of households with income $100k - 125k:
Missoula:
15.7% (73)
State:
8.2% (255)
Number of households with income $125k - 150k:
Missoula:
0.0% (0)
Montana:
3.5% (110)
Number of households with income $150k - 200k:
Missoula:
0.0% (0)
Montana:
1.1% (35)
Number of households with income > $200k:
Missoula:
8.4% (39)
Montana:
13.9% (433)
Aggregate household income in Missoula in 2022: $37,732,569
Median family income in Missoula in 2022:
Missoula:
$115,527
State:
$83,670
Number of families with income $20k - 30k:
Missoula:
10.1% (16)
Montana:
9.9% (155)
Number of families with income $50k - 60k:
Missoula:
3.3% (5)
State:
7.4% (116)
Number of families with income $60k - 75k:
Missoula:
15.8% (25)
State:
12.3% (194)
Number of families with income $75k - 100k:
Missoula:
6.8% (11)
State:
15.0% (236)
Number of families with income $100k - 125k:
Missoula:
39.4% (62)
State:
11.1% (175)
Number of families with income > $200k:
Missoula:
24.6% (39)
Montana:
26.8% (421)
Median per capita income in Missoula in 2022:
Missoula:
$41,809
State:
$44,327
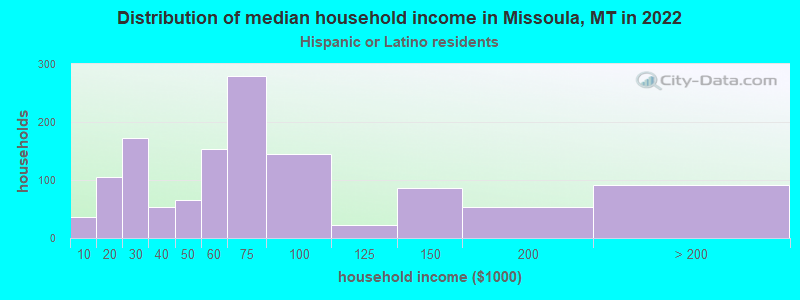
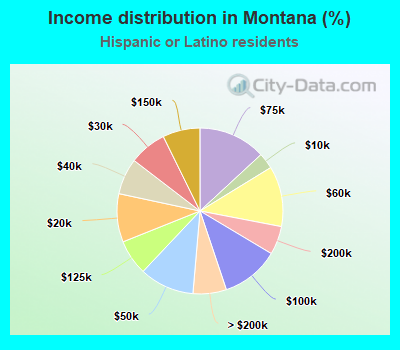
Income statistics for Hispanic or Latino residents
Median household income in Missoula, MT in 2022:
Missoula:
$54,204
State:
$60,797
Number of households with income < $10k:
Missoula:
2.8% (36)
Montana:
3.1% (455)
Number of households with income $10k - 20k:
Missoula:
8.4% (106)
State:
9.4% (1,375)
Number of households with income $20k - 30k:
Missoula:
13.6% (172)
Montana:
7.3% (1,066)
Number of households with income $30k - 40k:
Missoula:
4.2% (53)
State:
7.1% (1,032)
Number of households with income $40k - 50k:
Missoula:
5.2% (66)
Montana:
10.7% (1,557)
Number of households with income $50k - 60k:
Missoula:
12.2% (154)
Montana:
11.8% (1,722)
Number of households with income $60k - 75k:
Missoula:
22.1% (280)
State:
13.1% (1,918)
Number of households with income $75k - 100k:
Missoula:
11.4% (144)
Montana:
11.3% (1,648)
Number of households with income $100k - 125k:
Missoula:
1.7% (22)
State:
6.9% (1,011)
Number of households with income $125k - 150k:
Missoula:
6.8% (86)
State:
7.3% (1,064)
Number of households with income $150k - 200k:
Missoula:
4.3% (54)
State:
5.6% (812)
Number of households with income > $200k:
Missoula:
7.3% (92)
Montana:
6.5% (951)
Aggregate household income in Missoula in 2022: $70,170,100
Median family income in Missoula in 2022:
Missoula:
$55,474
State:
$66,328
Number of families with income < $10k:
Missoula:
4.2% (29)
State:
4.6% (464)
Number of families with income $10k - 20k:
Missoula:
7.8% (53)
Montana:
6.8% (696)
Number of families with income $30k - 40k:
Missoula:
2.5% (17)
State:
2.8% (285)
Number of families with income $40k - 50k:
Missoula:
3.4% (23)
Montana:
7.6% (777)
Number of families with income $50k - 60k:
Missoula:
10.2% (69)
State:
12.5% (1,269)
Number of families with income $60k - 75k:
Missoula:
40.8% (276)
State:
16.3% (1,654)
Number of families with income $75k - 100k:
Missoula:
7.7% (52)
State:
9.2% (938)
Number of families with income $125k - 150k:
Missoula:
12.2% (83)
State:
8.3% (842)
Number of families with income > $200k:
Missoula:
11.3% (76)
State:
6.9% (698)
Median non-family income in Missoula in 2022:
Missoula:
$40,761
Montana:
$37,718
Change in median non-family income between 2000 and 2022:
Missoula, Montana:
+120.8%
Montana:
+90.0%
Median per capita income in Missoula in 2022:
Missoula:
$22,491
State:
$23,068
Change in median per capita income between 2000 and 2022:
Missoula, Montana:
+101.0%
Montana:
+122.4%
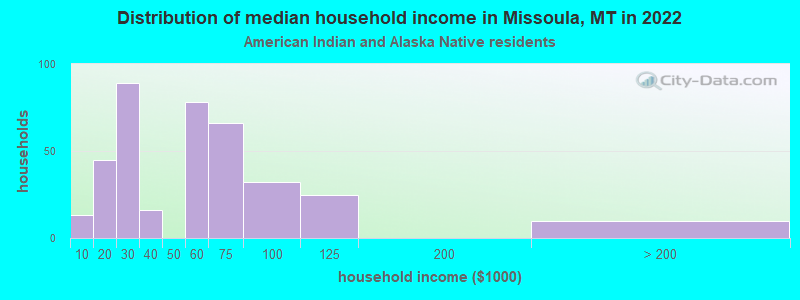
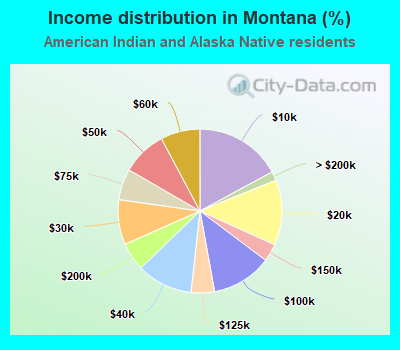
Income statistics for American Indian and Alaska Native residents
Median household income in Missoula, MT in 2022:
Missoula:
$58,045
Montana:
$40,063
Number of households with income < $10k:
Missoula:
3.5% (13)
State:
17.1% (3,122)
Number of households with income $10k - 20k:
Missoula:
12.0% (45)
State:
12.9% (2,355)
Number of households with income $20k - 30k:
Missoula:
23.8% (89)
State:
8.9% (1,620)
Number of households with income $30k - 40k:
Missoula:
4.3% (16)
State:
11.0% (2,013)
Number of households with income $40k - 50k:
Missoula:
0.0% (0)
Montana:
8.8% (1,615)
Number of households with income $50k - 60k:
Missoula:
20.9% (78)
Montana:
7.8% (1,423)
Number of households with income $60k - 75k:
Missoula:
17.6% (66)
State:
6.1% (1,117)
Number of households with income $75k - 100k:
Missoula:
8.6% (32)
State:
11.9% (2,169)
Number of households with income $100k - 125k:
Missoula:
6.7% (25)
Montana:
4.6% (845)
Number of households with income $125k - 150k:
Missoula:
0.0% (0)
Montana:
3.5% (637)
Number of households with income $150k - 200k:
Missoula:
0.0% (0)
State:
5.6% (1,015)
Number of households with income > $200k:
Missoula:
2.7% (10)
State:
1.8% (324)
Aggregate household income in Missoula in 2022: $24,841,900
Median per capita income in Missoula in 2022:
Missoula:
$16,966
State:
$19,038
Change in median per capita income between 2000 and 2022:
Missoula, Montana:
+115.0%
Montana:
+114.7%
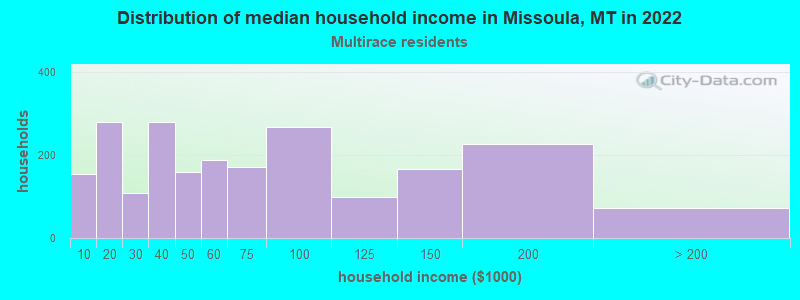
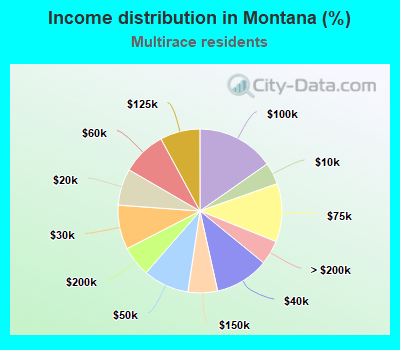
Income statistics for Multirace residents
Median household income in Missoula, MT in 2022:
Missoula:
$48,538
State:
$61,907
Number of households with income < $10k:
Missoula:
7.1% (155)
State:
4.3% (1,142)
Number of households with income $10k - 20k:
Missoula:
12.9% (280)
State:
7.2% (1,913)
Number of households with income $20k - 30k:
Missoula:
5.0% (108)
Montana:
8.7% (2,315)
Number of households with income $30k - 40k:
Missoula:
12.9% (280)
Montana:
10.7% (2,822)
Number of households with income $40k - 50k:
Missoula:
7.4% (160)
State:
9.0% (2,396)
Number of households with income $50k - 60k:
Missoula:
8.6% (188)
Montana:
8.7% (2,311)
Number of households with income $60k - 75k:
Missoula:
7.9% (171)
State:
11.5% (3,043)
Number of households with income $75k - 100k:
Missoula:
12.3% (268)
Montana:
15.3% (4,050)
Number of households with income $100k - 125k:
Missoula:
4.5% (98)
State:
7.9% (2,089)
Number of households with income $125k - 150k:
Missoula:
7.6% (166)
State:
5.8% (1,541)
Number of households with income $150k - 200k:
Missoula:
10.5% (228)
Montana:
6.0% (1,587)
Number of households with income > $200k:
Missoula:
3.3% (72)
State:
4.8% (1,271)
Aggregate household income in Missoula in 2022: $135,820,200
Median family income in Missoula in 2022:
Missoula:
$72,819
Montana:
$70,768
Number of families with income < $10k:
Missoula:
2.7% (38)
State:
5.6% (993)
Number of families with income $10k - 20k:
Missoula:
7.7% (111)
State:
4.5% (794)
Number of families with income $20k - 30k:
Missoula:
10.0% (143)
Montana:
7.0% (1,234)
Number of families with income $30k - 40k:
Missoula:
6.0% (86)
Montana:
7.0% (1,237)
Number of families with income $40k - 50k:
Missoula:
7.8% (112)
State:
6.0% (1,060)
Number of families with income $50k - 60k:
Missoula:
7.9% (113)
State:
8.3% (1,468)
Number of families with income $60k - 75k:
Missoula:
8.7% (124)
Montana:
15.1% (2,661)
Number of families with income $75k - 100k:
Missoula:
14.3% (205)
Montana:
16.4% (2,885)
Number of families with income $100k - 125k:
Missoula:
2.3% (32)
State:
9.0% (1,576)
Number of families with income $125k - 150k:
Missoula:
12.8% (184)
State:
7.2% (1,260)
Number of families with income $150k - 200k:
Missoula:
15.9% (228)
State:
8.1% (1,428)
Number of families with income > $200k:
Missoula:
3.9% (56)
State:
5.7% (1,003)
Median non-family income in Missoula in 2022:
Missoula:
$39,087
State:
$41,006
Change in median non-family income between 2000 and 2022:
Missoula, Montana:
+128.2%
State:
+165.4%
Median per capita income in Missoula in 2022:
Missoula:
$44,145
State:
$29,391
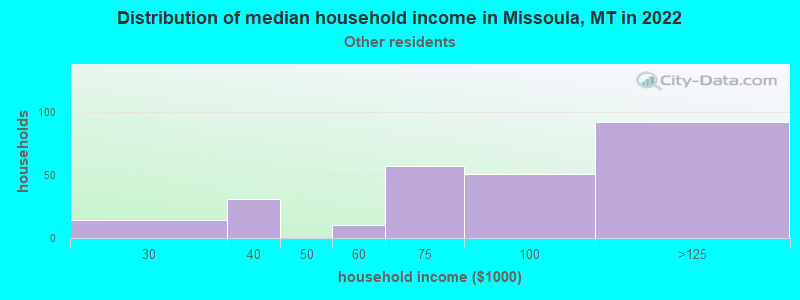
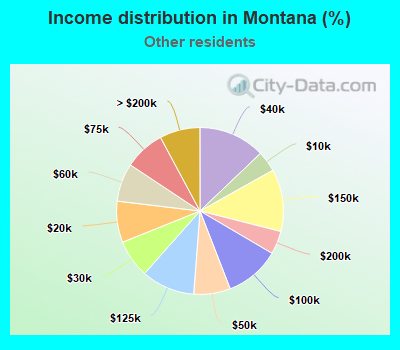
Income statistics for other residents
Number of households with income < $10k:
Missoula:
0.0% (0)
State:
4.0% (142)
Number of households with income $10k - 20k:
Missoula:
0.0% (0)
Montana:
8.0% (282)
Number of households with income $20k - 30k:
Missoula:
5.5% (14)
State:
7.4% (260)
Number of households with income $30k - 40k:
Missoula:
12.2% (31)
State:
12.9% (455)
Number of households with income $40k - 50k:
Missoula:
0.0% (0)
State:
7.1% (251)
Number of households with income $50k - 60k:
Missoula:
3.9% (10)
State:
7.4% (262)
Number of households with income $60k - 75k:
Missoula:
22.4% (57)
State:
7.8% (277)
Number of households with income $75k - 100k:
Missoula:
20.0% (51)
State:
10.6% (376)
Number of households with income $100k - 125k:
Missoula:
36.1% (92)
Montana:
10.3% (365)
Number of households with income $125k - 150k:
Missoula:
0.0% (0)
Montana:
12.1% (426)
Number of households with income $150k - 200k:
Missoula:
0.0% (0)
State:
4.5% (159)
Number of households with income > $200k:
Missoula:
0.0% (0)
State:
7.8% (277)
Aggregate household income in Missoula in 2022: $9,331,536
Median per capita income in Missoula in 2022:
Missoula:
$28,437
State:
$23,968
Change in median per capita income between 2000 and 2022:
Missoula, Montana:
+147.7%
Montana:
+114.9%
Discuss Missoula, Montana (MT) on our hugely popular Montana forum.