Milford, Texas (TX) income map, earnings map, and wages data

Data:
The per capita income in 2022 was $23,453, which means an increase of 39.3% compared to 2000 when it was $14,241.
Whole page based on the data from 2000 / 2022 when the population of Milford, Texas was 685 / 1,120
Income statistics for all residents
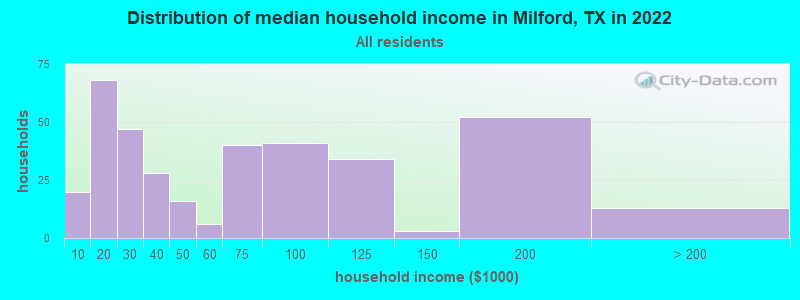
Number of households with income < $10k:| Milford: | 5.4% (20) |
| State: | 5.5% (611,011) |
Number of households with income $10k - 20k:| Milford: | 18.5% (68) |
| State: | 6.7% (743,157) |
Number of households with income $20k - 30k:| Milford: | 12.8% (47) |
| State: | 7.2% (803,381) |
Number of households with income $30k - 40k:| Milford: | 7.6% (28) |
| State: | 7.8% (866,080) |
Number of households with income $40k - 50k:| Milford: | 4.3% (16) |
| State: | 7.3% (810,440) |
Number of households with income $50k - 60k:| Milford: | 1.6% (6) |
| State: | 7.2% (799,783) |
Number of households with income $60k - 75k:| Milford: | 10.9% (40) |
| State: | 9.9% (1,095,384) |
Number of households with income $75k - 100k:| Milford: | 11.1% (41) |
| State: | 12.8% (1,419,057) |
Number of households with income $100k - 125k:| Milford: | 9.2% (34) |
| State: | 9.5% (1,054,577) |
Number of households with income $125k - 150k:| Milford: | 0.8% (3) |
| State: | 6.7% (741,518) |
Number of households with income $150k - 200k:| Milford: | 14.1% (52) |
| State: | 8.7% (961,776) |
Number of households with income > $200k:| Milford: | 3.5% (13) |
| Texas: | 10.7% (1,181,544) |
Aggregate household income in Milford in 2022: $24,711,606
Median family income in Milford in 2022:| Milford: | $68,753 |
| Texas: | $86,267 |
Number of families with income < $10k:| Milford: | 9.0% (23) |
| Texas: | 4.0% (297,884) |
Number of families with income $10k - 20k:| Milford: | 2.3% (6) |
| State: | 4.3% (324,514) |
Number of families with income $20k - 30k:| Milford: | 15.2% (39) |
| State: | 5.8% (430,949) |
Number of families with income $30k - 40k:| Milford: | 6.1% (16) |
| State: | 6.6% (493,535) |
Number of families with income $40k - 50k:| Milford: | 5.1% (13) |
| State: | 6.7% (499,663) |
Number of families with income $50k - 60k:| Milford: | 2.3% (6) |
| State: | 6.6% (492,203) |
Number of families with income $60k - 75k:| Milford: | 15.4% (40) |
| State: | 9.5% (710,229) |
Number of families with income $75k - 100k:| Milford: | 12.6% (33) |
| Texas: | 13.6% (1,015,480) |
Number of families with income $100k - 125k:| Milford: | 12.3% (32) |
| Texas: | 10.7% (797,961) |
Number of families with income $150k - 200k:| Milford: | 14.7% (38) |
| State: | 10.7% (804,459) |
Number of families with income > $200k:| Milford: | 4.9% (13) |
| Texas: | 13.5% (1,013,514) |
Median non-family income in Milford in 2022:| Milford: | $16,935 |
| State: | $45,999 |
Change in median non-family income between 2000 and 2022:| Milford, Texas: | +56.0% |
| Texas: | +79.5% |
Median per capita income in Milford in 2022:| Milford: | $23,454 |
| State: | $38,123 |
Change in median per capita income between 2000 and 2022:| Milford, Texas: | +64.7% |
| Texas: | +94.3% |
Income statistics for White residents
Median household income in Milford, TX in 2022:| Milford: | $63,235 |
| State: | $82,032 |
Change in median household income between 2000 and 2022:| Milford, Texas: | +77.5% |
| State: | +91.0% |
Number of households with income < $10k:| Milford: | 5.9% (13) |
| State: | 4.7% (273,716) |
Number of households with income $10k - 20k:| Milford: | 3.7% (8) |
| State: | 5.5% (322,702) |
Number of households with income $20k - 30k:| Milford: | 17.8% (39) |
| Texas: | 6.2% (363,947) |
Number of households with income $30k - 40k:| Milford: | 11.4% (25) |
| State: | 6.8% (399,275) |
Number of households with income $40k - 50k:| Milford: | 5.0% (11) |
| State: | 6.5% (383,417) |
Number of households with income $50k - 60k:| Milford: | 0.0% (0) |
| State: | 6.6% (388,535) |
Number of households with income $60k - 75k:| Milford: | 12.8% (28) |
| State: | 9.7% (566,295) |
Number of households with income $75k - 100k:| Milford: | 6.4% (14) |
| State: | 13.0% (760,276) |
Number of households with income $100k - 125k:| Milford: | 12.8% (28) |
| State: | 10.2% (597,596) |
Number of households with income $125k - 150k:| Milford: | 0.9% (2) |
| State: | 7.4% (436,830) |
Number of households with income $150k - 200k:| Milford: | 19.2% (42) |
| State: | 9.9% (583,067) |
Number of households with income > $200k:| Milford: | 4.1% (9) |
| State: | 13.5% (792,647) |
Aggregate household income in Milford in 2022: $16,651,190
Median family income in Milford in 2022:| Milford: | $60,929 |
| Texas: | $101,788 |
Number of families with income < $10k:| Milford: | 14.3% (25) |
| State: | 2.8% (108,142) |
Number of families with income $10k - 20k:| Milford: | 3.9% (7) |
| Texas: | 2.9% (113,421) |
Number of families with income $20k - 30k:| Milford: | 15.5% (27) |
| State: | 4.1% (157,688) |
Number of families with income $30k - 40k:| Milford: | 6.9% (12) |
| State: | 5.2% (198,847) |
Number of families with income $40k - 50k:| Milford: | 4.1% (7) |
| State: | 5.6% (216,490) |
Number of families with income $60k - 75k:| Milford: | 14.7% (26) |
| Texas: | 9.0% (346,106) |
Number of families with income $75k - 100k:| Milford: | 3.7% (6) |
| State: | 13.7% (527,363) |
Number of families with income $100k - 125k:| Milford: | 15.4% (27) |
| Texas: | 11.6% (448,411) |
Number of families with income $150k - 200k:| Milford: | 16.7% (29) |
| Texas: | 12.5% (480,185) |
Number of families with income > $200k:| Milford: | 5.0% (9) |
| State: | 17.6% (677,490) |
Median per capita income in Milford in 2022:| Milford: | $26,632 |
| Texas: | $47,740 |
Change in median per capita income between 2000 and 2022:| Milford, Texas: | +63.5% |
| Texas: | +114.3% |
Income statistics for Black or African American residents
Number of households with income < $10k:| Milford: | 3.2% (4) |
| State: | 8.9% (126,378) |
Number of households with income $10k - 20k:| Milford: | 46.0% (58) |
| State: | 9.9% (140,369) |
Number of households with income $20k - 30k:| Milford: | 5.6% (7) |
| State: | 8.5% (120,639) |
Number of households with income $30k - 40k:| Milford: | 0.0% (0) |
| Texas: | 9.7% (137,517) |
Number of households with income $40k - 50k:| Milford: | 1.6% (2) |
| Texas: | 8.0% (112,973) |
Number of households with income $50k - 60k:| Milford: | 0.0% (0) |
| State: | 8.3% (117,156) |
Number of households with income $60k - 75k:| Milford: | 7.9% (10) |
| State: | 10.4% (147,462) |
Number of households with income $75k - 100k:| Milford: | 35.7% (45) |
| State: | 11.5% (162,718) |
Number of households with income $100k - 125k:| Milford: | 0.0% (0) |
| Texas: | 8.2% (115,829) |
Number of households with income $125k - 150k:| Milford: | 0.0% (0) |
| Texas: | 4.9% (69,556) |
Number of households with income $150k - 200k:| Milford: | 0.0% (0) |
| State: | 6.4% (90,701) |
Number of households with income > $200k:| Milford: | 0.0% (0) |
| Texas: | 5.5% (77,988) |
Aggregate household income in Milford in 2022: $4,524,089
Median family income in Milford in 2022:| Milford: | $79,591 |
| State: | $69,134 |
Number of families with income $20k - 30k:| Milford: | 15.6% (6) |
| Texas: | 7.1% (57,877) |
Number of families with income $40k - 50k:| Milford: | 8.8% (3) |
| State: | 7.1% (57,907) |
Number of families with income $60k - 75k:| Milford: | 23.5% (9) |
| Texas: | 10.1% (81,994) |
Number of families with income $75k - 100k:| Milford: | 52.1% (21) |
| Texas: | 12.7% (103,723) |
Median non-family income in Milford in 2022:| Milford: | $13,155 |
| State: | $40,133 |
Change in median non-family income between 2000 and 2022:| Milford, Texas: | +66.2% |
| State: | +102.2% |
Median per capita income in Milford in 2022:| Milford: | $16,176 |
| State: | $30,490 |
Change in median per capita income between 2000 and 2022:| Milford, Texas: | +68.7% |
| Texas: | +113.9% |
Income statistics for Hispanic or Latino residents
Median household income in Milford, TX in 2022:| Milford: | $113,878 |
| State: | $60,504 |
Number of households with income < $10k:| Milford: | 0.0% (0) |
| State: | 5.8% (213,953) |
Number of households with income $10k - 20k:| Milford: | 0.0% (0) |
| State: | 8.0% (297,456) |
Number of households with income $20k - 30k:| Milford: | 0.0% (0) |
| State: | 9.2% (340,166) |
Number of households with income $30k - 40k:| Milford: | 0.0% (0) |
| State: | 9.5% (354,336) |
Number of households with income $40k - 50k:| Milford: | 0.0% (0) |
| State: | 8.8% (327,013) |
Number of households with income $50k - 60k:| Milford: | 13.9% (5) |
| Texas: | 8.3% (308,818) |
Number of households with income $60k - 75k:| Milford: | 0.0% (0) |
| State: | 10.9% (405,109) |
Number of households with income $75k - 100k:| Milford: | 5.6% (2) |
| Texas: | 13.8% (511,639) |
Number of households with income $100k - 125k:| Milford: | 30.6% (11) |
| State: | 8.6% (319,728) |
Number of households with income $125k - 150k:| Milford: | 0.0% (0) |
| State: | 5.7% (210,932) |
Number of households with income $150k - 200k:| Milford: | 44.4% (16) |
| Texas: | 6.4% (236,055) |
Number of households with income > $200k:| Milford: | 5.6% (2) |
| Texas: | 5.1% (189,259) |
Aggregate household income in Milford in 2022: $4,176,553
Median per capita income in Milford in 2022:| Milford: | $23,133 |
| Texas: | $24,862 |
Income statistics for Multirace residents
Median household income in Milford, TX in 2022:| Milford: | $155,651 |
| State: | $62,748 |
Number of households with income < $10k:| Milford: | 0.0% (0) |
| State: | 5.5% (122,324) |
Number of households with income $10k - 20k:| Milford: | 0.0% (0) |
| Texas: | 8.2% (182,232) |
Number of households with income $20k - 30k:| Milford: | 0.0% (0) |
| State: | 8.5% (189,456) |
Number of households with income $30k - 40k:| Milford: | 0.0% (0) |
| State: | 8.9% (197,499) |
Number of households with income $40k - 50k:| Milford: | 0.0% (0) |
| State: | 8.7% (191,735) |
Number of households with income $50k - 60k:| Milford: | 0.0% (0) |
| State: | 8.0% (177,535) |
Number of households with income $60k - 75k:| Milford: | 0.0% (0) |
| State: | 10.5% (232,479) |
Number of households with income $75k - 100k:| Milford: | 0.0% (0) |
| Texas: | 13.1% (290,448) |
Number of households with income $100k - 125k:| Milford: | 17.6% (3) |
| State: | 8.6% (191,595) |
Number of households with income $125k - 150k:| Milford: | 0.0% (0) |
| State: | 6.0% (133,361) |
Number of households with income $150k - 200k:| Milford: | 52.9% (9) |
| State: | 7.2% (159,195) |
Number of households with income > $200k:| Milford: | 29.4% (5) |
| Texas: | 6.7% (148,064) |
Aggregate household income in Milford in 2022: $3,045,367
Median family income in Milford in 2022:| Milford: | $140,278 |
| Texas: | $69,780 |
Number of families with income $100k - 125k:| Milford: | 18.8% (3) |
| Texas: | 9.5% (153,597) |
Number of families with income $150k - 200k:| Milford: | 50.5% (9) |
| State: | 8.5% (137,607) |
Number of families with income > $200k:| Milford: | 30.7% (5) |
| State: | 7.9% (127,299) |
Median per capita income in Milford in 2022:| Milford: | $25,383 |
| State: | $26,785 |
Change in median per capita income between 2000 and 2022:| Milford, Texas: | +98.6% |
| State: | +110.9% |
Income statistics for other residents
Median per capita income in Milford in 2022:| Milford: | $14,271 |
| State: | $23,899 |