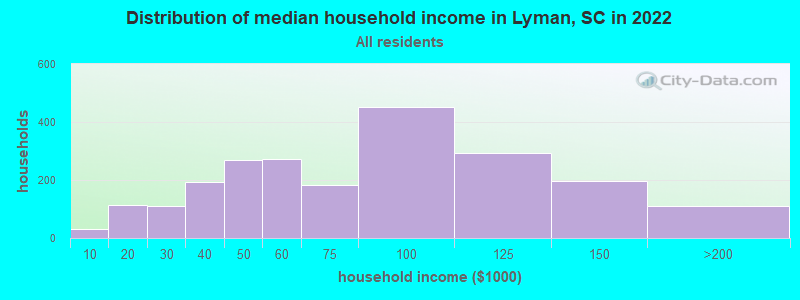
The median household income in Lyman, SC in 2022 was $71,521, which was 10.4% greater than the median annual income of $64,115 across the entire state of South Carolina. Compared to the median income of $38,750 in 2000 this represents an increase of 45.8%. The per capita income in 2022 was $29,541, which means an increase of 34.2% compared to 2000 when it was $19,431.
Whole page based on the data from 2000 / 2022 when the population of Lyman, South Carolina was 2,659 / 6,389
Income statistics for all residents
Median household income in Lyman, SC in 2022:
Lyman:
$71,522
State:
$64,115
Change in median household income between 2000 and 2022:
Lyman, South Carolina:
+84.6%
South Carolina:
+72.9%
Number of households with income < $10k:
Lyman:
1.4% (31)
South Carolina:
6.1% (130,922)
Number of households with income $10k - 20k:
Lyman:
5.1% (114)
State:
7.9% (168,918)
Number of households with income $20k - 30k:
Lyman:
5.0% (111)
South Carolina:
8.0% (171,564)
Number of households with income $30k - 40k:
Lyman:
8.7% (194)
State:
9.2% (195,662)
Number of households with income $40k - 50k:
Lyman:
12.1% (270)
State:
8.2% (176,179)
Number of households with income $50k - 60k:
Lyman:
12.3% (273)
South Carolina:
7.5% (159,159)
Number of households with income $60k - 75k:
Lyman:
8.2% (182)
South Carolina:
9.9% (211,862)
Number of households with income $75k - 100k:
Lyman:
20.3% (451)
State:
13.5% (287,601)
Number of households with income $100k - 125k:
Lyman:
13.1% (292)
State:
9.3% (199,068)
Number of households with income $125k - 150k:
Lyman:
8.8% (196)
State:
6.2% (133,330)
Number of households with income $150k - 200k:
Lyman:
4.7% (105)
South Carolina:
6.6% (141,363)
Number of households with income > $200k:
Lyman:
0.3% (7)
State:
7.5% (160,452)
Aggregate household income in Lyman in 2022: $182,303,594
Median family income in Lyman in 2022:
Lyman:
$78,717
South Carolina:
$79,886
Number of families with income < $10k:
Lyman:
2.0% (34)
State:
3.7% (51,214)
Number of families with income $10k - 20k:
Lyman:
3.2% (53)
State:
4.5% (63,460)
Number of families with income $20k - 30k:
Lyman:
1.5% (26)
State:
5.9% (82,415)
Number of families with income $30k - 40k:
Lyman:
8.4% (141)
State:
7.5% (105,475)
Number of families with income $40k - 50k:
Lyman:
13.2% (222)
State:
7.7% (107,666)
Number of families with income $50k - 60k:
Lyman:
8.0% (134)
State:
7.1% (98,803)
Number of families with income $60k - 75k:
Lyman:
4.1% (69)
South Carolina:
9.9% (138,412)
Number of families with income $75k - 100k:
Lyman:
25.0% (421)
State:
15.4% (214,716)
Number of families with income $100k - 125k:
Lyman:
16.1% (271)
State:
11.4% (159,999)
Number of families with income $125k - 150k:
Lyman:
11.4% (192)
State:
8.0% (112,152)
Number of families with income $150k - 200k:
Lyman:
6.7% (113)
State:
8.8% (123,525)
Number of families with income > $200k:
Lyman:
0.4% (7)
South Carolina:
10.1% (140,575)
Median non-family income in Lyman in 2022:
Lyman:
$43,978
State:
$38,426
Median per capita income in Lyman in 2022:
Lyman:
$29,541
South Carolina:
$36,675
Change in median per capita income between 2000 and 2022:
Lyman, South Carolina:
+52.0%
State:
+95.1%
Income statistics for White residents
Median household income in Lyman, SC in 2022:
Lyman:
$65,356
South Carolina:
$73,516
Change in median household income between 2000 and 2022:
Lyman, South Carolina:
+68.2%
State:
+74.8%
Number of households with income < $10k:
Lyman:
2.4% (39)
State:
4.8% (68,379)
Number of households with income $10k - 20k:
Lyman:
6.3% (101)
South Carolina:
5.9% (85,105)
Number of households with income $20k - 30k:
Lyman:
6.1% (98)
State:
7.1% (101,178)
Number of households with income $30k - 40k:
Lyman:
5.7% (91)
State:
8.0% (114,877)
Number of households with income $40k - 50k:
Lyman:
14.6% (232)
South Carolina:
7.9% (112,749)
Number of households with income $50k - 60k:
Lyman:
12.1% (193)
South Carolina:
7.1% (101,835)
Number of households with income $60k - 75k:
Lyman:
10.9% (174)
State:
10.2% (145,879)
Number of households with income $75k - 100k:
Lyman:
13.6% (217)
State:
14.0% (200,068)
Number of households with income $100k - 125k:
Lyman:
17.4% (277)
South Carolina:
10.4% (148,542)
Number of households with income $125k - 150k:
Lyman:
4.6% (73)
South Carolina:
7.3% (105,118)
Number of households with income $150k - 200k:
Lyman:
5.8% (92)
State:
8.0% (114,506)
Number of households with income > $200k:
Lyman:
0.4% (7)
State:
9.3% (133,550)
Aggregate household income in Lyman in 2022: $125,795,299
Median family income in Lyman in 2022:
Lyman:
$78,683
State:
$90,709
Number of families with income < $10k:
Lyman:
3.7% (41)
South Carolina:
2.4% (22,376)
Number of families with income $10k - 20k:
Lyman:
2.5% (28)
State:
3.0% (28,325)
Number of families with income $20k - 30k:
Lyman:
1.6% (17)
State:
4.4% (42,131)
Number of families with income $30k - 40k:
Lyman:
6.9% (76)
South Carolina:
6.1% (57,510)
Number of families with income $40k - 50k:
Lyman:
12.4% (136)
State:
7.0% (66,712)
Number of families with income $50k - 60k:
Lyman:
10.5% (116)
State:
6.6% (62,489)
Number of families with income $60k - 75k:
Lyman:
6.3% (69)
State:
10.0% (94,724)
Number of families with income $75k - 100k:
Lyman:
16.8% (185)
State:
15.5% (147,207)
Number of families with income $100k - 125k:
Lyman:
23.1% (255)
South Carolina:
12.5% (118,160)
Number of families with income $125k - 150k:
Lyman:
6.5% (72)
South Carolina:
9.5% (90,395)
Number of families with income $150k - 200k:
Lyman:
9.0% (99)
State:
10.6% (100,043)
Number of families with income > $200k:
Lyman:
0.6% (7)
State:
12.4% (117,500)
Median non-family income in Lyman in 2022:
Lyman:
$44,724
State:
$42,596
Change in median non-family income between 2000 and 2022:
Lyman, South Carolina:
+147.9%
State:
+74.9%
Median per capita income in Lyman in 2022:
Lyman:
$33,222
South Carolina:
$42,728
Change in median per capita income between 2000 and 2022:
Lyman, South Carolina:
+68.4%
South Carolina:
+93.4%
Income statistics for Black or African American residents
Median household income in Lyman, SC in 2022:
Lyman:
$93,265
State:
$44,187
Number of households with income < $10k:
Lyman:
0.0% (0)
South Carolina:
10.0% (52,303)
Number of households with income $10k - 20k:
Lyman:
9.4% (26)
State:
13.4% (69,913)
Number of households with income $20k - 30k:
Lyman:
0.0% (0)
South Carolina:
10.4% (54,216)
Number of households with income $30k - 40k:
Lyman:
0.0% (0)
South Carolina:
12.0% (62,722)
Number of households with income $40k - 50k:
Lyman:
0.0% (0)
State:
9.2% (47,773)
Number of households with income $50k - 60k:
Lyman:
8.0% (22)
South Carolina:
8.3% (43,083)
Number of households with income $60k - 75k:
Lyman:
0.0% (0)
South Carolina:
9.3% (48,640)
Number of households with income $75k - 100k:
Lyman:
52.5% (145)
South Carolina:
12.2% (63,723)
Number of households with income $100k - 125k:
Lyman:
2.2% (6)
South Carolina:
6.4% (33,117)
Number of households with income $125k - 150k:
Lyman:
27.9% (77)
South Carolina:
3.2% (16,465)
Number of households with income $150k - 200k:
Lyman:
0.0% (0)
South Carolina:
3.2% (16,672)
Number of households with income > $200k:
Lyman:
0.0% (0)
State:
2.3% (12,213)
Aggregate household income in Lyman in 2022: $32,124,477
Median family income in Lyman in 2022:
Lyman:
$96,796
State:
$54,267
Number of families with income $10k - 20k:
Lyman:
8.2% (22)
State:
8.5% (27,789)
Number of families with income $50k - 60k:
Lyman:
7.2% (19)
State:
8.7% (28,419)
Number of families with income $75k - 100k:
Lyman:
61.0% (165)
State:
15.2% (49,441)
Number of families with income $100k - 125k:
Lyman:
2.3% (6)
State:
8.6% (27,974)
Number of families with income $125k - 150k:
Lyman:
21.3% (58)
State:
3.9% (12,743)
Median per capita income in Lyman in 2022:
Lyman:
$30,595
South Carolina:
$24,863
Change in median per capita income between 2000 and 2022:
Lyman, South Carolina:
+50.5%
State:
+111.1%
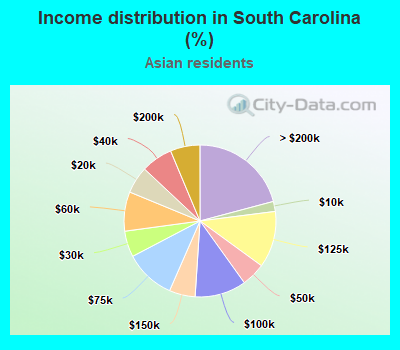
Income statistics for Asian residents
Median household income in Lyman, SC in 2022:
Lyman:
$24,105
State:
$87,807
Number of households with income < $10k:
Lyman:
0.0% (0)
State:
2.1% (676)
Number of households with income $10k - 20k:
Lyman:
0.0% (0)
State:
5.8% (1,818)
Number of households with income $20k - 30k:
Lyman:
0.0% (0)
State:
5.5% (1,750)
Number of households with income $30k - 40k:
Lyman:
82.1% (96)
State:
6.7% (2,113)
Number of households with income $40k - 50k:
Lyman:
17.9% (21)
State:
5.1% (1,605)
Number of households with income $50k - 60k:
Lyman:
0.0% (0)
State:
8.4% (2,643)
Number of households with income $60k - 75k:
Lyman:
0.0% (0)
South Carolina:
10.8% (3,393)
Number of households with income $75k - 100k:
Lyman:
0.0% (0)
State:
10.9% (3,450)
Number of households with income $100k - 125k:
Lyman:
0.0% (0)
State:
12.0% (3,796)
Number of households with income $125k - 150k:
Lyman:
0.0% (0)
South Carolina:
5.5% (1,742)
Number of households with income $150k - 200k:
Lyman:
0.0% (0)
State:
6.3% (1,990)
Number of households with income > $200k:
Lyman:
0.0% (0)
South Carolina:
20.9% (6,581)
Aggregate household income in Lyman in 2022: $4,378,366
Median per capita income in Lyman in 2022:
Lyman:
$11,478
State:
$48,909
Change in median per capita income between 2000 and 2022:
Lyman, South Carolina:
+91.3%
South Carolina:
+138.1%
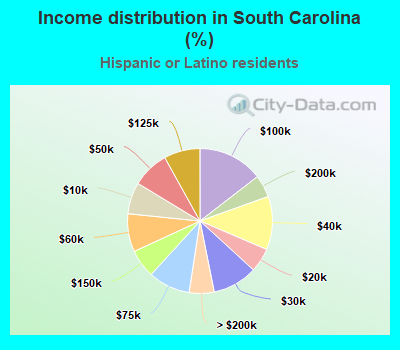
Income statistics for Hispanic or Latino residents
Number of households with income < $10k:
Lyman:
0.0% (0)
State:
7.1% (7,036)
Number of households with income $10k - 20k:
Lyman:
0.0% (0)
State:
5.4% (5,379)
Number of households with income $20k - 30k:
Lyman:
22.4% (22)
State:
10.0% (9,993)
Number of households with income $30k - 40k:
Lyman:
0.0% (0)
South Carolina:
11.9% (11,872)
Number of households with income $40k - 50k:
Lyman:
0.0% (0)
State:
8.3% (8,239)
Number of households with income $50k - 60k:
Lyman:
41.8% (41)
State:
8.5% (8,475)
Number of households with income $60k - 75k:
Lyman:
0.0% (0)
State:
9.4% (9,330)
Number of households with income $75k - 100k:
Lyman:
12.2% (12)
South Carolina:
14.5% (14,491)
Number of households with income $100k - 125k:
Lyman:
23.5% (23)
State:
8.1% (8,026)
Number of households with income $125k - 150k:
Lyman:
0.0% (0)
State:
6.3% (6,313)
Number of households with income $150k - 200k:
Lyman:
0.0% (0)
State:
5.0% (4,963)
Number of households with income > $200k:
Lyman:
0.0% (0)
South Carolina:
5.6% (5,548)
Aggregate household income in Lyman in 2022: $7,246,638
Median per capita income in Lyman in 2022:
Lyman:
$17,568
State:
$23,692
Change in median per capita income between 2000 and 2022:
Lyman, South Carolina:
+16.9%
State:
+95.1%
Income statistics for Multirace residents
Median household income in Lyman, SC in 2022:
Lyman:
$85,290
State:
$61,314
Number of households with income < $10k:
Lyman:
0.0% (0)
South Carolina:
6.9% (6,974)
Number of households with income $10k - 20k:
Lyman:
0.0% (0)
State:
8.0% (8,052)
Number of households with income $20k - 30k:
Lyman:
12.7% (25)
State:
9.9% (9,972)
Number of households with income $30k - 40k:
Lyman:
0.0% (0)
State:
10.0% (10,121)
Number of households with income $40k - 50k:
Lyman:
0.0% (0)
State:
8.1% (8,188)
Number of households with income $50k - 60k:
Lyman:
0.0% (0)
South Carolina:
6.5% (6,530)
Number of households with income $60k - 75k:
Lyman:
0.0% (0)
South Carolina:
8.9% (9,021)
Number of households with income $75k - 100k:
Lyman:
65.0% (128)
South Carolina:
13.4% (13,544)
Number of households with income $100k - 125k:
Lyman:
9.6% (19)
State:
9.8% (9,916)
Number of households with income $125k - 150k:
Lyman:
12.7% (25)
South Carolina:
6.6% (6,657)
Number of households with income $150k - 200k:
Lyman:
0.0% (0)
State:
5.9% (5,979)
Number of households with income > $200k:
Lyman:
0.0% (0)
South Carolina:
6.2% (6,266)
Aggregate household income in Lyman in 2022: $19,924,734
Median family income in Lyman in 2022:
Lyman:
$62,566
South Carolina:
$72,647
Number of families with income $20k - 30k:
Lyman:
11.6% (19)
South Carolina:
8.6% (5,823)
Number of families with income $75k - 100k:
Lyman:
67.7% (112)
State:
15.0% (10,101)
Number of families with income $100k - 125k:
Lyman:
10.9% (18)
South Carolina:
11.6% (7,846)
Number of families with income $125k - 150k:
Lyman:
9.8% (16)
State:
7.0% (4,709)
Median per capita income in Lyman in 2022:
Lyman:
$24,325
South Carolina:
$26,391
Income statistics for other residents
Number of households with income < $10k:
Lyman:
0.0% (0)
State:
4.5% (1,945)
Number of households with income $10k - 20k:
Lyman:
0.0% (0)
South Carolina:
6.9% (2,977)
Number of households with income $20k - 30k:
Lyman:
0.0% (0)
South Carolina:
9.2% (3,988)
Number of households with income $30k - 40k:
Lyman:
0.0% (0)
State:
11.8% (5,124)
Number of households with income $40k - 50k:
Lyman:
0.0% (0)
South Carolina:
12.3% (5,309)
Number of households with income $50k - 60k:
Lyman:
100.0% (40)
State:
9.7% (4,196)
Number of households with income $60k - 75k:
Lyman:
0.0% (0)
State:
10.5% (4,549)
Number of households with income $75k - 100k:
Lyman:
0.0% (0)
South Carolina:
14.1% (6,099)
Number of households with income $100k - 125k:
Lyman:
0.0% (0)
State:
6.3% (2,747)
Number of households with income $125k - 150k:
Lyman:
0.0% (0)
State:
7.0% (3,024)
Number of households with income $150k - 200k:
Lyman:
0.0% (0)
State:
4.6% (1,982)
Number of households with income > $200k:
Lyman:
0.0% (0)
South Carolina:
3.2% (1,365)
Aggregate household income in Lyman in 2022: $7,949,504
Median per capita income in Lyman in 2022:
Lyman:
$20,704
State:
$22,305
Change in median per capita income between 2000 and 2022: