The median household income in Lower Burrell, PA in 2022 was $80,800, which was 11.1% greater than the median annual income of $71,798 across the entire state of Pennsylvania. Compared to the median income of $41,000 in 2000 this represents an increase of 49.3%. The per capita income in 2022 was $44,553, which means an increase of 54.8% compared to 2000 when it was $20,143.
Whole page based on the data from 2000 / 2022 when the population of Lower Burrell, Pennsylvania was 12,608 / 11,623
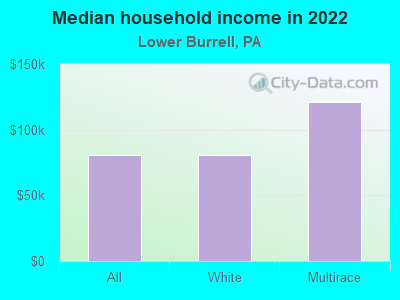
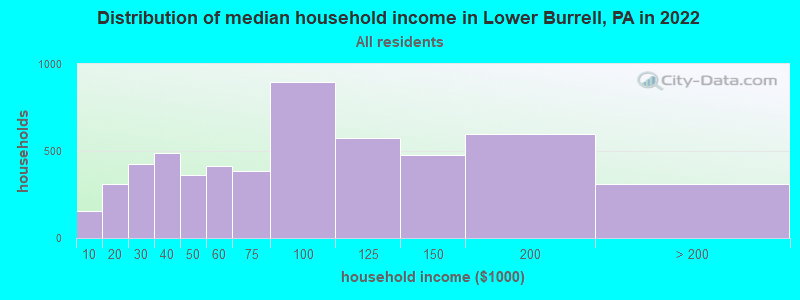
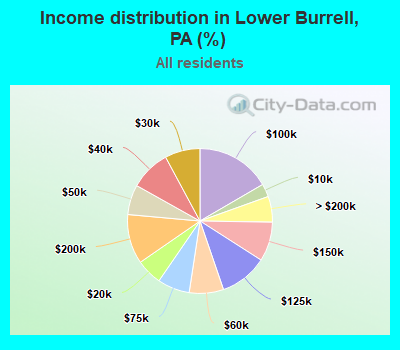
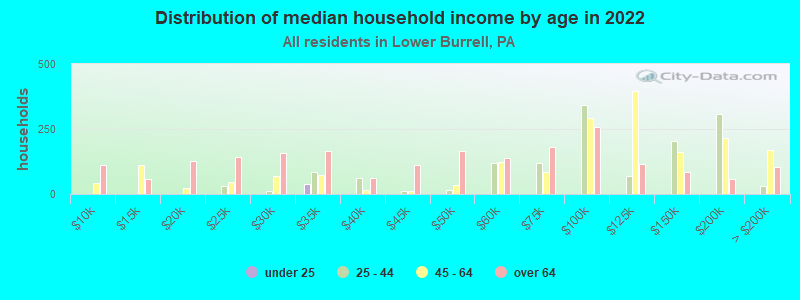
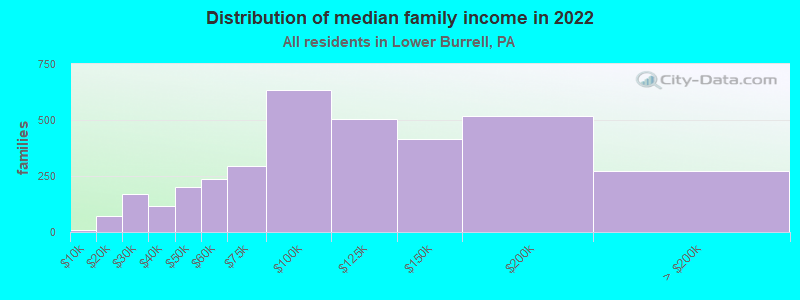
Income statistics for all residents
Median household income in Lower Burrell, PA in 2022:
Lower Burrell:
$80,800
State:
$71,798
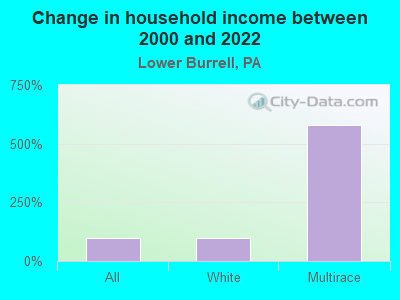
Change in median household income between 2000 and 2022:
Lower Burrell, Pennsylvania:
+97.1%
State:
+79.0%
Number of households with income < $10k:
Lower Burrell:
2.9% (157)
State:
5.5% (291,562)
Number of households with income $10k - 20k:
Lower Burrell:
5.8% (313)
State:
7.3% (384,726)
Number of households with income $20k - 30k:
Lower Burrell:
7.9% (424)
Pennsylvania:
7.4% (389,464)
Number of households with income $30k - 40k:
Lower Burrell:
9.0% (487)
State:
7.6% (402,138)
Number of households with income $40k - 50k:
Lower Burrell:
6.7% (361)
Pennsylvania:
7.3% (387,945)
Number of households with income $50k - 60k:
Lower Burrell:
7.7% (413)
Pennsylvania:
7.0% (372,468)
Number of households with income $60k - 75k:
Lower Burrell:
7.2% (387)
Pennsylvania:
9.9% (524,786)
Number of households with income $75k - 100k:
Lower Burrell:
16.6% (897)
Pennsylvania:
12.6% (666,253)
Number of households with income $100k - 125k:
Lower Burrell:
10.7% (577)
Pennsylvania:
9.9% (526,402)
Number of households with income $125k - 150k:
Lower Burrell:
8.8% (475)
Pennsylvania:
6.9% (362,702)
Number of households with income $150k - 200k:
Lower Burrell:
11.1% (597)
Pennsylvania:
8.3% (440,827)
Number of households with income > $200k:
Lower Burrell:
5.7% (310)
State:
10.3% (544,792)
Aggregate household income in Lower Burrell in 2022: $514,039,577
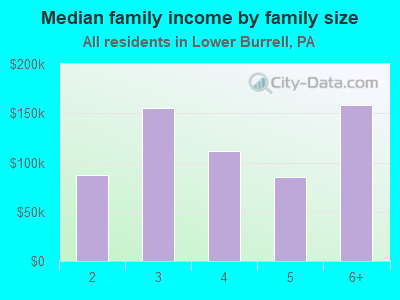
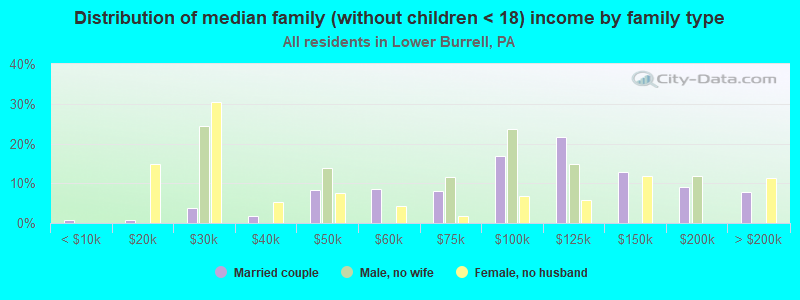
Median family income in Lower Burrell in 2022:
Lower Burrell:
$100,898
State:
$93,029
Number of families with income < $10k:
Lower Burrell:
0.3% (9)
State:
3.1% (101,868)
Number of families with income $10k - 20k:
Lower Burrell:
2.1% (73)
Pennsylvania:
3.5% (115,881)
Number of families with income $20k - 30k:
Lower Burrell:
4.9% (168)
State:
4.8% (156,521)
Number of families with income $30k - 40k:
Lower Burrell:
3.4% (116)
State:
5.8% (191,305)
Number of families with income $40k - 50k:
Lower Burrell:
5.8% (199)
State:
6.4% (211,380)
Number of families with income $50k - 60k:
Lower Burrell:
6.9% (238)
State:
6.4% (209,910)
Number of families with income $60k - 75k:
Lower Burrell:
8.5% (293)
State:
9.7% (318,991)
Number of families with income $75k - 100k:
Lower Burrell:
18.4% (634)
Pennsylvania:
14.0% (461,021)
Number of families with income $100k - 125k:
Lower Burrell:
14.7% (506)
State:
12.2% (400,961)
Number of families with income $125k - 150k:
Lower Burrell:
12.1% (416)
Pennsylvania:
8.8% (288,471)
Number of families with income $150k - 200k:
Lower Burrell:
15.0% (516)
State:
11.2% (367,642)
Number of families with income > $200k:
Lower Burrell:
7.9% (273)
State:
14.3% (470,863)
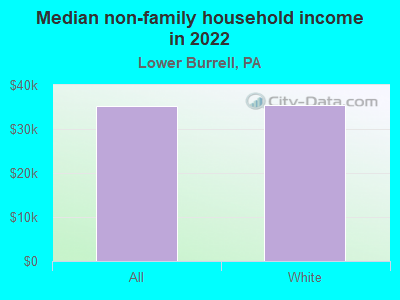
Median non-family income in Lower Burrell in 2022:
Lower Burrell:
$35,134
State:
$42,203
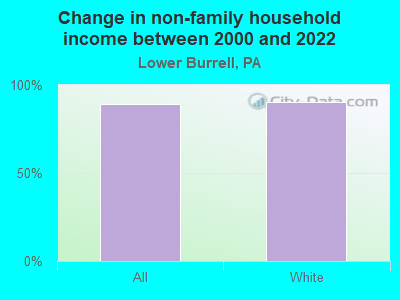
Change in median non-family income between 2000 and 2022:
Lower Burrell, Pennsylvania:
+89.3%
State:
+90.1%
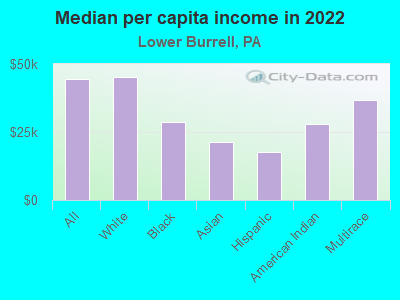
Median per capita income in Lower Burrell in 2022:
Lower Burrell:
$44,554
State:
$41,489
Change in median per capita income between 2000 and 2022:
Lower Burrell, Pennsylvania:
+121.2%
State:
+98.7%
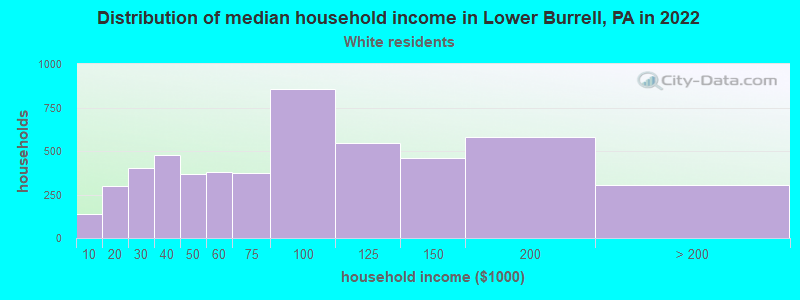
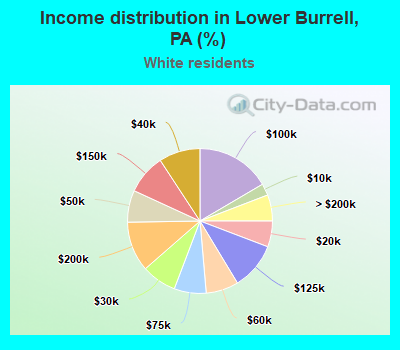
Income statistics for White residents
Median household income in Lower Burrell, PA in 2022:
Lower Burrell:
$80,462
Pennsylvania:
$76,765
Change in median household income between 2000 and 2022:
Lower Burrell, Pennsylvania:
+96.2%
State:
+84.3%
Number of households with income < $10k:
Lower Burrell:
2.6% (136)
Pennsylvania:
4.3% (179,792)
Number of households with income $10k - 20k:
Lower Burrell:
5.8% (299)
State:
6.5% (268,738)
Number of households with income $20k - 30k:
Lower Burrell:
7.8% (404)
State:
7.0% (288,138)
Number of households with income $30k - 40k:
Lower Burrell:
9.2% (478)
Pennsylvania:
7.2% (300,208)
Number of households with income $40k - 50k:
Lower Burrell:
7.1% (369)
Pennsylvania:
7.2% (298,756)
Number of households with income $50k - 60k:
Lower Burrell:
7.3% (377)
State:
6.8% (283,251)
Number of households with income $60k - 75k:
Lower Burrell:
7.2% (371)
Pennsylvania:
9.9% (408,159)
Number of households with income $75k - 100k:
Lower Burrell:
16.6% (858)
State:
13.2% (547,809)
Number of households with income $100k - 125k:
Lower Burrell:
10.6% (548)
State:
10.5% (436,652)
Number of households with income $125k - 150k:
Lower Burrell:
8.9% (462)
State:
7.3% (304,132)
Number of households with income $150k - 200k:
Lower Burrell:
11.2% (579)
State:
9.0% (374,658)
Number of households with income > $200k:
Lower Burrell:
5.8% (303)
State:
10.9% (452,618)
Aggregate household income in Lower Burrell in 2022: $498,343,406
Median family income in Lower Burrell in 2022:
Lower Burrell:
$100,419
State:
$99,396
Number of families with income < $10k:
Lower Burrell:
0.3% (10)
State:
2.2% (56,136)
Number of families with income $10k - 20k:
Lower Burrell:
1.9% (62)
State:
2.7% (69,032)
Number of families with income $20k - 30k:
Lower Burrell:
4.4% (142)
Pennsylvania:
3.9% (100,065)
Number of families with income $30k - 40k:
Lower Burrell:
3.2% (104)
State:
5.2% (134,367)
Number of families with income $40k - 50k:
Lower Burrell:
6.1% (199)
Pennsylvania:
6.0% (154,327)
Number of families with income $50k - 60k:
Lower Burrell:
6.4% (208)
State:
6.1% (157,983)
Number of families with income $60k - 75k:
Lower Burrell:
8.9% (292)
Pennsylvania:
9.6% (249,292)
Number of families with income $75k - 100k:
Lower Burrell:
18.6% (608)
Pennsylvania:
14.7% (379,316)
Number of families with income $100k - 125k:
Lower Burrell:
14.6% (479)
State:
12.9% (333,626)
Number of families with income $125k - 150k:
Lower Burrell:
12.3% (401)
State:
9.4% (243,915)
Number of families with income $150k - 200k:
Lower Burrell:
15.3% (501)
State:
12.2% (314,926)
Number of families with income > $200k:
Lower Burrell:
8.1% (266)
State:
15.1% (390,885)
Median non-family income in Lower Burrell in 2022:
Lower Burrell:
$35,351
State:
$44,251
Change in median non-family income between 2000 and 2022:
Lower Burrell, Pennsylvania:
+90.6%
State:
+94.2%
Median per capita income in Lower Burrell in 2022:
Lower Burrell:
$45,108
Pennsylvania:
$45,306
Change in median per capita income between 2000 and 2022:
Lower Burrell, Pennsylvania:
+122.7%
State:
+105.4%
Income statistics for Black or African American residents
Number of households with income < $10k:
Lower Burrell:
0.0% (0)
State:
12.0% (64,705)
Number of households with income $10k - 20k:
Lower Burrell:
100.0% (18)
State:
12.7% (68,459)
Number of households with income $20k - 30k:
Lower Burrell:
0.0% (0)
State:
9.3% (49,778)
Number of households with income $30k - 40k:
Lower Burrell:
0.0% (0)
Pennsylvania:
10.0% (53,629)
Number of households with income $40k - 50k:
Lower Burrell:
0.0% (0)
Pennsylvania:
8.5% (45,601)
Number of households with income $50k - 60k:
Lower Burrell:
0.0% (0)
State:
7.8% (41,725)
Number of households with income $60k - 75k:
Lower Burrell:
0.0% (0)
State:
10.4% (55,653)
Number of households with income $75k - 100k:
Lower Burrell:
0.0% (0)
Pennsylvania:
9.5% (51,281)
Number of households with income $100k - 125k:
Lower Burrell:
0.0% (0)
State:
7.1% (38,125)
Number of households with income $125k - 150k:
Lower Burrell:
0.0% (0)
State:
4.5% (24,172)
Number of households with income $150k - 200k:
Lower Burrell:
0.0% (0)
State:
4.0% (21,749)
Number of households with income > $200k:
Lower Burrell:
0.0% (0)
Pennsylvania:
4.2% (22,562)
Aggregate household income in Lower Burrell in 2022: $5,164,449
Median per capita income in Lower Burrell in 2022:
Lower Burrell:
$28,769
State:
$28,010
Change in median per capita income between 2000 and 2022:
Lower Burrell, Pennsylvania:
+31.1%
State:
+101.5%
Income statistics for Asian residents
Number of households with income < $10k:
Lower Burrell:
0.0% (0)
Pennsylvania:
5.8% (9,650)
Number of households with income $10k - 20k:
Lower Burrell:
0.0% (0)
State:
4.3% (7,158)
Number of households with income $20k - 30k:
Lower Burrell:
0.0% (0)
State:
5.7% (9,531)
Number of households with income $30k - 40k:
Lower Burrell:
0.0% (0)
Pennsylvania:
5.7% (9,580)
Number of households with income $40k - 50k:
Lower Burrell:
0.0% (0)
State:
5.4% (9,050)
Number of households with income $50k - 60k:
Lower Burrell:
100.0% (24)
State:
6.1% (10,189)
Number of households with income $60k - 75k:
Lower Burrell:
0.0% (0)
Pennsylvania:
7.8% (13,008)
Number of households with income $75k - 100k:
Lower Burrell:
0.0% (0)
State:
10.1% (16,923)
Number of households with income $100k - 125k:
Lower Burrell:
0.0% (0)
Pennsylvania:
8.8% (14,765)
Number of households with income $125k - 150k:
Lower Burrell:
0.0% (0)
State:
7.5% (12,634)
Number of households with income $150k - 200k:
Lower Burrell:
0.0% (0)
State:
10.0% (16,823)
Number of households with income > $200k:
Lower Burrell:
0.0% (0)
State:
22.9% (38,426)
Aggregate household income in Lower Burrell in 2022: $6,344,793
Median per capita income in Lower Burrell in 2022:
Lower Burrell:
$21,468
Pennsylvania:
$48,341
Income statistics for Hispanic or Latino residents
Median per capita income in Lower Burrell in 2022:
Lower Burrell:
$17,563
Pennsylvania:
$23,829
Change in median per capita income between 2000 and 2022:: -19.6%
Lower Burrell, Pennsylvania:
-19.6%
State:
+116.4%
Income statistics for American Indian and Alaska Native residents
Median per capita income in Lower Burrell in 2022:
Lower Burrell:
$27,832
State:
$22,548
Change in median per capita income between 2000 and 2022:
Lower Burrell, Pennsylvania:
+60.1%
Pennsylvania:
+45.8%
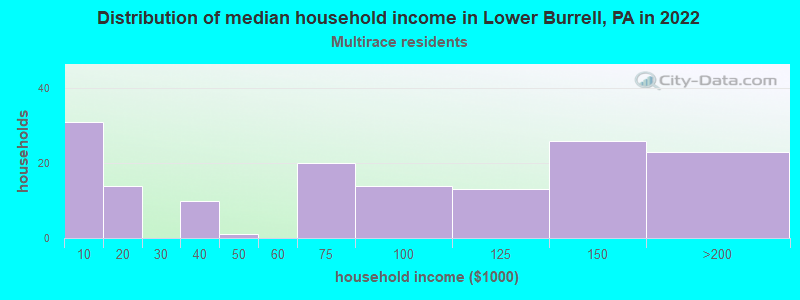
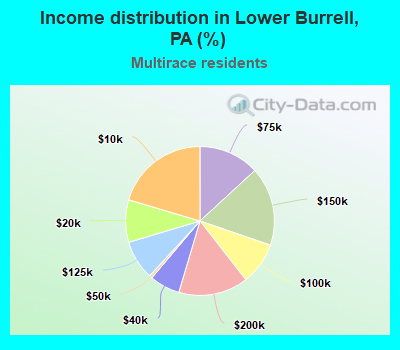
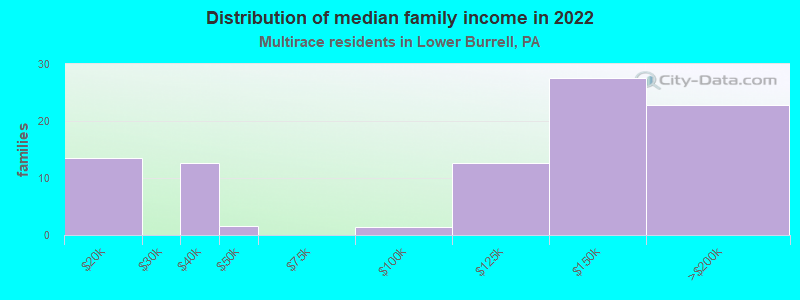
Income statistics for Multirace residents
Median household income in Lower Burrell, PA in 2022:
Lower Burrell:
$121,396
Pennsylvania:
$61,450
Number of households with income < $10k:
Lower Burrell:
20.4% (31)
State:
7.8% (21,911)
Number of households with income $10k - 20k:
Lower Burrell:
9.2% (14)
Pennsylvania:
8.2% (22,847)
Number of households with income $20k - 30k:
Lower Burrell:
0.0% (0)
Pennsylvania:
8.7% (24,252)
Number of households with income $30k - 40k:
Lower Burrell:
6.6% (10)
State:
7.3% (20,502)
Number of households with income $40k - 50k:
Lower Burrell:
0.7% (1)
State:
7.7% (21,525)
Number of households with income $50k - 60k:
Lower Burrell:
0.0% (0)
Pennsylvania:
8.6% (24,174)
Number of households with income $60k - 75k:
Lower Burrell:
13.2% (20)
State:
11.9% (33,350)
Number of households with income $75k - 100k:
Lower Burrell:
9.2% (14)
State:
11.5% (32,274)
Number of households with income $100k - 125k:
Lower Burrell:
8.6% (13)
State:
8.3% (23,361)
Number of households with income $125k - 150k:
Lower Burrell:
17.1% (26)
Pennsylvania:
5.3% (14,784)
Number of households with income $150k - 200k:
Lower Burrell:
15.1% (23)
State:
6.9% (19,314)
Number of households with income > $200k:
Lower Burrell:
0.0% (0)
State:
7.8% (21,759)
Aggregate household income in Lower Burrell in 2022: $13,781,307
Median family income in Lower Burrell in 2022:
Lower Burrell:
$139,062
State:
$70,158
Number of families with income $10k - 20k:
Lower Burrell:
14.6% (13)
State:
6.0% (10,561)
Number of families with income $30k - 40k:
Lower Burrell:
13.8% (13)
State:
6.9% (12,015)
Number of families with income $40k - 50k:
Lower Burrell:
1.8% (2)
State:
7.9% (13,877)
Number of families with income $75k - 100k:
Lower Burrell:
1.5% (1)
Pennsylvania:
12.4% (21,777)
Number of families with income $100k - 125k:
Lower Burrell:
13.8% (13)
State:
9.5% (16,618)
Number of families with income $125k - 150k:
Lower Burrell:
29.9% (28)
Pennsylvania:
6.8% (11,900)
Number of families with income $150k - 200k:
Lower Burrell:
24.7% (23)
Pennsylvania:
8.3% (14,537)
Median per capita income in Lower Burrell in 2022:
Lower Burrell:
$36,686
State:
$27,581
Discuss Lower Burrell, Pennsylvania (PA) on our hugely popular Pennsylvania forum.