The median household income in Lost Creek, TX in 2022 was $234,947, which was 69.2% greater than the median annual income of $72,284 across the entire state of Texas. Compared to the median income of $116,500 in 2000 this represents an increase of 50.4%. The per capita income in 2022 was $102,557, which means an increase of 49.2% compared to 2000 when it was $52,147.
Whole page based on the data from 2000 / 2022 when the population of Lost Creek, Texas was 4,729 / 5,253
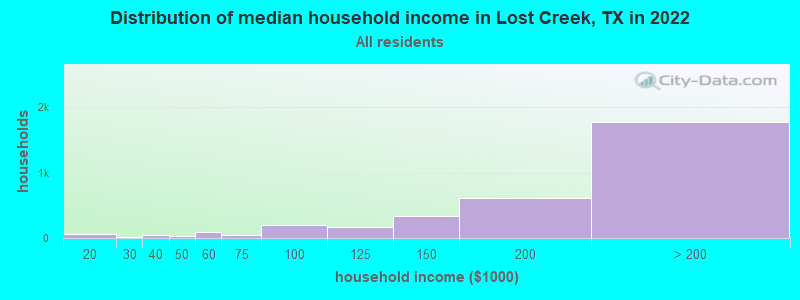
Income statistics for all residents
Median household income in Lost Creek, TX in 2022:
Lost Creek:
$234,948
Texas:
$72,284
Change in median household income between 2000 and 2022:
Lost Creek, Texas:
+101.7%
Texas:
+81.0%
Number of households with income < $10k:
Lost Creek:
0.3% (9)
Texas:
5.5% (611,011)
Number of households with income $10k - 20k:
Lost Creek:
1.6% (55)
State:
6.7% (743,157)
Number of households with income $20k - 30k:
Lost Creek:
0.4% (12)
State:
7.2% (803,381)
Number of households with income $30k - 40k:
Lost Creek:
1.2% (41)
State:
7.8% (866,080)
Number of households with income $40k - 50k:
Lost Creek:
1.0% (33)
State:
7.3% (810,440)
Number of households with income $50k - 60k:
Lost Creek:
2.5% (86)
State:
7.2% (799,783)
Number of households with income $60k - 75k:
Lost Creek:
1.5% (50)
State:
9.9% (1,095,384)
Number of households with income $75k - 100k:
Lost Creek:
6.0% (203)
Texas:
12.8% (1,419,057)
Number of households with income $100k - 125k:
Lost Creek:
5.0% (168)
Texas:
9.5% (1,054,577)
Number of households with income $125k - 150k:
Lost Creek:
9.9% (335)
State:
6.7% (741,518)
Number of households with income $150k - 200k:
Lost Creek:
18.2% (617)
Texas:
8.7% (961,776)
Number of households with income > $200k:
Lost Creek:
52.4% (1,772)
State:
10.7% (1,181,544)
Aggregate household income in Lost Creek in 2022: $544,515,283
Median family income in Lost Creek in 2022:
Lost Creek:
$253,004
State:
$86,267
Number of families with income < $10k:
Lost Creek:
0.3% (7)
State:
4.0% (297,884)
Number of families with income $10k - 20k:
Lost Creek:
0.4% (12)
Texas:
4.3% (324,514)
Number of families with income $20k - 30k:
Lost Creek:
0.4% (10)
Texas:
5.8% (430,949)
Number of families with income $30k - 40k:
Lost Creek:
1.2% (34)
State:
6.6% (493,535)
Number of families with income $40k - 50k:
Lost Creek:
1.2% (31)
State:
6.7% (499,663)
Number of families with income $50k - 60k:
Lost Creek:
1.6% (42)
Texas:
6.6% (492,203)
Number of families with income $60k - 75k:
Lost Creek:
0.3% (8)
State:
9.5% (710,229)
Number of families with income $75k - 100k:
Lost Creek:
4.5% (122)
Texas:
13.6% (1,015,480)
Number of families with income $100k - 125k:
Lost Creek:
4.7% (127)
State:
10.7% (797,961)
Number of families with income $125k - 150k:
Lost Creek:
7.6% (203)
State:
8.1% (602,985)
Number of families with income $150k - 200k:
Lost Creek:
21.9% (591)
State:
10.7% (804,459)
Number of families with income > $200k:
Lost Creek:
55.9% (1,506)
State:
13.5% (1,013,514)
Median non-family income in Lost Creek in 2022:
Lost Creek:
$139,932
State:
$45,999
Change in median non-family income between 2000 and 2022:
Lost Creek, Texas:
+74.9%
State:
+79.5%
Median per capita income in Lost Creek in 2022:
Lost Creek:
$102,558
Texas:
$38,123
Change in median per capita income between 2000 and 2022:
Lost Creek, Texas:
+96.7%
State:
+94.3%
Income statistics for White residents
Median household income in Lost Creek, TX in 2022:
Lost Creek:
$234,205
Texas:
$82,032
Change in median household income between 2000 and 2022:
Lost Creek, Texas:
+97.2%
State:
+91.0%
Number of households with income < $10k:
Lost Creek:
0.3% (7)
State:
4.7% (273,716)
Number of households with income $10k - 20k:
Lost Creek:
1.8% (48)
State:
5.5% (322,702)
Number of households with income $20k - 30k:
Lost Creek:
0.4% (10)
Texas:
6.2% (363,947)
Number of households with income $30k - 40k:
Lost Creek:
1.1% (28)
State:
6.8% (399,275)
Number of households with income $40k - 50k:
Lost Creek:
0.5% (14)
Texas:
6.5% (383,417)
Number of households with income $50k - 60k:
Lost Creek:
1.8% (48)
Texas:
6.6% (388,535)
Number of households with income $60k - 75k:
Lost Creek:
1.5% (40)
State:
9.7% (566,295)
Number of households with income $75k - 100k:
Lost Creek:
5.6% (149)
Texas:
13.0% (760,276)
Number of households with income $100k - 125k:
Lost Creek:
5.2% (138)
Texas:
10.2% (597,596)
Number of households with income $125k - 150k:
Lost Creek:
10.8% (285)
State:
7.4% (436,830)
Number of households with income $150k - 200k:
Lost Creek:
18.3% (484)
State:
9.9% (583,067)
Number of households with income > $200k:
Lost Creek:
52.8% (1,400)
State:
13.5% (792,647)
Aggregate household income in Lost Creek in 2022: $444,052,506
Median family income in Lost Creek in 2022:
Lost Creek:
$246,282
Texas:
$101,788
Number of families with income < $10k:
Lost Creek:
0.3% (7)
Texas:
2.8% (108,142)
Number of families with income $10k - 20k:
Lost Creek:
0.5% (11)
State:
2.9% (113,421)
Number of families with income $20k - 30k:
Lost Creek:
0.4% (8)
State:
4.1% (157,688)
Number of families with income $30k - 40k:
Lost Creek:
1.1% (23)
State:
5.2% (198,847)
Number of families with income $40k - 50k:
Lost Creek:
0.7% (14)
Texas:
5.6% (216,490)
Number of families with income $50k - 60k:
Lost Creek:
1.1% (22)
Texas:
5.7% (220,689)
Number of families with income $60k - 75k:
Lost Creek:
0.3% (6)
State:
9.0% (346,106)
Number of families with income $75k - 100k:
Lost Creek:
4.1% (85)
Texas:
13.7% (527,363)
Number of families with income $100k - 125k:
Lost Creek:
5.0% (106)
State:
11.6% (448,411)
Number of families with income $125k - 150k:
Lost Creek:
8.0% (169)
Texas:
9.2% (355,798)
Number of families with income $150k - 200k:
Lost Creek:
22.1% (464)
State:
12.5% (480,185)
Number of families with income > $200k:
Lost Creek:
56.5% (1,188)
Texas:
17.6% (677,490)
Median non-family income in Lost Creek in 2022:
Lost Creek:
$141,021
Texas:
$50,587
Change in median non-family income between 2000 and 2022:
Lost Creek, Texas:
+80.3%
State:
+87.7%
Median per capita income in Lost Creek in 2022:
Lost Creek:
$106,519
State:
$47,740
Change in median per capita income between 2000 and 2022:
Lost Creek, Texas:
+98.9%
State:
+114.3%
Income statistics for Asian residents
Median household income in Lost Creek, TX in 2022:
Lost Creek:
$373,057
Texas:
$107,673
Number of households with income < $10k:
Lost Creek:
0.0% (0)
State:
5.2% (29,885)
Number of households with income $10k - 20k:
Lost Creek:
0.0% (0)
State:
4.7% (27,044)
Number of households with income $20k - 30k:
Lost Creek:
0.0% (0)
State:
4.1% (23,363)
Number of households with income $30k - 40k:
Lost Creek:
0.0% (0)
State:
4.1% (23,309)
Number of households with income $40k - 50k:
Lost Creek:
0.0% (0)
State:
5.2% (29,826)
Number of households with income $50k - 60k:
Lost Creek:
7.0% (16)
State:
4.7% (26,512)
Number of households with income $60k - 75k:
Lost Creek:
0.0% (0)
Texas:
6.5% (36,905)
Number of households with income $75k - 100k:
Lost Creek:
5.7% (13)
State:
11.3% (64,350)
Number of households with income $100k - 125k:
Lost Creek:
0.0% (0)
Texas:
11.4% (64,714)
Number of households with income $125k - 150k:
Lost Creek:
0.0% (0)
State:
9.3% (52,719)
Number of households with income $150k - 200k:
Lost Creek:
5.7% (13)
State:
12.5% (70,953)
Number of households with income > $200k:
Lost Creek:
81.6% (186)
Texas:
21.1% (120,260)
Aggregate household income in Lost Creek in 2022: $36,890,335
Median family income in Lost Creek in 2022:
Lost Creek:
$367,669
Texas:
$123,328
Number of families with income $50k - 60k:
Lost Creek:
7.0% (16)
Texas:
4.7% (20,568)
Number of families with income $75k - 100k:
Lost Creek:
5.7% (13)
State:
10.7% (46,626)
Number of families with income $150k - 200k:
Lost Creek:
5.2% (12)
State:
14.7% (64,203)
Number of families with income > $200k:
Lost Creek:
82.1% (190)
Texas:
24.8% (108,511)
Median per capita income in Lost Creek in 2022:
Lost Creek:
$137,150
State:
$48,626
Income statistics for Hispanic or Latino residents
Median household income in Lost Creek, TX in 2022:
Lost Creek:
$252,525
State:
$60,504
Change in median household income between 2000 and 2022:
Lost Creek, Texas:
+96.5%
State:
+102.5%
Number of households with income < $10k:
Lost Creek:
0.0% (0)
State:
5.8% (213,953)
Number of households with income $10k - 20k:
Lost Creek:
0.0% (0)
State:
8.0% (297,456)
Number of households with income $20k - 30k:
Lost Creek:
0.0% (0)
Texas:
9.2% (340,166)
Number of households with income $30k - 40k:
Lost Creek:
0.0% (0)
State:
9.5% (354,336)
Number of households with income $40k - 50k:
Lost Creek:
0.0% (0)
State:
8.8% (327,013)
Number of households with income $50k - 60k:
Lost Creek:
4.4% (14)
State:
8.3% (308,818)
Number of households with income $60k - 75k:
Lost Creek:
0.0% (0)
Texas:
10.9% (405,109)
Number of households with income $75k - 100k:
Lost Creek:
8.1% (26)
Texas:
13.8% (511,639)
Number of households with income $100k - 125k:
Lost Creek:
0.0% (0)
Texas:
8.6% (319,728)
Number of households with income $125k - 150k:
Lost Creek:
0.0% (0)
State:
5.7% (210,932)
Number of households with income $150k - 200k:
Lost Creek:
42.8% (137)
State:
6.4% (236,055)
Number of households with income > $200k:
Lost Creek:
44.7% (143)
State:
5.1% (189,259)
Aggregate household income in Lost Creek in 2022: $61,100,279
Median family income in Lost Creek in 2022:
Lost Creek:
$293,028
State:
$65,080
Number of families with income $50k - 60k:
Lost Creek:
4.8% (14)
State:
8.0% (223,566)
Number of families with income $150k - 200k:
Lost Creek:
44.6% (126)
State:
7.3% (202,259)
Number of families with income > $200k:
Lost Creek:
50.6% (142)
State:
5.9% (165,129)
Median non-family income in Lost Creek in 2022:
Lost Creek:
$170,361
State:
$39,934
Change in median non-family income between 2000 and 2022:
Lost Creek, Texas:
+87.3%
State:
+109.1%
Median per capita income in Lost Creek in 2022:
Lost Creek:
$151,235
State:
$24,862
Income statistics for Multirace residents
Median household income in Lost Creek, TX in 2022:
Lost Creek:
$297,973
State:
$62,748
Change in median household income between 2000 and 2022:
Lost Creek, Texas:
+134.1%
State:
+92.3%
Number of households with income < $10k:
Lost Creek:
0.0% (0)
State:
5.5% (122,324)
Number of households with income $10k - 20k:
Lost Creek:
0.0% (0)
State:
8.2% (182,232)
Number of households with income $20k - 30k:
Lost Creek:
0.0% (0)
Texas:
8.5% (189,456)
Number of households with income $30k - 40k:
Lost Creek:
54.4% (87)
State:
8.9% (197,499)
Number of households with income $40k - 50k:
Lost Creek:
0.0% (0)
State:
8.7% (191,735)
Number of households with income $50k - 60k:
Lost Creek:
45.6% (73)
Texas:
8.0% (177,535)
Number of households with income $60k - 75k:
Lost Creek:
0.0% (0)
State:
10.5% (232,479)
Number of households with income $75k - 100k:
Lost Creek:
0.0% (0)
State:
13.1% (290,448)
Number of households with income $100k - 125k:
Lost Creek:
0.0% (0)
Texas:
8.6% (191,595)
Number of households with income $125k - 150k:
Lost Creek:
0.0% (0)
State:
6.0% (133,361)
Number of households with income $150k - 200k:
Lost Creek:
0.0% (0)
State:
7.2% (159,195)
Number of households with income > $200k:
Lost Creek:
0.0% (0)
State:
6.7% (148,064)
Aggregate household income in Lost Creek in 2022: $50,077,009
Median non-family income in Lost Creek in 2022:
Lost Creek:
$278,788
State:
$40,634
Change in median non-family income between 2000 and 2022:
Lost Creek, Texas:
+119.0%
State:
+77.2%
Median per capita income in Lost Creek in 2022:
Lost Creek:
$35,640
State:
$26,785
Change in median per capita income between 2000 and 2022:: -42.3%
Lost Creek, Texas:
-42.3%
Texas:
+110.9%
Income statistics for other residents
Median per capita income in Lost Creek in 2022:
Lost Creek:
$42,264
State:
$23,899
Change in median per capita income between 2000 and 2022:
Lost Creek, Texas:
+132.5%
Texas:
+135.2%
Discuss Lost Creek, Texas (TX) on our hugely popular Texas forum.