The median household income in Herlong, CA in 2022 was $61,014, which was 50.0% less than the median annual income of $91,551 across the entire state of California. Compared to the median income of $36,310 in 2000 this represents an increase of 40.5%. The per capita income in 2022 was $7,397, which means a decrease of 99.4% compared to 2000 when it was $14,749.
Whole page based on the data from 2000 / 2022 when the population of Herlong, California was 298 / 1,269
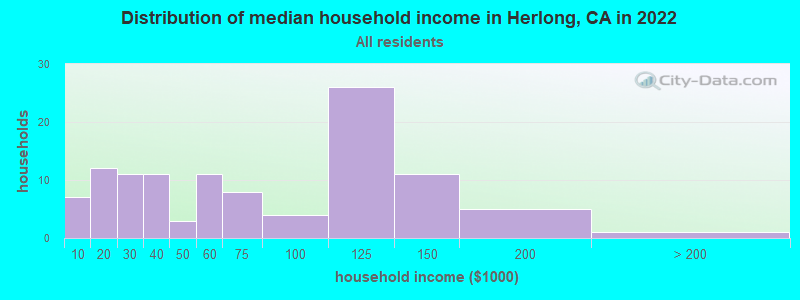
Income statistics for all residents
Median household income in Herlong, CA in 2022:
Herlong:
$61,014
State:
$91,551
Change in median household income between 2000 and 2022:
Herlong, California:
+68.0%
State:
+92.8%
Number of households with income < $10k:
Herlong:
6.4% (7)
State:
4.8% (654,370)
Number of households with income $10k - 20k:
Herlong:
10.9% (12)
California:
5.8% (789,493)
Number of households with income $20k - 30k:
Herlong:
10.0% (11)
State:
5.7% (778,318)
Number of households with income $30k - 40k:
Herlong:
10.0% (11)
State:
5.8% (783,170)
Number of households with income $40k - 50k:
Herlong:
2.7% (3)
State:
5.8% (781,352)
Number of households with income $50k - 60k:
Herlong:
10.0% (11)
State:
5.6% (760,175)
Number of households with income $60k - 75k:
Herlong:
7.3% (8)
State:
8.2% (1,104,699)
Number of households with income $75k - 100k:
Herlong:
3.6% (4)
State:
12.0% (1,627,633)
Number of households with income $100k - 125k:
Herlong:
23.6% (26)
California:
10.0% (1,358,619)
Number of households with income $125k - 150k:
Herlong:
10.0% (11)
California:
7.6% (1,027,455)
Number of households with income $150k - 200k:
Herlong:
4.5% (5)
California:
10.6% (1,439,811)
Number of households with income > $200k:
Herlong:
0.9% (1)
State:
18.0% (2,445,491)
Aggregate household income in Herlong in 2022: $8,190,121
Median family income in Herlong in 2022:
Herlong:
$47,415
State:
$104,823
Number of families with income < $10k:
Herlong:
7.6% (4)
State:
3.1% (280,184)
Number of families with income $10k - 20k:
Herlong:
1.8% (1)
California:
3.5% (322,064)
Number of families with income $20k - 30k:
Herlong:
12.0% (7)
California:
4.7% (433,722)
Number of families with income $30k - 40k:
Herlong:
12.6% (7)
State:
5.2% (478,213)
Number of families with income $40k - 50k:
Herlong:
17.3% (10)
State:
5.6% (511,647)
Number of families with income $50k - 60k:
Herlong:
7.1% (4)
State:
5.5% (498,926)
Number of families with income $60k - 75k:
Herlong:
11.0% (6)
State:
8.0% (731,094)
Number of families with income $75k - 100k:
Herlong:
3.6% (2)
State:
12.2% (1,115,621)
Number of families with income $100k - 125k:
Herlong:
23.4% (13)
California:
10.5% (959,600)
Number of families with income $150k - 200k:
Herlong:
3.5% (2)
California:
11.9% (1,087,239)
Median per capita income in Herlong in 2022:
Herlong:
$7,398
State:
$46,661
Change in median per capita income between 2000 and 2022:: -49.8%
Herlong, California:
-49.8%
California:
+105.5%
Income statistics for White residents
Median household income in Herlong, CA in 2022:
Herlong:
$66,601
California:
$100,917
Change in median household income between 2000 and 2022:
Herlong, California:
+80.3%
California:
+96.8%
Number of households with income < $10k:
Herlong:
8.1% (6)
State:
4.4% (284,109)
Number of households with income $10k - 20k:
Herlong:
6.8% (5)
State:
5.3% (340,330)
Number of households with income $20k - 30k:
Herlong:
10.8% (8)
State:
5.3% (343,145)
Number of households with income $30k - 40k:
Herlong:
8.1% (6)
State:
5.1% (330,146)
Number of households with income $40k - 50k:
Herlong:
2.7% (2)
State:
5.2% (335,310)
Number of households with income $50k - 60k:
Herlong:
9.5% (7)
State:
5.1% (326,299)
Number of households with income $60k - 75k:
Herlong:
9.5% (7)
State:
7.6% (487,640)
Number of households with income $75k - 100k:
Herlong:
2.7% (2)
State:
11.5% (736,578)
Number of households with income $100k - 125k:
Herlong:
23.0% (17)
California:
10.1% (648,782)
Number of households with income $125k - 150k:
Herlong:
12.2% (9)
California:
7.8% (499,671)
Number of households with income $150k - 200k:
Herlong:
5.4% (4)
California:
11.4% (729,603)
Number of households with income > $200k:
Herlong:
1.4% (1)
State:
21.2% (1,364,246)
Aggregate household income in Herlong in 2022: $6,077,042
Median family income in Herlong in 2022:
Herlong:
$50,191
State:
$125,379
Number of families with income < $10k:
Herlong:
9.5% (3)
State:
2.2% (87,079)
Number of families with income $10k - 20k:
Herlong:
2.1% (1)
State:
2.5% (97,716)
Number of families with income $20k - 30k:
Herlong:
14.7% (5)
California:
3.5% (137,295)
Number of families with income $30k - 40k:
Herlong:
8.7% (3)
State:
3.9% (152,947)
Number of families with income $40k - 50k:
Herlong:
21.3% (7)
State:
4.3% (169,197)
Number of families with income $50k - 60k:
Herlong:
6.6% (2)
California:
4.5% (176,192)
Number of families with income $60k - 75k:
Herlong:
14.3% (5)
State:
7.0% (274,752)
Number of families with income $100k - 125k:
Herlong:
17.6% (6)
State:
10.7% (423,630)
Number of families with income $150k - 200k:
Herlong:
5.1% (2)
California:
13.5% (532,693)
Median per capita income in Herlong in 2022:
Herlong:
$10,275
California:
$61,706
Change in median per capita income between 2000 and 2022:: -35.5%
Herlong, California:
-35.5%
State:
+122.7%
Income statistics for Black or African American residents
Aggregate household income in Herlong in 2022: $572,959
Median per capita income in Herlong in 2022:
Herlong:
$13,386
California:
$36,708
Change in median per capita income between 2000 and 2022:
Herlong, California:
+60.5%
State:
+110.4%
Income statistics for Asian residents
Median per capita income in Herlong in 2022:
Herlong:
$30,311
California:
$58,824
Change in median per capita income between 2000 and 2022:
Herlong, California:
+76.3%
California:
+166.8%
Income statistics for Hispanic or Latino residents
Aggregate household income in Herlong in 2022: $353,161
Median per capita income in Herlong in 2022:
Herlong:
$1,951
California:
$27,240
Change in median per capita income between 2000 and 2022:: -80.6%
Herlong, California:
-80.6%
State:
+133.3%
Income statistics for American Indian and Alaska Native residents
Aggregate household income in Herlong in 2022: $43,018,687
Median per capita income in Herlong in 2022:
Herlong:
$2,120
State:
$30,289
Change in median per capita income between 2000 and 2022:: -76.8%
Herlong, California:
-76.8%
State:
+98.9%
Income statistics for Multirace residents
Number of households with income < $10k:
Herlong:
0.0% (0)
California:
4.2% (85,299)
Number of households with income $10k - 20k:
Herlong:
52.9% (9)
State:
6.1% (122,966)
Number of households with income $20k - 30k:
Herlong:
17.6% (3)
California:
6.4% (129,328)
Number of households with income $30k - 40k:
Herlong:
0.0% (0)
State:
6.4% (130,070)
Number of households with income $40k - 50k:
Herlong:
0.0% (0)
California:
6.5% (131,254)
Number of households with income $50k - 60k:
Herlong:
11.8% (2)
California:
6.5% (132,382)
Number of households with income $60k - 75k:
Herlong:
0.0% (0)
State:
9.4% (191,472)
Number of households with income $75k - 100k:
Herlong:
17.6% (3)
State:
13.3% (269,691)
Number of households with income $100k - 125k:
Herlong:
0.0% (0)
California:
10.2% (207,286)
Number of households with income $125k - 150k:
Herlong:
0.0% (0)
California:
7.8% (158,259)
Number of households with income $150k - 200k:
Herlong:
0.0% (0)
California:
10.3% (209,227)
Number of households with income > $200k:
Herlong:
0.0% (0)
State:
13.0% (263,210)
Aggregate household income in Herlong in 2022: $566,002
Median non-family income in Herlong in 2022:
Herlong:
$18,941
State:
$56,558
Change in median non-family income between 2000 and 2022:: -18.1%
Herlong, California:
-18.1%
State:
+100.2%
Median per capita income in Herlong in 2022:
Herlong:
$12,734
State:
$32,124
Change in median per capita income between 2000 and 2022:: -8.0%
Herlong, California:
-8.0%
California:
+120.4%
Discuss Herlong, California (CA) on our hugely popular California forum.