The median household income in Glen Ellen, CA in 2022 was $243,865, which was 62.5% greater than the median annual income of $91,551 across the entire state of California. Compared to the median income of $52,143 in 2000 this represents an increase of 78.6%. The per capita income in 2022 was $209,555, which means an increase of 89.2% compared to 2000 when it was $22,680.
Whole page based on the data from 2000 / 2022 when the population of Glen Ellen, California was 992 / 986
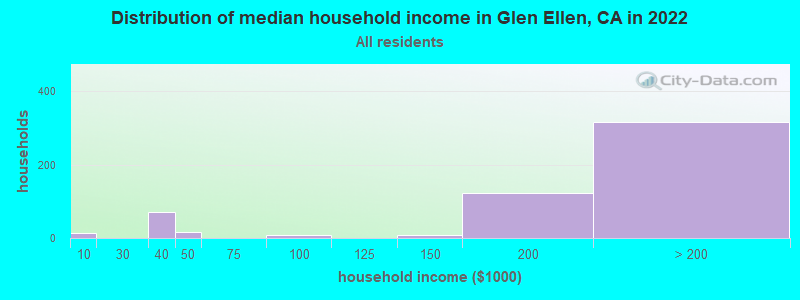
Income statistics for all residents
Median household income in Glen Ellen, CA in 2022:
Glen Ellen:
$243,866
California:
$91,551
Number of households with income < $10k:
Glen Ellen:
2.5% (14)
State:
4.8% (654,370)
Number of households with income $10k - 20k:
Glen Ellen:
0.0% (0)
California:
5.8% (789,493)
Number of households with income $20k - 30k:
Glen Ellen:
0.0% (0)
State:
5.7% (778,318)
Number of households with income $30k - 40k:
Glen Ellen:
12.8% (71)
State:
5.8% (783,170)
Number of households with income $40k - 50k:
Glen Ellen:
2.9% (16)
State:
5.8% (781,352)
Number of households with income $50k - 60k:
Glen Ellen:
0.0% (0)
State:
5.6% (760,175)
Number of households with income $60k - 75k:
Glen Ellen:
0.0% (0)
California:
8.2% (1,104,699)
Number of households with income $75k - 100k:
Glen Ellen:
1.4% (8)
State:
12.0% (1,627,633)
Number of households with income $100k - 125k:
Glen Ellen:
0.0% (0)
State:
10.0% (1,358,619)
Number of households with income $125k - 150k:
Glen Ellen:
1.3% (7)
California:
7.6% (1,027,455)
Number of households with income $150k - 200k:
Glen Ellen:
22.0% (122)
State:
10.6% (1,439,811)
Number of households with income > $200k:
Glen Ellen:
57.0% (316)
California:
18.0% (2,445,491)
Aggregate household income in Glen Ellen in 2022: $209,448,971
Median family income in Glen Ellen in 2022:
Glen Ellen:
$204,502
California:
$104,823
Number of families with income < $10k:
Glen Ellen:
6.9% (9)
California:
3.1% (280,184)
Number of families with income $125k - 150k:
Glen Ellen:
5.7% (7)
California:
8.4% (768,725)
Number of families with income $150k - 200k:
Glen Ellen:
33.1% (42)
State:
11.9% (1,087,239)
Number of families with income > $200k:
Glen Ellen:
54.3% (69)
California:
21.5% (1,963,769)
Median income for 2 person families:
Glen Ellen:
$194,370
State:
$92,781
Median non-family income in Glen Ellen in 2022:
Glen Ellen:
$251,682
California:
$59,348
Median per capita income in Glen Ellen in 2022:
Glen Ellen:
$209,556
State:
$46,661
Income statistics for White residents
Median household income in Glen Ellen, CA in 2022:
Glen Ellen:
$242,888
State:
$100,917
Number of households with income < $10k:
Glen Ellen:
3.3% (13)
State:
4.4% (284,109)
Number of households with income $10k - 20k:
Glen Ellen:
0.0% (0)
California:
5.3% (340,330)
Number of households with income $20k - 30k:
Glen Ellen:
0.0% (0)
State:
5.3% (343,145)
Number of households with income $30k - 40k:
Glen Ellen:
0.0% (0)
California:
5.1% (330,146)
Number of households with income $40k - 50k:
Glen Ellen:
3.5% (14)
State:
5.2% (335,310)
Number of households with income $50k - 60k:
Glen Ellen:
0.0% (0)
California:
5.1% (326,299)
Number of households with income $60k - 75k:
Glen Ellen:
0.0% (0)
State:
7.6% (487,640)
Number of households with income $75k - 100k:
Glen Ellen:
1.8% (7)
State:
11.5% (736,578)
Number of households with income $100k - 125k:
Glen Ellen:
0.0% (0)
State:
10.1% (648,782)
Number of households with income $125k - 150k:
Glen Ellen:
1.5% (6)
State:
7.8% (499,671)
Number of households with income $150k - 200k:
Glen Ellen:
16.4% (65)
State:
11.4% (729,603)
Number of households with income > $200k:
Glen Ellen:
73.6% (292)
State:
21.2% (1,364,246)
Aggregate household income in Glen Ellen in 2022: $182,979,825
Median family income in Glen Ellen in 2022:
Glen Ellen:
$211,869
California:
$125,379
Number of families with income < $10k:
Glen Ellen:
11.0% (10)
California:
2.2% (87,079)
Number of families with income $125k - 150k:
Glen Ellen:
7.1% (6)
State:
9.1% (357,408)
Number of families with income $150k - 200k:
Glen Ellen:
11.5% (10)
State:
13.5% (532,693)
Number of families with income > $200k:
Glen Ellen:
70.4% (64)
State:
27.6% (1,086,948)
Median non-family income in Glen Ellen in 2022:
Glen Ellen:
$251,818
State:
$62,819
Median per capita income in Glen Ellen in 2022:
Glen Ellen:
$235,562
State:
$61,706
Income statistics for Hispanic or Latino residents
Number of households with income < $10k:
Glen Ellen:
0.0% (0)
State:
4.3% (183,294)
Number of households with income $10k - 20k:
Glen Ellen:
0.0% (0)
State:
6.0% (253,903)
Number of households with income $20k - 30k:
Glen Ellen:
0.0% (0)
California:
6.8% (286,386)
Number of households with income $30k - 40k:
Glen Ellen:
93.0% (93)
State:
7.4% (313,728)
Number of households with income $40k - 50k:
Glen Ellen:
0.0% (0)
California:
7.4% (313,199)
Number of households with income $50k - 60k:
Glen Ellen:
0.0% (0)
State:
7.2% (305,366)
Number of households with income $60k - 75k:
Glen Ellen:
0.0% (0)
California:
10.3% (434,937)
Number of households with income $75k - 100k:
Glen Ellen:
0.0% (0)
State:
14.4% (607,302)
Number of households with income $100k - 125k:
Glen Ellen:
0.0% (0)
State:
10.6% (447,424)
Number of households with income $125k - 150k:
Glen Ellen:
7.0% (7)
California:
7.5% (316,022)
Number of households with income $150k - 200k:
Glen Ellen:
0.0% (0)
State:
9.2% (386,269)
Number of households with income > $200k:
Glen Ellen:
0.0% (0)
California:
8.8% (372,651)
Aggregate household income in Glen Ellen in 2022: $4,080,505
Median per capita income in Glen Ellen in 2022:
Glen Ellen:
$7,935
California:
$27,240
Change in median per capita income between 2000 and 2022:: -46.4%
Glen Ellen, California:
-46.4%
California:
+133.3%
Income statistics for Multirace residents
Number of households with income < $10k:
Glen Ellen:
0.0% (0)
State:
4.2% (85,299)
Number of households with income $10k - 20k:
Glen Ellen:
0.0% (0)
State:
6.1% (122,966)
Number of households with income $20k - 30k:
Glen Ellen:
0.0% (0)
State:
6.4% (129,328)
Number of households with income $30k - 40k:
Glen Ellen:
0.0% (0)
State:
6.4% (130,070)
Number of households with income $40k - 50k:
Glen Ellen:
0.0% (0)
State:
6.5% (131,254)
Number of households with income $50k - 60k:
Glen Ellen:
0.0% (0)
State:
6.5% (132,382)
Number of households with income $60k - 75k:
Glen Ellen:
0.0% (0)
State:
9.4% (191,472)
Number of households with income $75k - 100k:
Glen Ellen:
0.0% (0)
State:
13.3% (269,691)
Number of households with income $100k - 125k:
Glen Ellen:
0.0% (0)
California:
10.2% (207,286)
Number of households with income $125k - 150k:
Glen Ellen:
0.0% (0)
California:
7.8% (158,259)
Number of households with income $150k - 200k:
Glen Ellen:
100.0% (70)
California:
10.3% (209,227)
Number of households with income > $200k:
Glen Ellen:
0.0% (0)
State:
13.0% (263,210)
Median per capita income in Glen Ellen in 2022:
Glen Ellen:
$7,137
State:
$32,124
Change in median per capita income between 2000 and 2022:
Glen Ellen, California:
+137.9%
State:
+120.4%
Income statistics for other residents
Number of households with income < $10k:
Glen Ellen:
0.0% (0)
State:
4.6% (93,035)
Number of households with income $10k - 20k:
Glen Ellen:
0.0% (0)
State:
6.3% (126,222)
Number of households with income $20k - 30k:
Glen Ellen:
0.0% (0)
State:
7.1% (142,656)
Number of households with income $30k - 40k:
Glen Ellen:
100.0% (100)
State:
8.2% (165,018)
Number of households with income $40k - 50k:
Glen Ellen:
0.0% (0)
State:
8.0% (161,732)
Number of households with income $50k - 60k:
Glen Ellen:
0.0% (0)
California:
7.6% (152,152)
Number of households with income $60k - 75k:
Glen Ellen:
0.0% (0)
California:
10.4% (209,951)
Number of households with income $75k - 100k:
Glen Ellen:
0.0% (0)
California:
14.7% (296,102)
Number of households with income $100k - 125k:
Glen Ellen:
0.0% (0)
State:
10.7% (214,281)
Number of households with income $125k - 150k:
Glen Ellen:
0.0% (0)
State:
7.1% (143,092)
Number of households with income $150k - 200k:
Glen Ellen:
0.0% (0)
California:
8.6% (172,215)
Number of households with income > $200k:
Glen Ellen:
0.0% (0)
State:
6.7% (134,102)
Aggregate household income in Glen Ellen in 2022: $3,381,580
Median per capita income in Glen Ellen in 2022:
Glen Ellen:
$23,057
California:
$25,164
Change in median per capita income between 2000 and 2022:
Glen Ellen, California:
+96.0%
State:
+137.9%
Discuss Glen Ellen, California (CA) on our hugely popular California forum.